 21-Plex
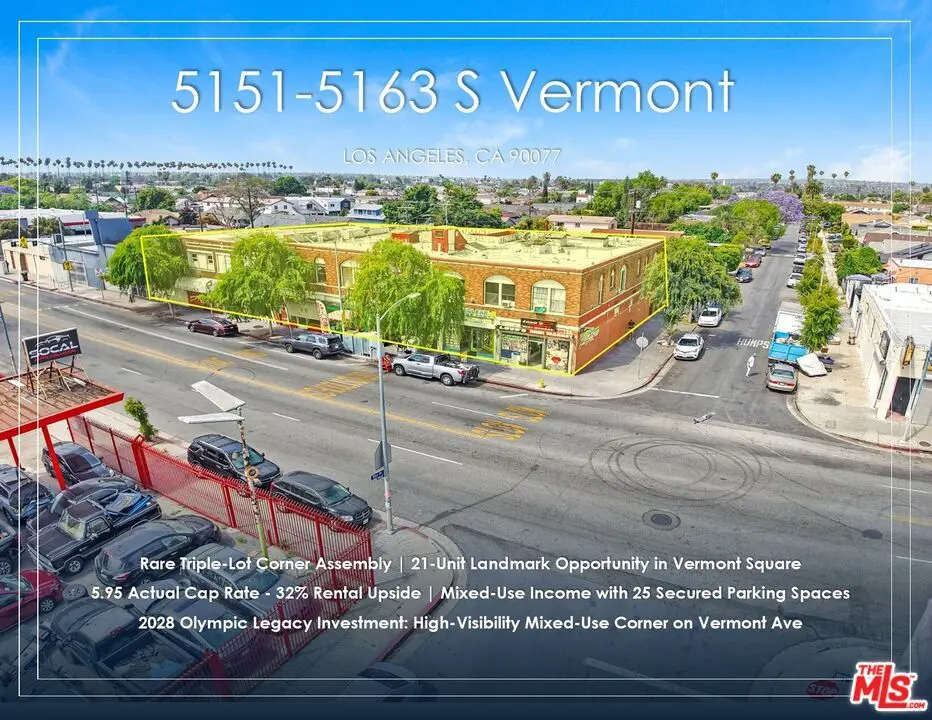
5151 S Vermont Ave · Los Angeles, CA
Flood risk No data
- FEMA flood zone
- —
- Chance of flooding over 30 yrs
- —
- Est. flood insurance / yr
- —
Fire risk No data
- Est. fire insurance / yr
- —
Heat risk No data
- Hot days now (above threshold)
- —
- Hot days in 30 yrs
- —
Wind risk No data
- Chance of severe wind over 30 yrs
- —
Air-quality risk No data
- Unhealthy air days now
- —
- Unhealthy air days in 30 yrs
- —
Risk factors via First Street. Map © Google.
Why this score? — see what drove the B- grade
The composite is a weighted blend of 9 inputs, each scored 0–100. Each bar is that input's sub-score; the figure is the points it added to the 100-point composite (weight × sub-score).
- Cash flow +30.0/30.0
- 1% rule +10.0/10.0
- DSCR +10.0/10.0
- ARV discount +7.5/15.0
- Schools +3.6/10.0
- Livability +3.4/5.0
- Rent growth +2.9/5.0
- Condition / age +2.5/5.0
- Appreciation +0.0/10.0
$3,695,000
🖨 Deal sheet (PDF) 📄 Offer letter ✓ Due diligence
Multi-family units
County records classify this as Multi-Family (5+ Unit). Listing-text estimate: 21 units. confirmed
5+ unit building — per-unit beds/baths from public records are typically unavailable; the breakdown below (if shown) is an estimate from the listing text.
Listing remarks MLS
BACK ON THE MARKET AGAIN. GREAT INCOME!!!! THIS PROPERTY IS A RETROFITTED BRICK BUILDING COMPOSED OF RESIDENTIAL AND RETAIL UNITS NEAR USC, LA COLISEUM AND SCIENCE MUSIUM. THE PROPERTY IS LOCATED ON 5151 S. VERMONT(5002-030-017 /BUILDING:12,972SQ/FT) & 5161 S. VERMONT(5002-030-018 / BUILDING: 5,984SQ/FT)17,282 SQ/FT. LOT WITH 6 RETAILS, 6 1-BED AND 8 SINGLES PLUS 28 PARKING SPACES LOCATED IN THE BACK OF THE BUILDING. #14: SINGLE / $950.. .. . 6 RETAIL SHOPS: $9,610 / MONTH. EVERY UNIT IS INDIVIDUALLY METERD FOR GAS AND ELECTRIC. .. .PROPERTY SHALL BE SOLD IN "AS-IS" CONDITION. .. PLEASE DO NOT DISTURB THE TENANTS, ,, ,, , DRIVE BY ONLY. .. .. ."SUBJECT TO INSPECTION UPON ACCEPTED OFFER"
Key facts
- C2-zoned lot
- Two buildings
- 0.44 acre lot
Tags
Property features AI
Finance
- Other: Property zoning: LAC2; Two buildings on the site; Mixed-use unit types; Unit breakdowns provided: 8 like units of Unit Type 1 (1 bed / 1 bath) with actual rent $1,472.10 (projected $2,000); 6 like units of Unit Type 2 (studio / 1 bath) with actual rent $1,157.20 (projected $1,660); 7 like units of Unit Type 3 (1 bed / 1 bath) with actual rent $1,592.80 (projected $2,000)
- Financial info: Total gross income reported at $333,637; Gross operating income listed as $333; Net operating income reported at $219,952; Total annual expenses reported at $113,685; Cap rate: 6%; Gross rent multiplier: 10.74; Vacancy rate: 3%; Income reporting type: Actual
- HOA & community: 21 total units in the complex
Exterior
- Parking: Gated garage; Total of 25 parking spaces
- Security: Gated parking
- Utilities: No water, sewer, or power provider details provided
- Home design: Residential income property; Attached building; Two-level (2 stories)
- Construction: No year-built or material details provided; No roof or foundation details provided
- Exterior features: City view; No other exterior structures listed
Interior
- Kitchen: No kitchen appliance details provided
- Bedrooms: One-bedroom units (some units are 1-bedroom; unit counts listed below)
- Flooring: No flooring details provided
- Bathrooms: One-bath units
- Heating & cooling: Wall gas heating; Ceiling fans for cooling/ventilation
- Interior features: Ceiling fan(s); Wall gas heat
- Laundry & utility: No laundry or utility appliances listed
Neighborhood map
What this means for you Summary
Snapshot
- This is a 14×8bd/21.0ba + 7×?bd/?ba units multifamily listed at $3.69M.
Deal economics
- At list price, monthly cash flow is $23k ($282k/yr) — positive. Per door: $1k/mo.
- The deal already cash-flows at list — no discount required.
- Meets the 1% rule at list price ($62k rent vs $3.69M).
- Recommended offer: $3.58M (3.0% below list) — sets the bar for market timing.
- Cap rate 13.9% vs local median 2.1% in Los Angeles — top-decile yield for the area; either an underpriced asset or a hidden risk that comps aren't pricing in. Stress-test before assuming the spread holds.
Location & tenants
- Location reads 68/100 on livability (#273 in CA) — a middle-class / working-renter tenant base. Strengths: amenities A+, commute A+, employment B; Watch: health & safety C-, schools D+, crime F.
- Los Angeles Unified (urban): math 29% / reading 54% proficiency, ranked #223 of 517 in CA (top 43%) — families likely to look elsewhere, expect single-tenant / working-renter base with shorter leases; 67% free/reduced lunch — lower-income household profile, screen leases tightly.
- Market conditions: Rents rising (+1.7%/yr); 99 active listings in the ZIP; 19,697 units permitted in Los Angeles County in 2024 (9,426 in 5+ unit buildings).
- At $62,032/mo this rent would consume 1292% of the median local household income ($58k/yr) (locally 4200% of renters already pay >50% of income on rent) — very limited rent-growth headroom before tenants either downsize or default.
Forward outlook
- Local home prices are declining (-3.0%/yr); year-one equity from $26k of loan paydown is wiped out by about $111k of value loss. Plan a longer hold.
- Los Angeles County population projected at +9% by 2050 — modest demand growth; plan on rents tracking national, not racing it.
- At projected returns (-3.0% appreciation + 1.7% rent growth), your $1.03M cash investment doubles in ~5 years — after that, you're playing with house money.
Negotiation context
- It's been on market 31 days — a 3% lower offer ($3.58M) is reasonable based on typical stale-listing flexibility.
- 4 sale attempts since 10y ago with the ask held roughly flat each time — persistent listings suggest the price (not the market) is what's stuck; bring a comps-based counter.
- Current owner paid $2.98M; 24% above their basis — modest negotiation headroom, anchor on the comps not their cost.
Risks & watch-outs
- Watch-outs: built in 1924 — expect roof / HVAC / electrical / plumbing capex.
Questions for the listing agent
- It's been on market 31 days. Have you received any prior offers? Is the seller open to a 3% concession, seller financing, or rate buy-down credit?
- Can we see the unit-by-unit rent roll, current vacancy, and any below-market leases? What's the average tenancy length?
- What capital expenditures (roof, boiler, parking lot, exteriors) have been made in the last 5 years, and what's planned in the next 2?
- Built in 1924 — when were the roof, HVAC, electrical panel, plumbing, and water heater last replaced?
- Is there a deadline driving the sale (1031 exchange, divorce, estate, relocation)? That informs how much negotiation room exists.
- Schools are D-rated, which usually means shorter tenancies and higher turnover. Who's the typical renter profile here, and what's been the actual vacancy rate?
- Crime grade is F in this area — have there been break-ins, vandalism, or insurance claims at this property in the last 3 years? What carrier currently insures it and at what premium?
- What's the average days-on-market for RENTAL listings here right now (not sales)? A rising rental-DOM trend means longer vacancies and softer asking-rent achievability than the comps imply.
- What's the recent tenant-quality profile in this submarket — average credit score on applications, eviction rate, late-payment / NSF rate, and stable-employment percentage? A property-management company in the area should have these aggregated.
- How much new apartment / multifamily construction is in the pipeline within 1–3 miles? Heavy new supply (>2% of stock underway) typically softens rents 12–24 months out; light construction supports rent growth.
Investment metrics
- 1% rule
- 1.68% ✓
- Cap rate
- 13.92%
- Cash-on-cash
- 27.22%
- DSCR
- 2.21
- GRM
- 5.0
CMA / ARV
No comps found within radius.
Projected returns pro-forma
-3.0% appreciation · 1.69% rent growth · sell at horizon
- IRR
- 19.7%
- Equity multiple
- 1.79×
- Total profit
- $816,287
- Equity at exit
- $550,937
- IRR
- 27.1%
- Equity multiple
- 3.24×
- Total profit
- $2,316,840
- Equity at exit
- $319,476
Cash invested: $1,034,600 (down + closing). Projections, not guarantees.
Landlord ↔ Tenant lean methodology
- Overall (CITY)
- 0 Strongly Tenant-Friendly
- State California
- 18 Strongly Tenant-Friendly · D+13
- County
- — inherits STATE
- City Los Angeles
- 0 Strongly Tenant-Friendly · D+22
ZIP-level market 90037
- Rents YoY
- 1.7%
- Active inventory
- 99
- Price-to-rent
- 92.2×
Monthly cashflow live
- Estimated rent
- $62,032 medium interval (Pro) →
- Mortgage (P&I)
- −$19,377
- Tax est. 1.5%
- −$4,619 /mo · $55,425/yr
- Insurance
- −$1,540
- HOA
- −$0
- Vacancy / Maint / Mgmt
- −$13,027
- Net cashflow
- $23,470
Break-even live
Sensitivity live
| Price | -10% $26,023 | -5% $24,747 | +0% $23,470 | +5% $22,193 | +10% $20,916 |
|---|---|---|---|---|---|
| Rent | -10% $18,569 | -5% $21,020 | +0% $23,470 | +5% $25,920 | +10% $28,370 |
| Rate | -1.0pp $25,331 | -0.5pp $24,410 | base $23,470 | +0.5pp $22,512 | +1.0pp $21,538 |
21-unit breakdown (identical units grouped — click to expand)
| Units | Beds | Baths | Est. rent |
|---|---|---|---|
| 14× units | 8 | 21 | $46,732 |
| #1 | 8 | 21 | $3,338 |
| #2 | 8 | 21 | $3,338 |
| #3 | 8 | 21 | $3,338 |
| #4 | 8 | 21 | $3,338 |
| #5 | 8 | 21 | $3,338 |
| #6 | 8 | 21 | $3,338 |
| #7 | 8 | 21 | $3,338 |
| #8 | 8 | 21 | $3,338 |
| #9 | 8 | 21 | $3,338 |
| #10 | 8 | 21 | $3,338 |
| #11 | 8 | 21 | $3,338 |
| #12 | 8 | 21 | $3,338 |
| #13 | 8 | 21 | $3,338 |
| #14 | 8 | 21 | $3,338 |
| 7× units | 0 | 0 | $15,295 |
| #15 | 0 | 0 | $2,185 |
| #16 | 0 | 0 | $2,185 |
| #17 | 0 | 0 | $2,185 |
| #18 | 0 | 0 | $2,185 |
| #19 | 0 | 0 | $2,185 |
| #20 | 0 | 0 | $2,185 |
| #21 | 0 | 0 | $2,185 |
| Total (21 units) | $62,032 | ||
UW: 25.0% down · 7.5% · 30yr · 1.5% tax · 5.0% vac · 8.0% maint · 8.0% mgmt
Financing live
Cash to close
- Down payment
- $923,750
- Closing costs
- $110,850
- Reserves months
- —
- Total cash needed
- —
Loan-product check · same deal, 3 products live
Conventional
25% down · 7.5% · 30yr
- Down + closing
- —
- Monthly P&I
- —
- Monthly cashflow
- —
- DSCR
- —
- Eligible?
- —
Personal DTI + credit; lowest rate.
DSCR
20% down · 8.5% · 30yr
- Down + closing
- —
- Monthly P&I
- —
- Monthly cashflow
- —
- DSCR
- —
- Eligible?
- —
No personal income docs; deal must DSCR.
Hard money
10% down · 12.0% · 12mo
- Down + closing
- —
- Monthly P&I
- —
- Monthly cashflow
- —
- DSCR
- —
- Eligible?
- —
Short-term bridge; refi at stabilization.
Listing history 21 events
-
2026-06-18days on market $3,695,000 Active 31 DOM
-
2026-06-17days on market $3,695,000 Active 30 DOM
-
2026-06-16days on market $3,695,000 Active 29 DOM
-
2026-06-15days on market $3,695,000 Active 28 DOM
-
2026-06-13days on market $3,695,000 Active 26 DOM
-
2026-06-09days on market $3,695,000 Active 22 DOM
-
2026-06-08days on market $3,695,000 Active 21 DOM
-
2026-06-07days on market $3,695,000 Active 20 DOM
-
2026-06-04days on market $3,695,000 Active 17 DOM
-
2026-06-03days on market $3,695,000 Active 16 DOM
-
2026-06-02days on market $3,695,000 Active 15 DOM
-
2026-06-01days on market $3,695,000 Active 14 DOM
-
2026-05-31days on market $3,695,000 Active 13 DOM
-
2026-05-18$3,695,000 Active
-
2017-01-20soldstatus $2,975,000 Closed 721-char remark
Show marketing remark (514 chars)
BACK ON THE MARKET AGAIN. GREAT INCOME!!!! THIS PROPERTY IS A RETROFITTED BRICK BUILDING COMPOSED OF RESIDENTIAL AND RETAIL UNITS NEAR USC, LA COLISEUM AND SCIENCE MUSIUM. THE PROPERTY IS LOCATED ON 5151 S. VERMONT(5002-030-017 /BUILDING:12,972SQ/FT) & 5161 S. VERMONT(5002-030-018 / BUILDING: 5,984SQ/FT)17,282 SQ/FT. LOT WITH 6 RETAILS, 6 1-BED AND 8 SINGLES PLUS 28 PARKING SPACES LOCATED IN THE BACK OF THE BUILDING. #14: SINGLE / $950..... 6 RETAIL SHOPS: $9,610 / MONTH. EVERY UNIT IS INDIVIDUALLY METERD
-
2017-01-20soldstatus $2,975,000 514-char remark
Show marketing remark (514 chars)
BACK ON THE MARKET AGAIN. GREAT INCOME!!!! THIS PROPERTY IS A RETROFITTED BRICK BUILDING COMPOSED OF RESIDENTIAL AND RETAIL UNITS NEAR USC, LA COLISEUM AND SCIENCE MUSIUM. THE PROPERTY IS LOCATED ON 5151 S. VERMONT(5002-030-017 /BUILDING:12,972SQ/FT) & 5161 S. VERMONT(5002-030-018 / BUILDING: 5,984SQ/FT)17,282 SQ/FT. LOT WITH 6 RETAILS, 6 1-BED AND 8 SINGLES PLUS 28 PARKING SPACES LOCATED IN THE BACK OF THE BUILDING. #14: SINGLE / $950..... 6 RETAIL SHOPS: $9,610 / MONTH. EVERY UNIT IS INDIVIDUALLY METERD
-
2016-12-02status Backup Offers Accepted 721-char remark
Show marketing remark (721 chars)
BACK ON THE MARKET AGAIN. GREAT INCOME!!!! THIS PROPERTY IS A RETROFITTED BRICK BUILDING COMPOSED OF RESIDENTIAL AND RETAIL UNITS NEAR USC, LA COLISEUM AND SCIENCE MUSIUM. THE PROPERTY IS LOCATED ON 5151 S. VERMONT(5002-030-017 /BUILDING:12,972SQ/FT) & 5161 S. VERMONT(5002-030-018 / BUILDING: 5,984SQ/FT)17,282 SQ/FT. LOT WITH 6 RETAILS, 6 1-BED AND 8 SINGLES PLUS 28 PARKING SPACES LOCATED IN THE BACK OF THE BUILDING. #14: SINGLE / $950.. .. . 6 RETAIL SHOPS: $9,610 / MONTH. EVERY UNIT IS INDIVIDUALLY METERD FOR GAS AND ELECTRIC. .. .PROPERTY SHALL BE SOLD IN "AS-IS" CONDITION. .. PLEASE DO NOT DISTURB THE TENANTS, ,, ,, , DRIVE BY ONLY. .. .. ."SUBJECT TO INSPECTION UPON ACCEPTED OFFER"
-
2016-09-07status Active 721-char remark
Show marketing remark (721 chars)
BACK ON THE MARKET AGAIN. GREAT INCOME!!!! THIS PROPERTY IS A RETROFITTED BRICK BUILDING COMPOSED OF RESIDENTIAL AND RETAIL UNITS NEAR USC, LA COLISEUM AND SCIENCE MUSIUM. THE PROPERTY IS LOCATED ON 5151 S. VERMONT(5002-030-017 /BUILDING:12,972SQ/FT) & 5161 S. VERMONT(5002-030-018 / BUILDING: 5,984SQ/FT)17,282 SQ/FT. LOT WITH 6 RETAILS, 6 1-BED AND 8 SINGLES PLUS 28 PARKING SPACES LOCATED IN THE BACK OF THE BUILDING. #14: SINGLE / $950.. .. . 6 RETAIL SHOPS: $9,610 / MONTH. EVERY UNIT IS INDIVIDUALLY METERD FOR GAS AND ELECTRIC. .. .PROPERTY SHALL BE SOLD IN "AS-IS" CONDITION. .. PLEASE DO NOT DISTURB THE TENANTS, ,, ,, , DRIVE BY ONLY. .. .. ."SUBJECT TO INSPECTION UPON ACCEPTED OFFER"
-
2016-08-30status Pending 721-char remark
Show marketing remark (721 chars)
BACK ON THE MARKET AGAIN. GREAT INCOME!!!! THIS PROPERTY IS A RETROFITTED BRICK BUILDING COMPOSED OF RESIDENTIAL AND RETAIL UNITS NEAR USC, LA COLISEUM AND SCIENCE MUSIUM. THE PROPERTY IS LOCATED ON 5151 S. VERMONT(5002-030-017 /BUILDING:12,972SQ/FT) & 5161 S. VERMONT(5002-030-018 / BUILDING: 5,984SQ/FT)17,282 SQ/FT. LOT WITH 6 RETAILS, 6 1-BED AND 8 SINGLES PLUS 28 PARKING SPACES LOCATED IN THE BACK OF THE BUILDING. #14: SINGLE / $950.. .. . 6 RETAIL SHOPS: $9,610 / MONTH. EVERY UNIT IS INDIVIDUALLY METERD FOR GAS AND ELECTRIC. .. .PROPERTY SHALL BE SOLD IN "AS-IS" CONDITION. .. PLEASE DO NOT DISTURB THE TENANTS, ,, ,, , DRIVE BY ONLY. .. .. ."SUBJECT TO INSPECTION UPON ACCEPTED OFFER"
-
2016-07-22$3,000,000 Active 721-char remark
Show marketing remark (514 chars)
BACK ON THE MARKET AGAIN. GREAT INCOME!!!! THIS PROPERTY IS A RETROFITTED BRICK BUILDING COMPOSED OF RESIDENTIAL AND RETAIL UNITS NEAR USC, LA COLISEUM AND SCIENCE MUSIUM. THE PROPERTY IS LOCATED ON 5151 S. VERMONT(5002-030-017 /BUILDING:12,972SQ/FT) & 5161 S. VERMONT(5002-030-018 / BUILDING: 5,984SQ/FT)17,282 SQ/FT. LOT WITH 6 RETAILS, 6 1-BED AND 8 SINGLES PLUS 28 PARKING SPACES LOCATED IN THE BACK OF THE BUILDING. #14: SINGLE / $950..... 6 RETAIL SHOPS: $9,610 / MONTH. EVERY UNIT IS INDIVIDUALLY METERD
-
2016-07-22$3,000,000 514-char remark
Show marketing remark (514 chars)
BACK ON THE MARKET AGAIN. GREAT INCOME!!!! THIS PROPERTY IS A RETROFITTED BRICK BUILDING COMPOSED OF RESIDENTIAL AND RETAIL UNITS NEAR USC, LA COLISEUM AND SCIENCE MUSIUM. THE PROPERTY IS LOCATED ON 5151 S. VERMONT(5002-030-017 /BUILDING:12,972SQ/FT) & 5161 S. VERMONT(5002-030-018 / BUILDING: 5,984SQ/FT)17,282 SQ/FT. LOT WITH 6 RETAILS, 6 1-BED AND 8 SINGLES PLUS 28 PARKING SPACES LOCATED IN THE BACK OF THE BUILDING. #14: SINGLE / $950..... 6 RETAIL SHOPS: $9,610 / MONTH. EVERY UNIT IS INDIVIDUALLY METERD
ⓘ Source: listings_history table (triggers on properties + properties_extension) + one-shot
backfill from property_details.listing_events for pre-trigger history.
Nearby sold comps map
Loading sold comps map…
Walkable amenities ~0.75 mi
Loading nearby amenities…
Taxation est. · year 1
- Rental income
- $744,384
- − Mortgage interest
- −$206,977
- − Property taxes
- −$55,425
- − Insurance
- −$18,475
- − Repairs & maintenance
- −$59,551
- − Management
- −$59,551
- − Depreciation
- −$107,491
- Taxable income
- $236,914
- Est. tax owed @ 24.0%
- −$56,859
- After-tax cash flow
- $224,780/yr
For passive investors: Depreciation is non-cash, so a rental often shows a tax loss while cash-flowing — sheltering income. Rental losses are passive: they offset passive income freely, and up to $25,000/yr can offset ordinary (W-2) income if you actively participate and your MAGI is under $100k (phasing out to $0 by $150k); unused losses carry forward. On sale, claimed depreciation is recaptured at up to 25%, and gains may owe capital-gains tax (a 1031 exchange can defer both). Figures are a year-1 estimate at your 24.0% rate — not tax advice; consult a CPA.
Schools (NCES district)
- District
- Los Angeles Unified
- NCES district ID
- 0622710
- Math proficiency
- 29% ▼ -4.00%
- Reading proficiency
- 54% ▲ 10.00%
- Median HH income
- $50,403
- Composite
- 35.67/100
- National rank
- #4875
- State rank
- #223 of 517 in CA
Livability — Los Angeles
- Score
- 68/100
- State rank
- #273
- US rank
- #9237
Category grades
Schools grade is shown separately in the Schools card above.
Census & demographics
- Census place
- Los Angeles, CA
- County
- Los Angeles County · 9,444,647 people
- City population
- 3,838,149
- Metro
- Los Angeles-Long Beach-Anaheim, CA
- Population (ZIP)
- 65,482
- Household income
- $57,622
- Rent vs Own
- Severe rent burden
- 4200.0
Population outlook (Los Angeles County) Hauer SSP2
- Today (2025)
- 10,940,515 people
- By 2030
- 11,256,481 · +2.9%
- By 2040
- 11,729,929 · +7.2%
- By 2050
- 11,948,407 · +9.2%
- By 2075
- 11,818,114 · +8.0%
- By 2100
- 10,842,928 · -0.9%
Race, ethnicity, and origin ACS 2023
- Neighborhood character
- Predominantly Hispanic (80%)
- Race & ethnicity
- Hispanic / Latino 80% Two or more races 15% Black 15% Native American 3% White 2% Asian 1%
- Hispanic origin (detail)
- Mexican 43%
- Common ancestry
- British 1%
- Foreign-born
- 44% · Canada, South Korea
- Languages at home
- 23% English-only · Spanish 74% Korean 1% French/Haitian/Cajun 1%
Political lean MEDSL · Los Angeles
- 2024 margin
- Solid D (+32.9) · D 64.8% · R 31.9% · Other 3.3%
- 2008→2024 swing
- -7.4pp toward R · 2008: 40.4pp · 2024: 32.9pp
- All cycles
- 2024: D+32.9 2020: D+44.2 2016: D+48.0 2012: D+40.0 2008: D+40.4
Not yet ingested
- Civics
- —
Market trends
- HPI YoY
- ▼ -639.09%
- Current HPI
- 467.0371
- Rent YoY
- ▲ 1.69%
- Metro
- Los Angeles-Long Beach-Anaheim, CA
- State GDP YoY
- ▲ 3.21%
- F500 in state
- 116
Industry mix (Fortune 500 HQ in CA)
| Industry | F500 HQs | Revenue |
|---|---|---|
| Technology | 27 | $1,492B |
|
||
| Financial Services | 3 | $174B |
|
||
| Retail | 3 | $44B |
|
||
| Insurance | 3 | $26B |
|
||
| Media / Entertainment | 2 | $115B |
|
||
| Pharmaceuticals / Biotech | 2 | $62B |
|
||
Price history
+23.2% since first listed8 events — show timeline
- 2026-05-18 Listed $3,695,000 TheMLS
- 2017-01-20 Sold (MLS) $2,975,000 SDMLS
- 2017-01-20 Sold (MLS) $2,975,000 TheMLS
- 2016-12-02 Pending — TheMLS
- 2016-09-07 Relisted — TheMLS
- 2016-08-30 Pending — TheMLS
- 2016-07-22 Listed $3,000,000 TheMLS
- 2016-07-22 Listed $3,000,000 SDMLS
Cash-flow waterfall
monthlySold comps — $/sqft
last 12 mo · ≤1 miLoading sold comps…