1361 Hearthstone Ct Unit 12-H · McCall, ID
Flood risk 1/10 · Minimal
- FEMA flood zone
- X (unshaded)
- Chance of flooding over 30 yrs
- 0.0%
- Est. flood insurance / yr
- $507 – $1,088
Fire risk 7/10 · Major
- Est. fire insurance / yr
- $584 – $1,086
Heat risk 2/10 · Minimal
- Hot days now (above 87°F)
- 6 days/yr
- Hot days in 30 yrs
- 14 days/yr
Wind risk 1/10 · Minimal
- Chance of severe wind over 30 yrs
- —
Air-quality risk 7/10 · Major
- Unhealthy air days now
- 12 days/yr
- Unhealthy air days in 30 yrs
- 13 days/yr
Risk factors via First Street. Map © Google.
Why this score? — see what drove the B grade
The composite is a weighted blend of 9 inputs, each scored 0–100. Each bar is that input's sub-score; the figure is the points it added to the 100-point composite (weight × sub-score).
- Cash flow +30.0/30.0
- 1% rule +10.0/10.0
- DSCR +10.0/10.0
- ARV discount +7.5/15.0
- Schools +5.7/10.0
- Livability +3.6/5.0
- Rent growth +2.5/5.0
- Condition / age +2.5/5.0
- Appreciation +0.0/10.0
$65,000
🖨 Deal sheet 📄 Offer letter ✓ Due diligence
Listing remarks
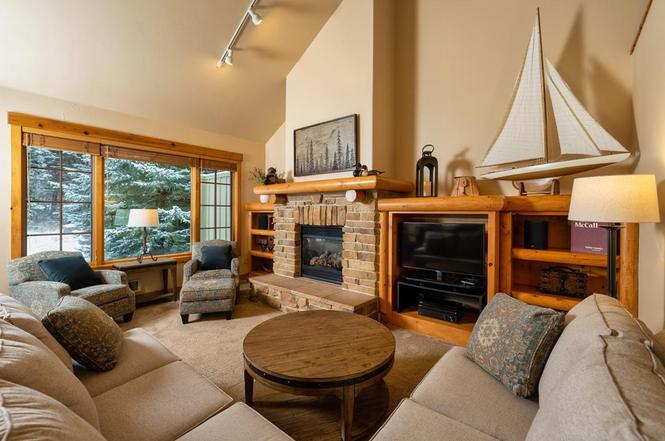
1/8th interest in a Hassle-free ownership with all amenities. Current reservations include:Two Homes April 3rd - April 10th, May 28th - June 4th, July 24th - July 31st, and 10/15-10/22. Buyer may cancel and rebook any of these dates based on availability. Each owner receives at least 6 weeks of planned time each year in a fully appointed home. Access to all Spring Mountain Ranch amenities including seasonal pool, outdoor hot tub, steam room , gym, pickleball courts, and massage facilities. Owner services, maintenance, and housekeeping staff available 7 days a week to meet your every need.
Key facts
- Pickleball courts
- Outdoor hot tub
- Steam room
Tags
Property features AI
Finance
- Other: Subdivision: Hearthstone Townhouse; Directions: Adjacent to the SMR Ranch House. SMR Blvd to Hearthstone Ct. Take a left and stop at Owner Services (first building on the left).
- HOA & community: Homeowners association; Community golf
Exterior
- Parking: One total parking space; One covered parking space; One-car garage; Shared driveway; Open parking available
- Utilities: Public water; Public sewer; Electric service on property; 220 volt electric; Underground electric
- Home design: Residential timeshare; Updated/remodeled condition; Two levels (2 stories)
- Construction: Frame construction with wood siding; Concrete perimeter foundation
- Exterior features: On golf course; Near golf course; Sloped lot; Wooded; Paved road; Has view; Composition roof
Interior
- Kitchen: Range; Oven; Dishwasher; Disposal; Microwave; Refrigerator; Freezer
- Bathrooms: Three full bathrooms
- Heating & cooling: Baseboard heating
- Interior features: Vaulted ceilings; Window treatments; Propane fireplace; Basement
- Laundry & utility: Washer; Dryer
Neighborhood map
What this means for you Summary
Snapshot
- This is a 3-bed/3.0-bath single-family listed at $65k.
Deal economics
- At list price, monthly cash flow is $631 ($8k/yr) — positive.
- The deal already cash-flows at list — no discount required.
- Meets the 1% rule at list price ($1k rent vs $65k).
- Recommended offer: $57k (12.0% below list) — sets the bar for market timing.
Location & tenants
- Location reads 72/100 on livability (#49 in ID) — a middle-class / working-renter tenant base. Strengths: schools A, health & safety A, housing B; Watch: amenities F, commute F.
- Mccall-Donnelly Joint School District (rural): math 59% / reading 74% proficiency, ranked #8 of 92 in ID (top 9%) — acceptable for families but not a draw, mixed tenant base, ~2y average lease.
- Market conditions: 519 active listings in the ZIP; 250 units permitted in Valley County in 2024 (0 in 5+ unit buildings).
Forward outlook
- Local home prices are declining (-3.0%/yr); year-one equity from $449 of loan paydown is wiped out by about $2k of value loss. Plan a longer hold.
- Valley County population projected at +7% by 2050 — modest demand growth; plan on rents tracking national, not racing it.
- At projected returns (-3.0% appreciation + 3.0% rent growth), your $18k cash investment doubles in ~3 years — after that, you're playing with house money.
Negotiation context
- It's been on market 193 days — a 12% lower offer ($57k) is reasonable based on typical stale-listing flexibility.
- 4 sale attempts since 9y ago with the ask held roughly flat each time — persistent listings suggest the price (not the market) is what's stuck; bring a comps-based counter.
Risks & watch-outs
- Climate carrying-cost: major wildfire risk — expect insurance premiums to compound above CPI over the hold.
Questions for the listing agent
- It's been on market 193 days. Have you received any prior offers? Is the seller open to a 12% concession, seller financing, or rate buy-down credit?
- Why hasn't it sold? Are there any deal-killer items the seller is aware of (foundation, flood, title, zoning, code violations)?
- Is there a deadline driving the sale (1031 exchange, divorce, estate, relocation)? That informs how much negotiation room exists.
- Schools are A-rated — typically a magnet for longer-tenancy family renters. What's the average tenant stay here, and is there a school-zone premium baked into asking?
- What's the average days-on-market for RENTAL listings here right now (not sales)? A rising rental-DOM trend means longer vacancies and softer asking-rent achievability than the comps imply.
- What's the recent tenant-quality profile in this submarket — average credit score on applications, eviction rate, late-payment / NSF rate, and stable-employment percentage? A property-management company in the area should have these aggregated.
- How much new for-sale + rental construction is in the pipeline within 1–3 miles? Heavy new supply typically softens prices + rents 12–24 months out; constrained supply supports both.
Investment metrics
- 1% rule
- 2.10% ✓
- Cap rate
- 17.94%
- Cash-on-cash
- 41.59%
- DSCR
- 2.85
- GRM
- 4.0
CMA / ARV
- ARV (on-the-fly)
- $906,000
- Comps found
- 12
Show comp detail 12 sales within ~0.75 mi
| Address | Dist | Beds/Ba | Sqft | Sold | Price | $/sf | Match |
|---|---|---|---|---|---|---|---|
| 1389 Hearthstone Ct Unit 17-H | 0.03mi | 3/3.0 | 2,000 (0%) | 6mo | $68,500 | $34 | 94 |
| 133 Brundage View Ct | 0.40mi | 3/3.0 | 1,998 (-0%) | 1mo | $875,000 | $438 | 80 |
| 917 Camas | 0.21mi | 4/3.0 (+1) | 2,167 (+8%) | 1mo | $989,000 | $456 | 71 |
| 1381 Hearthstone Ct Unit 16-B | 0.03mi | 3/3.0 | 2,300 (+15%) | 4mo | $68,500 | $30 | 70 |
| 1013 Penstemen Pl | 0.18mi | 3/3.0 | 1,714 (-14%) | 7mo | $1,095,000 | $639 | 62 |
| 1034 Fireweed | 0.27mi | 3/3.0 | 1,706 (-15%) | 2mo | $850,000 | $498 | 61 |
| 910 Camas Pl | 0.27mi | 2/2.5 (-1) | 1,812 (-9%) | 4mo | $909,000 | $502 | 61 |
| 1685 Ginney Way | 0.62mi | 3/2.0 | 1,952 (-2%) | 7mo | $884,900 | $453 | 57 |
| 1414 Dawson | 0.62mi | 3/3.0 | 1,818 (-9%) | 0mo | $849,900 | $467 | 56 |
| 1484 Dragonfly Loop | 0.70mi | 3/2.5 | 2,082 (+4%) | 6mo | $749,900 | $360 | 54 |
| 1409 Dragonfly Loop | 0.59mi | 3/2.0 | 1,855 (-7%) | 3mo | $759,000 | $409 | 54 |
| 1105 Graham Dr | 0.71mi | 3/2.0 | 1,954 (-2%) | 7mo | $869,900 | $445 | 53 |
Match score weights: distance 35% · size 25% · config 20% · recency 20%. Top-matched comps best support the ARV.
Projected returns pro-forma
-3.0% appreciation · 3.0% rent growth · sell at horizon
- IRR
- 38.2%
- Equity multiple
- 2.63×
- Total profit
- $29,662
- Equity at exit
- $9,692
- IRR
- 44.7%
- Equity multiple
- 5.27×
- Total profit
- $77,644
- Equity at exit
- $5,620
Cash invested: $18,200 (down + closing). Projections, not guarantees.
Landlord ↔ Tenant lean methodology
- Overall (STATE)
- 91 Strongly Landlord-Friendly
- State Idaho
- 91 Strongly Landlord-Friendly · R+18
- County
- — inherits STATE
- City
- — inherits STATE
ZIP-level market 83638
- Active inventory
- 519
- Price-to-rent
- 4.0×
Monthly cashflow live
- Estimated rent
- $1,367 medium interval (Pro) →
- Mortgage (P&I)
- −$341
- Tax est. 1.5%
- −$81 /mo · $975/yr
- Insurance
- −$27
- HOA
- −$0
- Vacancy / Maint / Mgmt
- −$287
- Net cashflow
- $631
Break-even live
UW: 25.0% down · 7.5% · 30yr · 1.5% tax · 5.0% vac · 8.0% maint · 8.0% mgmt
Financing live
Cash to close
- Down payment
- $16,250
- Closing costs
- $1,950
- Reserves months
- —
- Total cash needed
- —
Loan-product check · same deal, 3 products live
Conventional
25% down · 7.5% · 30yr
- Down + closing
- —
- Monthly P&I
- —
- Monthly cashflow
- —
- DSCR
- —
- Eligible?
- —
Personal DTI + credit; lowest rate.
DSCR
20% down · 8.5% · 30yr
- Down + closing
- —
- Monthly P&I
- —
- Monthly cashflow
- —
- DSCR
- —
- Eligible?
- —
No personal income docs; deal must DSCR.
Hard money
10% down · 12.0% · 12mo
- Down + closing
- —
- Monthly P&I
- —
- Monthly cashflow
- —
- DSCR
- —
- Eligible?
- —
Short-term bridge; refi at stabilization.
Listing history 19 events
-
2026-06-17status $65,000 Pending 193 DOM
-
2026-06-16days on market $65,000 Active 193 DOM
-
2026-06-15days on market $65,000 Active 192 DOM
-
2026-06-14days on market $65,000 Active 190 DOM
-
2026-06-12days on market $65,000 Active 189 DOM
-
2026-06-09days on market $65,000 Active 186 DOM
-
2026-06-08days on market $65,000 Active 185 DOM
-
2026-06-07days on market $65,000 Active 184 DOM
-
2026-06-04days on market $65,000 Active 180 DOM
-
2026-06-03days on market $65,000 Active 179 DOM
-
2026-05-31days on market $65,000 Active 178 DOM
-
2026-05-31days on market $65,000 Active 177 DOM
-
2026-02-12price $65,000
-
2026-02-11$65,000 Active
-
2025-12-04$68,500 Active
-
2017-05-11soldstatus
-
2017-05-11soldstatus
-
2017-01-12$18,500
-
2017-01-12$18,500
ⓘ Source: listings_history table (triggers on properties + properties_extension) + one-shot
backfill from property_details.listing_events for pre-trigger history.
Climate risk First Street
- Flood 1/10 Low FEMA zone X (unshaded) · 0% chance over 30 yrs
- Wildfire 7/10 Severe
- Heat 2/10 Low 6 d/yr ≥87°F today · 14 d/yr by 30 yrs out
- Wind 1/10 Low
- Air quality 7/10 Severe 12 unhealthy d/yr today · 13 by 30 yrs out
Nearby sold comps map
Loading sold comps map…
Walkable amenities ~0.75 mi
Loading nearby amenities…
Taxation est. · year 1
- Rental income
- $16,405
- − Mortgage interest
- −$3,641
- − Property taxes
- −$975
- − Insurance
- −$325
- − Repairs & maintenance
- −$1,312
- − Management
- −$1,312
- − Depreciation
- −$1,891
- Taxable income
- $6,948
- Est. tax owed @ 24.0%
- −$1,668
- After-tax cash flow
- $5,902/yr
For passive investors: Depreciation is non-cash, so a rental often shows a tax loss while cash-flowing — sheltering income. Rental losses are passive: they offset passive income freely, and up to $25,000/yr can offset ordinary (W-2) income if you actively participate and your MAGI is under $100k (phasing out to $0 by $150k); unused losses carry forward. On sale, claimed depreciation is recaptured at up to 25%, and gains may owe capital-gains tax (a 1031 exchange can defer both). Figures are a year-1 estimate at your 24.0% rate — not tax advice; consult a CPA.
Schools (NCES district)
- District
- Mccall-Donnelly Joint School District
- NCES district ID
- 1602030
- Math proficiency
- 59% ▼ -1.00%
- Reading proficiency
- 74% ▼ -5.00%
- Median HH income
- $52,333
- Composite
- 56.63/100
- National rank
- #1137
- State rank
- #8 of 92 in ID
Livability — McCall
- Score
- 72/100
- State rank
- #49
- US rank
- #6315
Category grades
Schools grade is shown separately in the Schools card above.
Census & demographics
- Census place
- McCall, ID
- Population (ZIP)
- 7,507
Population outlook (Valley County) Hauer SSP2
- Today (2025)
- 10,964 people
- By 2030
- 11,279 · +2.9%
- By 2040
- 11,584 · +5.7%
- By 2050
- 11,754 · +7.2%
- By 2075
- 12,246 · +11.7%
- By 2100
- 11,948 · +9.0%
Race, ethnicity, and origin ACS 2023
- Neighborhood character
- Predominantly White (93%)
- Race & ethnicity
- White 93% Hispanic / Latino 6% Two or more races 3%
- Hispanic origin (detail)
- Mexican 1% Puerto Rican 4%
- Common ancestry
- Lithuanian 5% Italian 3% Romanian 2%
- Foreign-born
- 0%
- Languages at home
- 99% English-only · Spanish 1%
Political lean MEDSL · Valley
- 2024 margin
- R (+18.6) · D 39.6% · R 58.2% · Other 2.2%
- 2008→2024 swing
- -11.6pp toward R · 2008: -6.9pp · 2024: -18.6pp
- All cycles
- 2024: R+18.6 2020: R+13.7 2016: R+18.6 2012: R+11.6 2008: R+6.9
Not yet ingested
- Civics
- —
Market trends
- HPI YoY
- ▼ -242.11%
- Current HPI
- 301.1886
- Rent YoY
- —
- Metro
- —
- State GDP YoY
- ▲ 4.51%
- F500 in state
- 6
Industry mix (Fortune 500 HQ in ID)
| Industry | F500 HQs | Revenue |
|---|---|---|
| Retail | 1 | $79B |
|
||
| Technology | 1 | $25B |
|
||
| Food / Agriculture | 1 | $6B |
|
||
Price history
+251.4% since first listed7 events — show timeline
- 2026-02-12 Price Changed $65,000 MCAOR
- 2026-02-11 Listed $65,000 IMLS
- 2025-12-04 Listed $68,500 MCAOR
- 2017-05-11 Sold (MLS) — MCAOR
- 2017-05-11 Sold (MLS) — IMLS
- 2017-01-12 Listed $18,500 MCAOR
- 2017-01-12 Listed $18,500 IMLS
Cash-flow waterfall
monthlySold comps — $/sqft
last 12 mo · ≤1 miLoading sold comps…