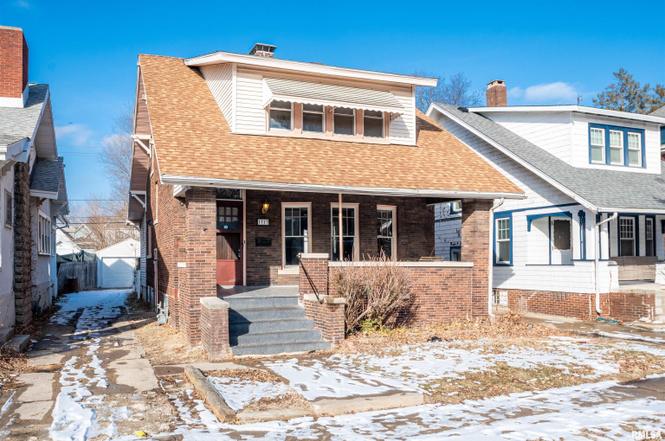
1713 W Barker Ave · Peoria, IL
Flood risk 3/10 · Minor
- FEMA flood zone
- X
- Chance of flooding over 30 yrs
- 0.2%
- Est. flood insurance / yr
- $473 – $860
Fire risk 1/10 · Minimal
- Est. fire insurance / yr
- $804 – $1,492
Heat risk 3/10 · Minor
- Hot days now (above 105°F)
- 7 days/yr
- Hot days in 30 yrs
- 18 days/yr
Wind risk 2/10 · Minimal
- Chance of severe wind over 30 yrs
- 1.0%
Air-quality risk 3/10 · Minor
- Unhealthy air days now
- 1 days/yr
- Unhealthy air days in 30 yrs
- 3 days/yr
Risk factors via First Street. Map © Google.
Why this score? — see what drove the B grade
The composite is a weighted blend of 9 inputs, each scored 0–100. Each bar is that input's sub-score; the figure is the points it added to the 100-point composite (weight × sub-score).
- Cash flow +30.0/30.0
- ARV discount +15.0/15.0
- 1% rule +10.0/10.0
- DSCR +10.0/10.0
- Livability +3.7/5.0
- Rent growth +2.5/5.0
- Condition / age +2.5/5.0
- Schools +1.1/10.0
- Appreciation +0.0/10.0
$69,000
🖨 Deal sheet 📄 Offer letter ✓ Due diligence
Listing remarks MLS
3 bedroom, 2 bath, 1.5 Story home in historical area. Home features great front porch, original hardwood floors in the living room with built-in's, and great natural lighting, all original woodwork, brick fireplace, formal dining room, den/office space, and all 3 bedrooms on one level. Updates include furnace ('19), water heater ('17). Fenced in backyard with deck, and 1 car detached garage with shared driveway. This property is in an estate and sold "as-is" with no repairs.
Key facts
- Brick bungalow
- Formal dining room
- Classic woodwork
Tags
Property features AI
Exterior
- Parking: Detached 1-car garage; On-street parking available; Shared driveway
- Utilities: Public water; Public sewer
- Home design: Single-family residence; Built in 1916; Two or more levels (basement, main, upper, additional level noted)
- Construction: Shingle roof; Originally constructed in 1916
- Exterior features: Fenced yard; Level lot; Lot dimensions about 36 x 132
Interior
- Kitchen: Kitchen on main level; Dishwasher
- Bedrooms: Three bedrooms (all on upper level); Primary bedroom approximately 15.0 x 12.0 with egress window; Second bedroom approximately 11.1 x 10.1 with egress window; Third bedroom approximately 11.1 x 10.0 with egress window
- Flooring: Hardwood flooring in living areas and bedrooms; Vinyl flooring in kitchen/dining areas
- Bathrooms: Two full bathrooms
- Heating & cooling: Central air conditioning
- Interior features: Dishwasher; Wood-burning fireplace (non-functional); Full, unfinished basement
- Laundry & utility: Basement laundry area
Neighborhood map
What this means for you Summary
Snapshot
- This is a 3-bed/1.0-bath single-family listed at $69k.
Deal economics
- At list price, monthly cash flow is $639 ($8k/yr) — positive.
- The deal already cash-flows at list — no discount required.
- Meets the 1% rule at list price ($2k rent vs $69k).
- Recommended offer: $65k (6.0% below list) — sets the bar for market timing.
- Cap rate 17.4% vs local median 5.6% in Peoria — top-decile yield for the area; either an underpriced asset or a hidden risk that comps aren't pricing in. Stress-test before assuming the spread holds.
Location & tenants
- Location reads 73/100 on livability (#270 in IL) — a middle-class / working-renter tenant base. Strengths: commute A+, cost of living A+, housing A+; Watch: employment D+, crime F.
- Peoria SD 150 (urban): math 11% / reading 14% proficiency, ranked #554 of 620 in IL (top 89%) — low school quality limits family demand, transient renter base, plan for 1-2y turnover; 70% free/reduced lunch — lower-income household profile, screen leases tightly.
- Zoned schools: Manual High School (math 2% / reading 2%, grade F, #659 of 693 statewide, top 100%, 656 students, 0% FRL) — zoned schools average 0% FRL vs 70% district-wide (70 pts lower); this property's tenant base skews higher-income than the district average.
- Market conditions: 33 active listings in the ZIP; 22 comparable units currently listed for rent nearby; rentals leasing fast (median 14d on market — plan ~1-2 weeks tenant-placement turnaround); 41% of comp listings sitting > 30 days — soft ceiling on asking rent; lower-income renter base — watch delinquency; 73 units permitted in Peoria County in 2024 (0 in 5+ unit buildings).
- At $1,586/mo this rent would consume 49% of the median local household income ($39k/yr) (locally 620% of renters already pay >50% of income on rent) — very limited rent-growth headroom before tenants either downsize or default.
Forward outlook
- Local home prices are declining (-3.0%/yr); year-one equity from $477 of loan paydown is wiped out by about $2k of value loss. Plan a longer hold.
- Peoria County population projected at -11% by 2050 — secular population decline; favor cash flow + early exit over multi-decade hold.
- At projected returns (-3.0% appreciation + 3.0% rent growth), your $19k cash investment doubles in ~3 years — after that, you're playing with house money.
Negotiation context
- It's been on market 84 days — a 6% lower offer ($65k) is reasonable based on typical stale-listing flexibility.
- 5 sale attempts since 25y ago; this cycle's ask has dropped $41k (37%) from the opening price — seller is motivated, your offer sets the floor, not the list.
- Current owner paid $43k; list at $69k implies a 60% gain — meaningful room to come down on a strong offer.
Risks & watch-outs
- Watch-outs: property tax is 3.9% of price; built in 1916 — expect roof / HVAC / electrical / plumbing capex.
Questions for the listing agent
- It's been on market 84 days. Have you received any prior offers? Is the seller open to a 6% concession, seller financing, or rate buy-down credit?
- Built in 1916 — when were the roof, HVAC, electrical panel, plumbing, and water heater last replaced?
- Property tax is high relative to price — has the assessment been appealed recently, and will the sale trigger a re-assessment?
- Why hasn't it sold? Are there any deal-killer items the seller is aware of (foundation, flood, title, zoning, code violations)?
- Is there a deadline driving the sale (1031 exchange, divorce, estate, relocation)? That informs how much negotiation room exists.
- Schools are F-rated, which usually means shorter tenancies and higher turnover. Who's the typical renter profile here, and what's been the actual vacancy rate?
- Crime grade is F in this area — have there been break-ins, vandalism, or insurance claims at this property in the last 3 years? What carrier currently insures it and at what premium?
- What's the average days-on-market for RENTAL listings here right now (not sales)? A rising rental-DOM trend means longer vacancies and softer asking-rent achievability than the comps imply.
- What's the recent tenant-quality profile in this submarket — average credit score on applications, eviction rate, late-payment / NSF rate, and stable-employment percentage? A property-management company in the area should have these aggregated.
- How much new for-sale + rental construction is in the pipeline within 1–3 miles? Heavy new supply typically softens prices + rents 12–24 months out; constrained supply supports both.
Investment metrics
- 1% rule
- 2.30% ✓
- Cap rate
- 17.41%
- Cash-on-cash
- 39.70%
- DSCR
- 2.77
- GRM
- 3.6
CMA / ARV
- ARV (on-the-fly)
- $135,036
- Comps found
- 12
Show comp detail 12 sales within ~0.75 mi
| Address | Dist | Beds/Ba | Sqft | Sold | Price | $/sf | Match |
|---|---|---|---|---|---|---|---|
| 1713 W Barker Ave | 0.00mi | 3/2.0 | 1,452 (0%) | 1mo | $75,000 | $52 | 95 |
| 1808 W Fredonia Ave | 0.07mi | 4/1.0 (+1) | 1,340 (-8%) | 8mo | $48,000 | $36 | 72 |
| 2106 W Heading Ave | 0.44mi | 3/2.5 | 1,476 (+2%) | 5mo | $102,000 | $69 | 67 |
| 2026 W Heading Ave | 0.43mi | 3/2.0 | 1,565 (+8%) | 0mo | $137,500 | $88 | 63 |
| 302 N Sterling Ave | 0.65mi | 3/1.0 | 1,422 (-2%) | 5mo | $145,000 | $102 | 62 |
| 2008 W Clarke Ave | 0.26mi | 3/2.0 | 1,284 (-12%) | 3mo | $119,000 | $93 | 62 |
| 2111 W Laura Ave | 0.43mi | 4/2.0 (+1) | 1,477 (+2%) | 8mo | $140,000 | $95 | 61 |
| 2019 W Edna Ct | 0.53mi | 3/2.0 | 1,540 (+6%) | 9mo | $134,000 | $87 | 54 |
| 2208 W Ayres Ave | 0.43mi | 2/1.5 (-1) | 1,297 (-11%) | 4mo | $120,000 | $93 | 52 |
| 2507 W Ardmore Pl | 0.67mi | 3/2.0 | 1,328 (-8%) | 9mo | $149,000 | $112 | 43 |
| 1802 Butler St | 0.75mi | 3/1.0 | 1,611 (+11%) | 7mo | $17,000 | $11 | 41 |
| 609 N Iris Ct | 0.67mi | 2/1.0 (-1) | 1,260 (-13%) | 9mo | $130,000 | $103 | 34 |
Match score weights: distance 35% · size 25% · config 20% · recency 20%. Top-matched comps best support the ARV.
Projected returns pro-forma
-3.0% appreciation · 3.0% rent growth · sell at horizon
- IRR
- 36.1%
- Equity multiple
- 2.53×
- Total profit
- $29,636
- Equity at exit
- $10,288
- IRR
- 42.8%
- Equity multiple
- 5.07×
- Total profit
- $78,666
- Equity at exit
- $5,966
Cash invested: $19,320 (down + closing). Projections, not guarantees.
Landlord ↔ Tenant lean methodology
- Overall (STATE)
- 43 Moderately Tenant-Leaning
- State Illinois
- 43 Moderately Tenant-Leaning · D+7
- County
- — inherits STATE
- City
- — inherits STATE
ZIP-level market 61606
- Home prices YoY
- -34.0%
- Active inventory
- 33
- Price-to-rent
- 3.6×
Monthly cashflow live
- Estimated rent
- $1,586 high interval (Pro) →
- Mortgage (P&I)
- −$362
- Tax from tax record
- −$223 /mo · $2,678/yr
- Insurance
- −$29
- HOA
- −$0
- Vacancy / Maint / Mgmt
- −$333
- Net cashflow
- $639
Break-even live
UW: 25.0% down · 7.5% · 30yr · 1.5% tax · 5.0% vac · 8.0% maint · 8.0% mgmt
Financing live
Cash to close
- Down payment
- $17,250
- Closing costs
- $2,070
- Reserves months
- —
- Total cash needed
- —
Loan-product check · same deal, 3 products live
Conventional
25% down · 7.5% · 30yr
- Down + closing
- —
- Monthly P&I
- —
- Monthly cashflow
- —
- DSCR
- —
- Eligible?
- —
Personal DTI + credit; lowest rate.
DSCR
20% down · 8.5% · 30yr
- Down + closing
- —
- Monthly P&I
- —
- Monthly cashflow
- —
- DSCR
- —
- Eligible?
- —
No personal income docs; deal must DSCR.
Hard money
10% down · 12.0% · 12mo
- Down + closing
- —
- Monthly P&I
- —
- Monthly cashflow
- —
- DSCR
- —
- Eligible?
- —
Short-term bridge; refi at stabilization.
Rent comps 22 comps
| Address | Beds | Baths | Sqft | Rent | $/sqft | DOM | Units | Dist |
|---|---|---|---|---|---|---|---|---|
| 1723 W Fredonia Ave Peoria, IL | 4.0 | 2.5 | 1219 | $2,100 | $1.72 | 13d | 1 | 0.05mi |
| 1816 W Callender Ave Peoria, IL | 3.0 | 2.0 | 1628 | $1,650 | $1.01 | 44d | 1 | 0.13mi |
| 1019 N Farmington Rd Unit 1017 Peoria, IL | 3.0 | 1.0 | 1304 | $1,600 | $1.23 | 44d | 1 | 0.39mi |
| 102 N Cedar Ave West Peoria, IL | 4.0 | 1.0 | 1272 | $995 | $0.78 | 44d | 1 | 0.48mi |
| 1401 W Adrian G Hinton Ave Peoria, IL | 2.0 | 1.0 | 1100 | $775 | $0.70 | 44d | 1 | 0.50mi |
| 2601 W Kenwood Ave West Peoria, IL | 3.0 | 1.5 | 1405 | $1,500 | $1.07 | 13d | 1 | 0.71mi |
| 1540 W Kettelle St Peoria, IL | 3.0 | 1.0 | 1001 | $748 | $0.75 | 13d | 1 | 0.72mi |
| 818 W Moss Ave Peoria, IL | 2.0 | 2.0 | 1580 | $1,800 | $1.14 | 13d | 1 | 0.81mi |
| 1214 W Butler St Peoria, IL | 4.0 | 1.0 | 1440 | $795 | $0.55 | 44d | 1 | 0.88mi |
| 2807 W Howett St Peoria, IL | 3.0 | 2.0 | 1388 | $1,550 | $1.12 | 44d | 1 | 1.13mi |
| 416 W Main St Unit A Peoria, IL | 2.0 | 1.0 | 1050 | $950 | $0.90 | 44d | 1 | 1.14mi |
| 945 S Shelley St Peoria, IL | 1.0–3.0 | 1.0–2.0 | 929 | $1,025 | $1.10 | 13d | 1 | 1.16mi |
| 928 S Matthew St Peoria, IL | 2.0 | 1.0 | 1080 | $748 | $0.69 | 13d | 1 | 1.16mi |
| 2116 W Proctor St Peoria, IL | 2.0 | 1.0 | 912 | $879 | $0.96 | 13d | 1 | 1.18mi |
| 501 W Columbia Ter Unit 3 Peoria, IL | 3.0 | 1.0 | 1500 | $1,400 | $0.93 | 44d | 1 | 1.21mi |
| 214 Pecan St Peoria, IL | 2.0 | 1.0 | 1050 | $1,595 | $1.52 | 13d | 1 | 1.27mi |
| 2523 W Nebraska Ave Peoria, IL | 3.0 | 2.0 | 1600 | $1,450 | $0.91 | 21d | 1 | 1.28mi |
| 2023 N Underhill St Peoria, IL | 3.0 | 1.0 | 1050 | $1,200 | $1.14 | 13d | 1 | 1.31mi |
| 1801 N Gentry Ln West Peoria, IL | 3.0 | 1.0 | 1000 | $1,650 | $1.65 | 13d | 1 | 1.32mi |
| 3001 W Wiswall St Peoria, IL | 2.0 | 1.0 | 1000 | $1,100 | $1.10 | 13d | 1 | 1.40mi |
| 2320 W Garden St Peoria, IL | 2.0 | 1.0 | 1096 | $1,000 | $0.91 | 44d | 1 | 1.41mi |
| 3031 W Wiswall St Peoria, IL | 2.0 | 1.0 | 1100 | $1,100 | $1.00 | 13d | 1 | 1.47mi |
Listing history 18 events
-
2026-04-29status Pending
-
2026-04-28price $69,000
-
2026-04-20price $75,000
-
2026-04-07price $90,000
-
2026-03-23price $95,000
-
2026-02-20price $100,000
-
2026-02-03$110,000 Active
-
2021-08-06historical
-
2020-10-02soldstatus $43,000 491-char remark
Show marketing remark (491 chars)
3 bedroom, 2 bath, 1.5 Story home in historical area. Home features great front porch, original hardwood floors in the living room with built-in's, and great natural lighting, all original woodwork, brick fireplace, formal dining room, den/office space, and all 3 bedrooms on one level. Updates include furnace ('19), water heater ('17). Fenced in backyard with deck, and 1 car detached garage with shared driveway. This property is in an estate and sold "as-is" with no repairs.
-
2020-06-09$50,000 491-char remark
Show marketing remark (491 chars)
3 bedroom, 2 bath, 1.5 Story home in historical area. Home features great front porch, original hardwood floors in the living room with built-in's, and great natural lighting, all original woodwork, brick fireplace, formal dining room, den/office space, and all 3 bedrooms on one level. Updates include furnace ('19), water heater ('17). Fenced in backyard with deck, and 1 car detached garage with shared driveway. This property is in an estate and sold "as-is" with no repairs.
-
2004-09-16soldstatus $97,500
-
2004-09-15soldstatus $97,500
-
2004-04-15$102,500
-
2001-08-27soldstatus $89,500
-
2001-08-27soldstatus $89,500
-
2001-06-01$93,500
ⓘ Source: listings_history table (triggers on properties + properties_extension) + one-shot
backfill from property_details.listing_events for pre-trigger history.
Tax reassessment forecast IL · Partial reset (capped growth)
- Current annual tax
- $2,678 · $223/mo
- Projected year-2 tax
- $2,678 · $223/mo
- Expected delta
- $0/yr ($0/mo · 0.0%)
ⓘ Screening estimate from a state-policy table — verify with the county assessor before closing.
Climate risk First Street
- Flood 3/10 Moderate FEMA zone X · 20% chance over 30 yrs
- Wildfire 1/10 Low
- Heat 3/10 Moderate 7 d/yr ≥105°F today · 18 d/yr by 30 yrs out
- Wind 2/10 Low 100% chance of damaging wind over 30 yrs
- Air quality 3/10 Moderate 1 unhealthy d/yr today · 3 by 30 yrs out
Nearby sold comps map
Loading sold comps map…
Walkable amenities ~0.75 mi
Loading nearby amenities…
Taxation est. · year 1
- Rental income
- $19,032
- − Mortgage interest
- −$3,865
- − Property taxes
- −$2,678
- − Insurance
- −$345
- − Repairs & maintenance
- −$1,523
- − Management
- −$1,523
- − Depreciation
- −$2,007
- Taxable income
- $7,091
- Est. tax owed @ 24.0%
- −$1,702
- After-tax cash flow
- $5,968/yr
For passive investors: Depreciation is non-cash, so a rental often shows a tax loss while cash-flowing — sheltering income. Rental losses are passive: they offset passive income freely, and up to $25,000/yr can offset ordinary (W-2) income if you actively participate and your MAGI is under $100k (phasing out to $0 by $150k); unused losses carry forward. On sale, claimed depreciation is recaptured at up to 25%, and gains may owe capital-gains tax (a 1031 exchange can defer both). Figures are a year-1 estimate at your 24.0% rate — not tax advice; consult a CPA.
Schools (NCES district)
- District
- Peoria SD 150
- NCES district ID
- 1731230
- Math proficiency
- 11% ▼ -5.00%
- Reading proficiency
- 14% ▼ -4.00%
- Median HH income
- $41,951
- Composite
- 10.92/100
- National rank
- #9751
- State rank
- #554 of 620 in IL
Livability — Peoria
- Score
- 73/100
- State rank
- #270
- US rank
- #5096
Category grades
Schools grade is shown separately in the Schools card above.
Census & demographics
- Census place
- Peoria, IL
- County
- Peoria County · 120,495 people
- City population
- 114,670
- Metro
- Peoria, IL
- Population (ZIP)
- 6,684
- Household income
- $39,196
- Rent vs Own
- Severe rent burden
- 620.0
Population outlook (Peoria County) Hauer SSP2
- Today (2025)
- 183,007 people
- By 2030
- 179,643 · -1.8%
- By 2040
- 171,782 · -6.1%
- By 2050
- 163,508 · -10.7%
- By 2075
- 140,178 · -23.4%
- By 2100
- 114,493 · -37.4%
Race, ethnicity, and origin ACS 2023
- Neighborhood character
- Predominantly White (66%)
- Race & ethnicity
- White 66% Black 17% Two or more races 9% Hispanic / Latino 8% Asian 3%
- Hispanic origin (detail)
- Mexican 6%
- Common ancestry
- Romanian 4% Slovak 2% Lithuanian 2%
- Foreign-born
- 4% · Vietnam, Canada
- Languages at home
- 94% English-only · Spanish 3% Other Indo-European 1% Chinese 1%
Political lean MEDSL · Peoria
- 2024 margin
- Toss-up / Even · D 51.5% · R 46.9% · Other 1.6%
- 2008→2024 swing
- -9.2pp toward R · 2008: 13.9pp · 2024: 4.7pp
- All cycles
- 2024: D+4.7 2020: D+6.3 2016: D+2.8 2012: D+4.4 2008: D+13.9
Not yet ingested
- Civics
- —
Market trends
- HPI YoY
- ▼ -85.67%
- Current HPI
- 166.329
- Rent YoY
- —
- Metro
- Peoria, IL
- State GDP YoY
- ▲ 1.59%
- F500 in state
- 60
Industry mix (Fortune 500 HQ in IL)
| Industry | F500 HQs | Revenue |
|---|---|---|
| Insurance | 4 | $201B |
|
||
| Consumer Goods | 4 | $87B |
|
||
| Industrial Machinery | 3 | $64B |
|
||
| Healthcare | 2 | $55B |
|
||
| Retail / Pharmacy | 1 | $148B |
|
||
| Agriculture / Food | 1 | $86B |
|
||
Price history
-26.2% since first listed18 events — show timeline
- 2026-04-29 Pending — RMLSA as Distributed by MLS Grid
- 2026-04-28 Price Changed $69,000 RMLSA as Distributed by MLS Grid
- 2026-04-20 Price Changed $75,000 RMLSA as Distributed by MLS Grid
- 2026-04-07 Price Changed $90,000 RMLSA as Distributed by MLS Grid
- 2026-03-23 Price Changed $95,000 RMLSA as Distributed by MLS Grid
- 2026-02-20 Price Changed $100,000 RMLSA as Distributed by MLS Grid
- 2026-02-03 Listed $110,000 RMLSA as Distributed by MLS Grid
- 2021-08-06 Listing Removed — RMLSA as Distributed by MLS Grid
- 2020-10-02 Sold (MLS) $43,000 RMLSA as Distributed by MLS Grid
- 2020-10-02 Sold (MLS) $43,000 MRED as Distributed by MLS Grid
- 2020-06-09 Listed $50,000 RMLSA as Distributed by MLS Grid
- 2020-06-09 Listed $50,000 MRED as Distributed by MLS Grid
- 2004-09-16 Sold (Public Records) $97,500 Public Records
- 2004-09-15 Sold (MLS) $97,500 RMLSA as Distributed by MLS Grid
- 2004-04-15 Listed $102,500 RMLSA as Distributed by MLS Grid
- 2001-08-27 Sold (Public Records) $89,500 Public Records
- 2001-08-27 Sold (MLS) $89,500 RMLSA as Distributed by MLS Grid
- 2001-06-01 Listed $93,500 RMLSA as Distributed by MLS Grid
Property tax history
+4.1%/yrLatest (2024): $2,678 · +4.8% YoY. Source: county tax records.
Cash-flow waterfall
monthlySold comps — $/sqft
last 12 mo · ≤1 miLoading sold comps…