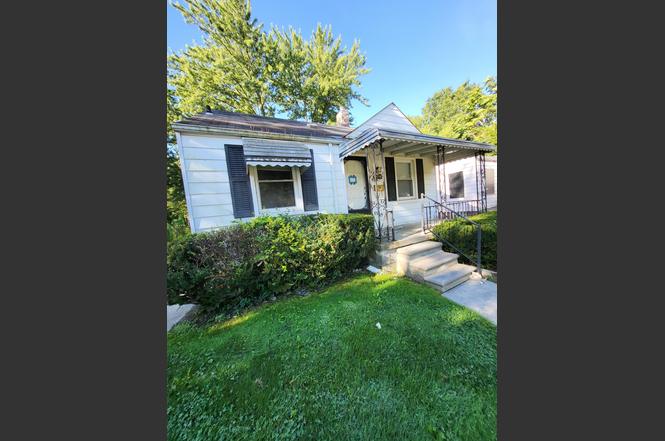
19716 Kenosha St · Harper Woods, MI
Flood risk 1/10 · Minimal
- FEMA flood zone
- X (unshaded)
- Chance of flooding over 30 yrs
- 0.0%
- Est. flood insurance / yr
- $507 – $1,088
Fire risk 1/10 · Minimal
- Est. fire insurance / yr
- $784 – $1,456
Heat risk 3/10 · Minor
- Hot days now (above 95°F)
- 7 days/yr
- Hot days in 30 yrs
- 15 days/yr
Wind risk 2/10 · Minimal
- Chance of severe wind over 30 yrs
- —
Air-quality risk 3/10 · Minor
- Unhealthy air days now
- 3 days/yr
- Unhealthy air days in 30 yrs
- 4 days/yr
Risk factors via First Street. Map © Google.
Why this score? — see what drove the C grade
The composite is a weighted blend of 9 inputs, each scored 0–100. Each bar is that input's sub-score; the figure is the points it added to the 100-point composite (weight × sub-score).
- Cash flow +23.6/30.0
- DSCR +7.6/10.0
- ARV discount +7.5/15.0
- 1% rule +6.2/10.0
- Rent growth +3.8/5.0
- Livability +3.7/5.0
- Condition / age +2.5/5.0
- Schools +0.9/10.0
- Appreciation +0.0/10.0
$115,000
🖨 Deal sheet 📄 Offer letter ✓ Due diligence
Listing remarks MLS
This Ranch home features 3 bedrooms, 1 bath, 1 car garage and a full unfinished basement. Seller to provide C of O at closing
Key facts
- 4,792 sq ft lot
- Garage
- Built 1940
Property features AI
Exterior
- Parking: Detached garage (1 garage space)
- Utilities: Public water
- Home design: Ranch-style single-family home; One story; Built in 1940
- Construction: Aluminum siding
- Exterior features: Lot is approximately 0.11 acres; Public water
Interior
- Kitchen: Kitchen (13 x 12)
- Bedrooms: Primary bedroom (12 x 10); Bedroom 2 (10 x 10); Bedroom 3 (10 x 10)
- Bathrooms: One full bathroom (primary bathroom listed)
- Heating & cooling: Forced air heating
- Interior features: Six total rooms; Full basement
Neighborhood map
What this means for you Summary
Snapshot
- This is a 2-bed/1.0-bath single-family listed at $115k.
Deal economics
- At list price, monthly cash flow is $216 ($3k/yr) — positive.
- The deal already cash-flows at list — no discount required.
- Meets the 1% rule at list price ($1k rent vs $115k).
- Recommended offer: $101k (12.0% below list) — sets the bar for market timing.
Location & tenants
- Location reads 73/100 on livability (#199 in MI) — a middle-class / working-renter tenant base. Strengths: commute A+, cost of living A+, housing A+; Watch: employment D+, health & safety D+, schools D-.
- Harper Woods School District (suburban): math 4% / reading 15% proficiency, ranked #524 of 540 in MI (top 97%) — low school quality limits family demand, transient renter base, plan for 1-2y turnover; 69% free/reduced lunch — lower-income household profile, screen leases tightly.
- Market conditions: Rents rising fast (+5.1%/yr); 133 active listings in the ZIP; 40 comparable units currently listed for rent nearby; rentals at typical pace (median 25d on market — plan ~3-4 weeks tenant-placement turnaround); 40% of comp listings sitting > 30 days — soft ceiling on asking rent; 2,639 units permitted in Wayne County in 2024 (1,216 in 5+ unit buildings).
Forward outlook
- Local home prices are declining (-3.0%/yr); year-one equity from $795 of loan paydown is wiped out by about $3k of value loss. Plan a longer hold.
- Wayne County population projected at -17% by 2050 — secular population decline; favor cash flow + early exit over multi-decade hold.
- At projected returns (-3.0% appreciation + 5.1% rent growth), your $32k cash investment doubles in ~10 years — after that, you're playing with house money.
Negotiation context
- It's been on market 449 days — a 12% lower offer ($101k) is reasonable based on typical stale-listing flexibility.
- 15 sale attempts since 22y ago; this cycle's ask has dropped $15k (12%) from the opening price — seller is motivated, your offer sets the floor, not the list.
Risks & watch-outs
- Watch-outs: built in 1940 — expect roof / HVAC / electrical / plumbing capex.
Questions for the listing agent
- It's been on market 449 days. Have you received any prior offers? Is the seller open to a 12% concession, seller financing, or rate buy-down credit?
- Built in 1940 — when were the roof, HVAC, electrical panel, plumbing, and water heater last replaced?
- Why hasn't it sold? Are there any deal-killer items the seller is aware of (foundation, flood, title, zoning, code violations)?
- Is there a deadline driving the sale (1031 exchange, divorce, estate, relocation)? That informs how much negotiation room exists.
- Schools are D-rated, which usually means shorter tenancies and higher turnover. Who's the typical renter profile here, and what's been the actual vacancy rate?
- Crime grade is F in this area — have there been break-ins, vandalism, or insurance claims at this property in the last 3 years? What carrier currently insures it and at what premium?
- What's the average days-on-market for RENTAL listings here right now (not sales)? A rising rental-DOM trend means longer vacancies and softer asking-rent achievability than the comps imply.
- What's the recent tenant-quality profile in this submarket — average credit score on applications, eviction rate, late-payment / NSF rate, and stable-employment percentage? A property-management company in the area should have these aggregated.
- How much new for-sale + rental construction is in the pipeline within 1–3 miles? Heavy new supply typically softens prices + rents 12–24 months out; constrained supply supports both.
Investment metrics
- 1% rule
- 1.12% ✓
- Cap rate
- 8.55%
- Cash-on-cash
- 8.06%
- DSCR
- 1.36
- GRM
- 7.4
CMA / ARV
- ARV (on-the-fly)
- $61,320
- Comps found
- 12
Show comp detail 12 sales within ~0.75 mi
| Address | Dist | Beds/Ba | Sqft | Sold | Price | $/sf | Match |
|---|---|---|---|---|---|---|---|
| 19381 Kenosha St | 0.23mi | 2/1.0 | 892 (+6%) | 2mo | $104,000 | $117 | 77 |
| 11035 Worden St | 0.41mi | 3/1.0 (+1) | 834 (-1%) | 3mo | $55,000 | $66 | 72 |
| 12075 Rossiter St | 0.46mi | 3/1.0 (+1) | 851 (+1%) | 4mo | $45,000 | $53 | 68 |
| 18591 Kingsville St | 0.70mi | 2/1.0 | 824 (-2%) | 1mo | $74,000 | $90 | 64 |
| 12897 Riad St | 0.74mi | 3/1.0 (+1) | 831 (-1%) | 1mo | $63,000 | $76 | 58 |
| 20300 Mccormick St | 0.38mi | 3/1.0 (+1) | 940 (+12%) | 1mo | $60,000 | $64 | 57 |
| 18953 Woodcrest St | 0.56mi | 3/1.0 (+1) | 917 (+9%) | 3mo | $105,000 | $115 | 51 |
| 11017 Worden St | 0.42mi | 3/1.0 (+1) | 961 (+14%) | 0mo | $47,500 | $49 | 51 |
| 10945 Peerless St | 0.43mi | 3/1.0 (+1) | 964 (+15%) | 2mo | $54,000 | $56 | 49 |
| 18746 Woodside St | 0.66mi | 3/1.0 (+1) | 921 (+10%) | 2mo | $110,000 | $119 | 47 |
| 12505 Laing St | 0.70mi | 3/1.0 (+1) | 752 (-10%) | 3mo | $54,600 | $73 | 42 |
| 18567 Woodside Rd | 0.74mi | 2/1.0 | 960 (+14%) | 3mo | $65,000 | $68 | 40 |
Match score weights: distance 35% · size 25% · config 20% · recency 20%. Top-matched comps best support the ARV.
Projected returns pro-forma
-3.0% appreciation · 5.1% rent growth · sell at horizon
- IRR
- -1.6%
- Equity multiple
- 0.94×
- Total profit
- $-2,051
- Equity at exit
- $17,147
- IRR
- 10.2%
- Equity multiple
- 1.87×
- Total profit
- $27,955
- Equity at exit
- $9,943
Cash invested: $32,200 (down + closing). Projections, not guarantees.
Landlord ↔ Tenant lean methodology
- Overall (STATE)
- 62 Landlord-Friendly
- State Michigan
- 62 Landlord-Friendly · EVEN
- County
- — inherits STATE
- City
- — inherits STATE
ZIP-level market 48225
- Rents YoY
- 5.1%
- Active inventory
- 133
- Price-to-rent
- 7.4×
Monthly cashflow live
- Estimated rent
- $1,288 high interval (Pro) →
- Mortgage (P&I)
- −$603
- Tax from tax record
- −$150 /mo · $1,799/yr
- Insurance
- −$48
- HOA
- −$0
- Vacancy / Maint / Mgmt
- −$270
- Net cashflow
- $216
Break-even live
UW: 25.0% down · 7.5% · 30yr · 1.5% tax · 5.0% vac · 8.0% maint · 8.0% mgmt
Financing live
Cash to close
- Down payment
- $28,750
- Closing costs
- $3,450
- Reserves months
- —
- Total cash needed
- —
Loan-product check · same deal, 3 products live
Conventional
25% down · 7.5% · 30yr
- Down + closing
- —
- Monthly P&I
- —
- Monthly cashflow
- —
- DSCR
- —
- Eligible?
- —
Personal DTI + credit; lowest rate.
DSCR
20% down · 8.5% · 30yr
- Down + closing
- —
- Monthly P&I
- —
- Monthly cashflow
- —
- DSCR
- —
- Eligible?
- —
No personal income docs; deal must DSCR.
Hard money
10% down · 12.0% · 12mo
- Down + closing
- —
- Monthly P&I
- —
- Monthly cashflow
- —
- DSCR
- —
- Eligible?
- —
Short-term bridge; refi at stabilization.
Rent comps 40 comps
| Address | Beds | Baths | Sqft | Rent | $/sqft | DOM | Units | Dist |
|---|---|---|---|---|---|---|---|---|
| 19661 Kenosha St Harper Woods, MI | 3.0 | 2.0 | 1000 | $1,400 | $1.40 | 24d | 1 | 0.06mi |
| 19442 Kingsville St Harper Woods, MI | 3.0 | 1.0 | 1000 | $1,500 | $1.50 | 17d | 1 | 0.22mi |
| 19982 McCormick St Detroit, MI | 3.0 | 1.0 | 866 | $1,200 | $1.39 | 3d | 1 | 0.23mi |
| 19639 Moross Rd Unit 1 Detroit, MI | 2.0 | 1.0 | 900 | $1,100 | $1.22 | 43d | 1 | 0.23mi |
| 19152 Woodside St Harper Woods, MI | 3.0 | 1.0 | 916 | $1,500 | $1.64 | 17d | 1 | 0.41mi |
| 10985 Peerless St Detroit, MI | 3.0 | 1.0 | 1000 | $1,364 | $1.36 | 5d | 1 | 0.41mi |
| 19144 Moross Rd Detroit, MI | 2.0 | 1.0 | 900 | $1,050 | $1.17 | 43d | 1 | 0.48mi |
| 12075 Rossiter St Detroit, MI | 3.0 | 1.0 | 1100 | $1,245 | $1.13 | 43d | 1 | 0.49mi |
| 12075 Rossiter St Detroit, MI | 3.0 | 1.0 | 1100 | $1,245 | $1.13 | 15d | 1 | 0.49mi |
| 10542 Lanark St Detroit, MI | 3.0 | 1.0 | 1023 | $1,250 | $1.22 | 43d | 1 | 0.66mi |
| 11776 Rossiter St Detroit, MI | 3.0 | 1.0 | 964 | $1,150 | $1.19 | 11d | 1 | 0.67mi |
| 11529 Roxbury St Detroit, MI | 2.0 | 1.0 | 720 | $1,200 | $1.67 | 12d | 1 | 0.67mi |
| 10692 Meuse St Detroit, MI | 3.0 | 1.0 | 955 | $1,250 | $1.31 | 12d | 1 | 0.74mi |
| 11611 Morang Ave Detroit, MI | 1.0–2.0 | 1.0 | 709 | $1,040 | $1.47 | 43d | 1 | 0.75mi |
| 19203 Edgefield St Harper Woods, MI | 2.0 | 1.0 | 1100 | $1,100 | $1.00 | 24d | 1 | 0.78mi |
| 12716 Riad St Detroit, MI | 3.0 | 1.0 | 974 | $1,275 | $1.31 | 17d | 1 | 0.79mi |
| 16241 Seven Mile E Unit 4 Detroit, MI | 1.0 | 1.0 | 650 | $650 | $1.00 | 43d | 1 | 0.84mi |
| 10400 Britain St Detroit, MI | 3.0 | 1.0 | 890 | $1,100 | $1.24 | 43d | 1 | 0.85mi |
| 10370 Britain St Detroit, MI | 3.0 | 1.0 | 1100 | $1,100 | $1.00 | 43d | 1 | 0.86mi |
| 20015 Lochmoor St Harper Woods, MI | 3.0 | 1.0 | 1006 | $1,500 | $1.49 | 16d | 1 | 0.86mi |
| 16212 Maddelein St Detroit, MI | 2.0 | 1.0 | 800 | $1,200 | $1.50 | 12d | 1 | 0.87mi |
| 12201 Morang Ave Unit 8 Detroit, MI | 2.0 | 1.0 | 610 | $875 | $1.43 | 43d | 1 | 0.91mi |
| 11235 Roxbury St Detroit, MI | 3.0 | 1.0 | 1062 | $1,325 | $1.25 | 17d | 1 | 0.91mi |
| 21301 Kingsville St Apt 108 Harper Woods, MI | 1.0 | 1.0 | 700 | $900 | $1.29 | 3d | 1 | 0.91mi |
| 17710 Chester St Detroit, MI | 2.0 | 1.0 | 984 | $1,250 | $1.27 | 43d | 1 | 0.92mi |
| 17720 Chester St Detroit, MI | 2.0 | 1.0 | 986 | $1,250 | $1.27 | 43d | 1 | 0.92mi |
| 21401 Kingsville St Harper Woods, MI | 2.0 | 1.0 | 944 | $1,200 | $1.27 | 24d | 1 | 0.99mi |
| 10177 Boleyn St Detroit, MI | 3.0 | 1.0 | 767 | $1,250 | $1.63 | 43d | 1 | 0.99mi |
| 6301 Lodewyck St Detroit, MI | 3.0 | 1.0 | 1084 | $1,300 | $1.20 | 12d | 1 | 1.00mi |
| 6325 Neff Ave Detroit, MI | 3.0 | 1.0 | 1000 | $1,500 | $1.50 | 2d | 1 | 1.00mi |
| 15909 Maddelein St Detroit, MI | 3.0 | 1.0 | 894 | $1,266 | $1.42 | 43d | 1 | 1.03mi |
| 10037 Grayton St Detroit, MI | 3.0 | 1.0 | 1000 | $1,400 | $1.40 | 3d | 1 | 1.06mi |
| 6175 Marseilles St Detroit, MI | 3.0 | 1.0 | 1100 | $1,100 | $1.00 | 43d | 1 | 1.06mi |
| 6304 Bluehill St Detroit, MI | 3.0 | 1.0 | 1088 | $1,500 | $1.38 | 43d | 1 | 1.06mi |
| 6181 Neff Ave Detroit, MI | 3.0 | 1.0 | 1102 | $1,299 | $1.18 | 18d | 1 | 1.08mi |
| 20600 Balfour St Harper Woods, MI | 1.0–2.0 | 1.0–2.0 | 971 | $1,671 | $1.72 | 1d | 12 | 1.19mi |
| 10404 Somerset Ave Detroit, MI | 3.0 | 1.0 | 1108 | $1,475 | $1.33 | 3d | 1 | 1.20mi |
| 16291 Eastburn St Detroit, MI | 3.0 | 1.0 | 1000 | $1,364 | $1.36 | 24d | 1 | 1.22mi |
| 15494 Mapleridge St Detroit, MI | 3.0 | 1.0 | 937 | $1,275 | $1.36 | 43d | 1 | 1.24mi |
| 5955 Guilford St Detroit, MI | 3.0 | 1.0 | 802 | $1,400 | $1.75 | 17d | 1 | 1.24mi |
Listing history 49 events
-
2026-06-18days on market $115,000 Active 449 DOM
-
2026-06-17days on market $115,000 Active 448 DOM
-
2026-06-16days on market $115,000 Active 447 DOM
-
2026-06-15days on market $115,000 Active 446 DOM
-
2026-06-13days on market $115,000 Active 444 DOM
-
2026-06-13days on market $115,000 Active 443 DOM
-
2026-06-09days on market $115,000 Active 440 DOM
-
2026-06-08days on market $115,000 Active 439 DOM
-
2026-06-07days on market $115,000 Active 438 DOM
-
2026-06-04days on market $115,000 Active 435 DOM
-
2026-06-03days on market $115,000 Active 434 DOM
-
2026-06-02days on market $115,000 Active 433 DOM
-
2026-06-01days on market $115,000 Active 432 DOM
-
2026-05-31days on market $115,000 Active 431 DOM
-
2026-04-08price $115,000 125-char remark
Show marketing remark (125 chars)
This Ranch home features 3 bedrooms, 1 bath, 1 car garage and a full unfinished basement. Seller to provide C of O at closing
-
2026-04-08price $115,000 125-char remark
Show marketing remark (125 chars)
This Ranch home features 3 bedrooms, 1 bath, 1 car garage and a full unfinished basement. Seller to provide C of O at closing
-
2026-04-08price $115,000
Show marketing remark (125 chars)
This Ranch home features 3 bedrooms, 1 bath, 1 car garage and a full unfinished basement. Seller to provide C of O at closing
-
2025-03-26$130,000 Active 125-char remark
Show marketing remark (125 chars)
This Ranch home features 3 bedrooms, 1 bath, 1 car garage and a full unfinished basement. Seller to provide C of O at closing
-
2025-03-26$130,000 Active 125-char remark
Show marketing remark (125 chars)
This Ranch home features 3 bedrooms, 1 bath, 1 car garage and a full unfinished basement. Seller to provide C of O at closing
-
2025-03-26$130,000 Active
Show marketing remark (125 chars)
This Ranch home features 3 bedrooms, 1 bath, 1 car garage and a full unfinished basement. Seller to provide C of O at closing
-
2025-01-04historical
-
2025-01-04historical
-
2024-11-16status Active
-
2024-11-16status Active
-
2024-10-28status Pending
-
2024-10-28status Pending
-
2024-01-08$80,000 Active
-
2024-01-08$80,000 Active
-
2020-01-17soldstatus $2,519,353
-
2008-07-17soldstatus $25,000
-
2008-07-17soldstatus $25,000
-
2008-06-04historical
-
2008-04-24$32,500
-
2008-04-24$32,500
-
2006-06-07soldstatus $110,000
-
2006-05-17soldstatus $110,000
-
2006-05-17soldstatus $110,000
-
2006-05-08historical
-
2006-04-03$119,900
-
2006-04-03$119,900
-
2005-10-19historical
-
2005-10-19historical
-
2005-08-17$89,900
-
2005-08-05$89,900
-
2005-05-29historical
-
2005-02-01$105,000
-
2005-01-19soldstatus $76,700
-
2005-01-13historical
-
2004-09-20$82,900
ⓘ Source: listings_history table (triggers on properties + properties_extension) + one-shot
backfill from property_details.listing_events for pre-trigger history.
Tax reassessment forecast MI · Partial reset (capped growth)
- Current annual tax
- $1,799 · $150/mo
- Projected year-2 tax
- $1,799 · $150/mo
- Expected delta
- $0/yr ($0/mo · 0.0%)
ⓘ Screening estimate from a state-policy table — verify with the county assessor before closing.
Climate risk First Street
- Flood 1/10 Low FEMA zone X (unshaded) · 0% chance over 30 yrs
- Wildfire 1/10 Low
- Heat 3/10 Moderate 7 d/yr ≥95°F today · 15 d/yr by 30 yrs out
- Wind 2/10 Low
- Air quality 3/10 Moderate 3 unhealthy d/yr today · 4 by 30 yrs out
Nearby sold comps map
Loading sold comps map…
Walkable amenities ~0.75 mi
Loading nearby amenities…
Taxation est. · year 1
- Rental income
- $15,453
- − Mortgage interest
- −$6,442
- − Property taxes
- −$1,799
- − Insurance
- −$575
- − Repairs & maintenance
- −$1,236
- − Management
- −$1,236
- − Depreciation
- −$3,345
- Taxable income
- $819
- Est. tax owed @ 24.0%
- −$197
- After-tax cash flow
- $2,400/yr
For passive investors: Depreciation is non-cash, so a rental often shows a tax loss while cash-flowing — sheltering income. Rental losses are passive: they offset passive income freely, and up to $25,000/yr can offset ordinary (W-2) income if you actively participate and your MAGI is under $100k (phasing out to $0 by $150k); unused losses carry forward. On sale, claimed depreciation is recaptured at up to 25%, and gains may owe capital-gains tax (a 1031 exchange can defer both). Figures are a year-1 estimate at your 24.0% rate — not tax advice; consult a CPA.
Schools (NCES district)
- District
- Harper Woods School District
- NCES district ID
- 2617760
- Math proficiency
- 4% ▼ -7.00%
- Reading proficiency
- 15% ▼ -9.00%
- Median HH income
- $46,155
- Composite
- 8.8/100
- National rank
- #9892
- State rank
- #524 of 540 in MI
Livability — Harper Woods
- Score
- 73/100
- State rank
- #199
- US rank
- #5054
Category grades
Schools grade is shown separately in the Schools card above.
Census & demographics
- Census place
- Harper Woods, MI
- County
- Wayne County · 1,562,939 people
- City population
- 16,098
- Metro
- Detroit-Warren-Dearborn, MI
- Population (ZIP)
- 16,098
- Household income
- $61,750
- Rent vs Own
- Severe rent burden
- 410.0
Population outlook (Wayne County) Hauer SSP2
- Today (2025)
- 1,675,273 people
- By 2030
- 1,620,300 · -3.3%
- By 2040
- 1,502,341 · -10.3%
- By 2050
- 1,384,039 · -17.4%
- By 2075
- 1,124,592 · -32.9%
- By 2100
- 881,193 · -47.4%
Race, ethnicity, and origin ACS 2023
- Neighborhood character
- Predominantly Black (65%)
- Race & ethnicity
- Black 65% White 28% Two or more races 4% Hispanic / Latino 1%
- Common ancestry
- Romanian 4% Lithuanian 1% German 1%
- Foreign-born
- 2% · Canada
- Languages at home
- 95% English-only · Arabic 2% Spanish 1%
Political lean MEDSL · Wayne
- 2024 margin
- Strong D (+29.0) · D 62.7% · R 33.7% · Other 3.6%
- 2008→2024 swing
- -20.5pp toward R · 2008: 49.5pp · 2024: 29.0pp
- All cycles
- 2024: D+29.0 2020: D+38.1 2016: D+37.3 2012: D+46.9 2008: D+49.5
Not yet ingested
- Civics
- —
Market trends
- HPI YoY
- ▼ -150.40%
- Current HPI
- 181.4961
- Rent YoY
- ▲ 5.10%
- Metro
- Detroit-Warren-Dearborn, MI
- State GDP YoY
- ▲ 1.37%
- F500 in state
- 28
Industry mix (Fortune 500 HQ in MI)
| Industry | F500 HQs | Revenue |
|---|---|---|
| Automotive Parts | 3 | $48B |
|
||
| Automotive | 2 | $372B |
|
||
| Chemicals | 1 | $45B |
|
||
| Automotive Retail | 1 | $29B |
|
||
| Healthcare / Medical Devices | 1 | $23B |
|
||
| Automotive Technology | 1 | $20B |
|
||
Price history
+38.7% since first listed35 events — show timeline
- 2026-04-08 Price Changed $115,000 MiRealSource-MiMLS
- 2026-04-08 Price Changed $115,000 REALCOMP
- 2026-04-08 Price Changed $115,000 SW Michigan MLS
- 2025-03-26 Listed $130,000 REALCOMP
- 2025-03-26 Listed $130,000 SW Michigan MLS
- 2025-03-26 Listed $130,000 MiRealSource-MiMLS
- 2025-01-04 Listing Removed — REALCOMP
- 2025-01-04 Listing Removed — MiRealSource-MiMLS
- 2024-11-16 Relisted — REALCOMP
- 2024-11-16 Relisted — MiRealSource-MiMLS
- 2024-10-28 Pending — REALCOMP
- 2024-10-28 Pending — MiRealSource-MiMLS
- 2024-01-08 Listed $80,000 MiRealSource-MiMLS
- 2024-01-08 Listed $80,000 REALCOMP
- 2020-01-17 Sold (Public Records) $2,519,353 Public Records
- 2008-07-17 Sold (MLS) $25,000 REALCOMP
- 2008-07-17 Sold (MLS) $25,000 MiRealSource-MiMLS
- 2008-06-04 Listing Removed — MiRealSource-MiMLS
- 2008-04-24 Listed $32,500 REALCOMP
- 2008-04-24 Listed $32,500 MiRealSource-MiMLS
- 2006-06-07 Sold (Public Records) $110,000 Public Records
- 2006-05-17 Sold (MLS) $110,000 MiRealSource-MiMLS
- 2006-05-17 Sold (MLS) $110,000 REALCOMP
- 2006-05-08 Listing Removed — MiRealSource-MiMLS
- 2006-04-03 Listed $119,900 MiRealSource-MiMLS
- 2006-04-03 Listed $119,900 REALCOMP
- 2005-10-19 Listing Removed — MiRealSource-MiMLS
- 2005-10-19 Listing Removed — REALCOMP
- 2005-08-17 Listed $89,900 REALCOMP
- 2005-08-05 Listed $89,900 MiRealSource-MiMLS
- 2005-05-29 Listing Removed — MiRealSource-MiMLS
- 2005-02-01 Listed $105,000 MiRealSource-MiMLS
- 2005-01-19 Sold (MLS) $76,700 MiRealSource-MiMLS
- 2005-01-13 Listing Removed — MiRealSource-MiMLS
- 2004-09-20 Listed $82,900 MiRealSource-MiMLS
Property tax history
+5.5%/yrLatest (2025): $1,799 · -46.7% YoY. Source: county tax records.
Cash-flow waterfall
monthlySold comps — $/sqft
last 12 mo · ≤1 miLoading sold comps…