3993 Rauch St · Lower Paxton, PA
Flood risk 1/10 · Minimal
- FEMA flood zone
- X (unshaded)
- Chance of flooding over 30 yrs
- 0.0%
- Est. flood insurance / yr
- $473 – $860
Fire risk 1/10 · Minimal
- Est. fire insurance / yr
- $511 – $949
Heat risk 5/10 · Moderate
- Hot days now (above 100°F)
- 7 days/yr
- Hot days in 30 yrs
- 15 days/yr
Wind risk 3/10 · Minor
- Chance of severe wind over 30 yrs
- 5.0%
Air-quality risk 3/10 · Minor
- Unhealthy air days now
- 2 days/yr
- Unhealthy air days in 30 yrs
- 4 days/yr
Risk factors via First Street. Map © Google.
Why this score? — see what drove the D+ grade
The composite is a weighted blend of 9 inputs, each scored 0–100. Each bar is that input's sub-score; the figure is the points it added to the 100-point composite (weight × sub-score).
- ARV discount +14.2/15.0
- Cash flow +12.3/30.0
- Rent growth +3.8/5.0
- DSCR +3.7/10.0
- Schools +3.6/10.0
- 1% rule +3.4/10.0
- Livability +2.5/5.0
- Condition / age +2.5/5.0
- Appreciation +0.0/10.0
$165,000
🖨 Deal sheet 📄 Offer letter ✓ Due diligence
Listing remarks MLS
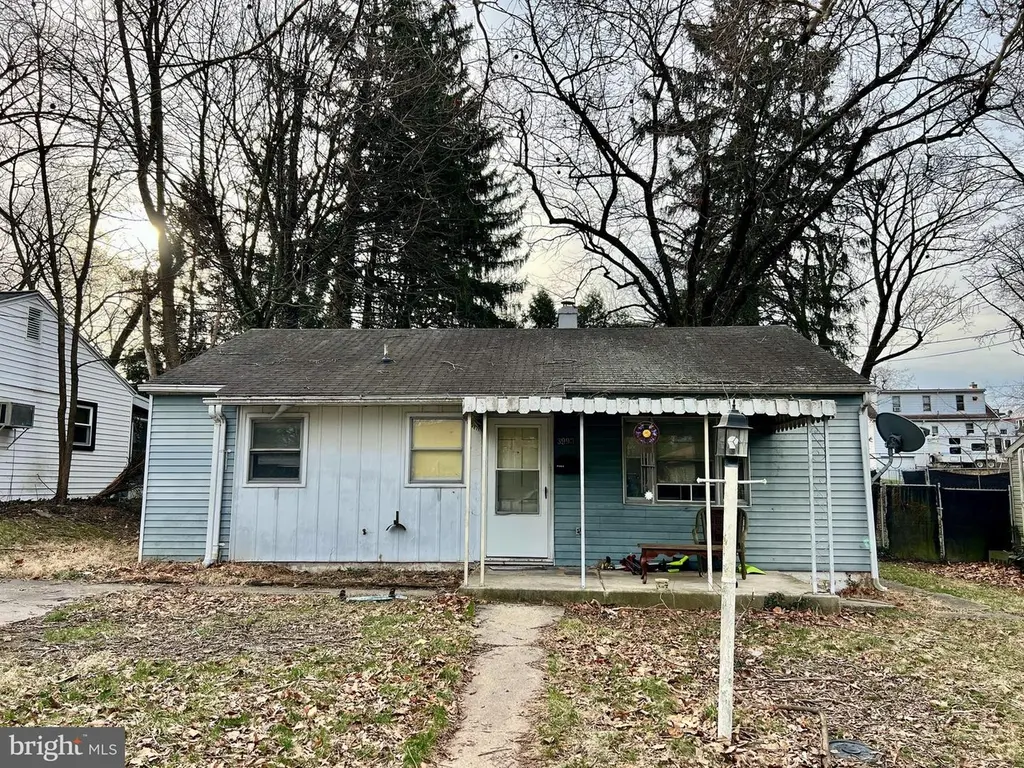
Looking for a 3-bed ranch home in Lower Paxton Township with one-level living, a partially finished basement, and off-street parking? 3993 Rauch St offers 3 bedrooms, 1 bath, approximately 1,000 sq ft, and a 6,599 sq ft lot in the Central Dauphin School District, Lower Paxton Township. Built in 1951, the property includes forced air heat, air conditioning, in-unit laundry, washer and dryer, and off-street parking. Convenient Harrisburg location with access to shopping, dining, and major commuter routes. * * * Currently tenant occupied with property management in place. Can be purchased with individually or with up to 3 other properties in portfolio. * * *
Key facts
- 6,534 sq ft lot
- Built 1951
- Listed 92 days
Neighborhood map
What this means for you Summary
Snapshot
- This is a 2-bed/1.0-bath single-family listed at $165k.
Deal economics
- At list price, monthly cash flow is $-30 ($-362/yr) — negative.
- To cash-flow at today's rent, offer at most $160k (3.2% below list).
- To meet the 1% rule (rent ≥ 1% of price), the offer needs to be $139k (16.0% below list).
- Recommended offer: $139k (16.0% below list) — sets the bar for 1% rule.
Location & tenants
- Location reads: area grade D — affects rentability + tenant quality, not the cash-flow math above.
- Central Dauphin SD (suburban): math 30% / reading 52% proficiency, ranked #305 of 539 in PA (top 57%) — families likely to look elsewhere, expect single-tenant / working-renter base with shorter leases.
- Market conditions: Rents rising fast (+5.4%/yr); 78 active listings in the ZIP; 14 comparable units currently listed for rent nearby; rentals leasing fast (median 14d on market — plan ~1-2 weeks tenant-placement turnaround); 540 units permitted in Dauphin County in 2024 (194 in 5+ unit buildings).
Forward outlook
- Local home prices are declining (-3.0%/yr); year-one equity from $1k of loan paydown is wiped out by about $5k of value loss. Plan a longer hold.
Negotiation context
- It's been on market 92 days — a 9% lower offer ($150k) is reasonable based on typical stale-listing flexibility.
- Current owner paid $66k; list at $165k implies a 152% gain — meaningful room to come down on a strong offer.
Risks & watch-outs
- Watch-outs: built in 1951 — expect roof / HVAC / electrical / plumbing capex.
- Climate carrying-cost: extreme-heat days projected 7→15/yr by 2055 (HVAC capex compounding) — expect insurance premiums to compound above CPI over the hold.
Questions for the listing agent
- What do current leases actually rent for vs. the listed asking? Can we see a recent rent roll and the last 12 months of T-12 income?
- It's been on market 92 days. Have you received any prior offers? Is the seller open to a 16% concession, seller financing, or rate buy-down credit?
- Built in 1951 — when were the roof, HVAC, electrical panel, plumbing, and water heater last replaced?
- Why hasn't it sold? Are there any deal-killer items the seller is aware of (foundation, flood, title, zoning, code violations)?
- Is there a deadline driving the sale (1031 exchange, divorce, estate, relocation)? That informs how much negotiation room exists.
- The area grade is low — what's the realistic commute time and amenity access for the typical tenant pool here? Any planned neighborhood developments (good or bad) we should know about?
- What's the average days-on-market for RENTAL listings here right now (not sales)? A rising rental-DOM trend means longer vacancies and softer asking-rent achievability than the comps imply.
- What's the recent tenant-quality profile in this submarket — average credit score on applications, eviction rate, late-payment / NSF rate, and stable-employment percentage? A property-management company in the area should have these aggregated.
- How much new for-sale + rental construction is in the pipeline within 1–3 miles? Heavy new supply typically softens prices + rents 12–24 months out; constrained supply supports both.
Investment metrics
- 1% rule
- 0.84% ✗
- Cap rate
- 6.07%
- Cash-on-cash
- -0.78%
- DSCR
- 0.97
- GRM
- 9.9
CMA / ARV
- ARV (median comp)
- $194,069
- List price
- $165,000
- Delta
- -14.98%
- Verdict
- UNDERPRICED
- Comps
- 20 within 1.0 mi
Show comp detail 8 sales within ~0.75 mi
| Address | Dist | Beds/Ba | Sqft | Sold | Price | $/sf | Match |
|---|---|---|---|---|---|---|---|
| 3616 Canterbury Rd | 0.55mi | 3/1.0 (+1) | 975 (+2%) | 8mo | $239,000 | $245 | 59 |
| 3583 Marshfield Rd | 0.72mi | 2/1.0 | 960 (+1%) | 21mo | $52,350 | $55 | 48 |
| 3598 Mobile Rd | 0.64mi | 3/2.0 (+1) | 1,027 (+8%) | 4mo | $83,000 | $81 | 45 |
| 105 Penrose St | 0.51mi | 2/1.0 | 1,056 (+11%) | 22mo | $216,000 | $205 | 39 |
| 3589 Mobile Rd | 0.67mi | 3/2.0 (+1) | 1,014 (+6%) | 18mo | $97,450 | $96 | 34 |
| 3519 Elmerton Ave | 0.70mi | 2/1.5 | 1,064 (+12%) | 17mo | $235,000 | $221 | 31 |
| 3599 Mobile Rd | 0.65mi | 3/2.0 (+1) | 1,056 (+11%) | 15mo | $71,000 | $67 | 30 |
| 3595 Sparton Rd | 0.68mi | 3/2.0 (+1) | 1,026 (+8%) | 24mo | $70,000 | $68 | 26 |
Match score weights: distance 35% · size 25% · config 20% · recency 20%. Top-matched comps best support the ARV.
Projected returns pro-forma
-3.0% appreciation · 5.37% rent growth · sell at horizon
- IRR
- -15.0%
- Equity multiple
- 0.45×
- Total profit
- $-25,264
- Equity at exit
- $24,602
- IRR
- -2.9%
- Equity multiple
- 0.79×
- Total profit
- $-9,854
- Equity at exit
- $14,266
Cash invested: $46,200 (down + closing). Projections, not guarantees.
Landlord ↔ Tenant lean methodology
- Overall (STATE)
- 62 Landlord-Friendly
- State Pennsylvania
- 62 Landlord-Friendly · EVEN
- County
- — inherits STATE
- City
- — inherits STATE
ZIP-level market 17109
- Rents YoY
- 5.4%
- Active inventory
- 78
- Price-to-rent
- 9.9×
Monthly cashflow live
- Estimated rent
- $1,386 high interval (Pro) →
- Mortgage (P&I)
- −$865
- Tax from tax record
- −$191 /mo · $2,291/yr
- Insurance
- −$69
- HOA
- −$0
- Vacancy / Maint / Mgmt
- −$291
- Net cashflow
- $-30
Break-even live
UW: 25.0% down · 7.5% · 30yr · 1.5% tax · 5.0% vac · 8.0% maint · 8.0% mgmt
Financing live
Cash to close
- Down payment
- $41,250
- Closing costs
- $4,950
- Reserves months
- —
- Total cash needed
- —
Loan-product check · same deal, 3 products live
Conventional
25% down · 7.5% · 30yr
- Down + closing
- —
- Monthly P&I
- —
- Monthly cashflow
- —
- DSCR
- —
- Eligible?
- —
Personal DTI + credit; lowest rate.
DSCR
20% down · 8.5% · 30yr
- Down + closing
- —
- Monthly P&I
- —
- Monthly cashflow
- —
- DSCR
- —
- Eligible?
- —
No personal income docs; deal must DSCR.
Hard money
10% down · 12.0% · 12mo
- Down + closing
- —
- Monthly P&I
- —
- Monthly cashflow
- —
- DSCR
- —
- Eligible?
- —
Short-term bridge; refi at stabilization.
Rent comps 14 comps
| Address | Beds | Baths | Sqft | Rent | $/sqft | DOM | Units | Dist |
|---|---|---|---|---|---|---|---|---|
| 4216 Jonestown Rd Unit A3 Harrisburg, PA | 2.0 | 1.0 | 1100 | $1,250 | $1.14 | 13d | 1 | 0.31mi |
| 4212 Williamsburg Dr Harrisburg, PA | 1.0–3.0 | 1.0–1.5 | 923 | $1,479 | $1.60 | 13d | 14 | 0.37mi |
| 4229 Elmerton Ave Unit A Harrisburg, PA | 2.0 | 1.0 | 535 | $1,350 | $2.52 | 43d | 1 | 0.39mi |
| 3800 Elmerton Ave Unit 3800- 1 Harrisburg, PA | 2.0 | 1.0 | 1000 | $1,295 | $1.29 | 23d | 1 | 0.43mi |
| 4112 Beechwood Ln Harrisburg, PA | 1.0–3.0 | 1.0–2.0 | 1007 | $1,542 | $1.53 | 13d | 8 | 0.62mi |
| 301 N Progress Ave Harrisburg, PA | 1.0–3.0 | 1.0–2.0 | 1203 | $1,466 | $1.22 | 13d | 4 | 0.74mi |
| 4131 Spring Valley Rd Harrisburg, PA | 1.0–2.0 | 1.0–2.0 | 974 | $1,440 | $1.48 | 13d | 1 | 0.82mi |
| 500 Beacon Dr Harrisburg, PA | 1.0 | 1.0 | 700 | $1,410 | $2.01 | 13d | 5 | 0.85mi |
| 4245 Sussex Dr Lower Paxton Township, PA | 1.0–2.0 | 1.0 | 720 | $1,395 | $1.94 | 43d | 1 | 0.95mi |
| 3250 Wakefield Rd Harrisburg, PA | 1.0–2.0 | 1.0 | 650 | $1,305 | $2.01 | 13d | 12 | 1.05mi |
| 821 Sequoia Dr Harrisburg, PA | 1.0–3.0 | 1.0–2.5 | 1200 | $1,598 | $1.33 | 13d | 42 | 1.15mi |
| 1008 Eaglecrest Ct Harrisburg, PA | 1.0–2.0 | 1.0 | 779 | $1,485 | $1.91 | 13d | 33 | 1.20mi |
| 2679 Alessandro Blvd Harrisburg, PA | 2.0–3.0 | 1.5 | 1217 | $1,662 | $1.37 | 13d | 4 | 1.41mi |
| 2711 Walnut St Unit 1 Penbrook, PA | 1.0 | 1.0 | 700 | $1,099 | $1.57 | 23d | 1 | 1.50mi |
Listing history 20 events
-
2026-06-18days on market $165,000 Active 92 DOM
-
2026-06-17days on market $165,000 Active 91 DOM
-
2026-06-16days on market $165,000 Active 90 DOM
-
2026-06-15days on market $165,000 Active 89 DOM
-
2026-06-14days on market $165,000 Active 87 DOM
-
2026-06-13days on market $165,000 Active 86 DOM
-
2026-06-10days on market $165,000 Active 84 DOM
-
2026-06-09days on market $165,000 Active 83 DOM
-
2026-06-08days on market $165,000 Active 82 DOM
-
2026-06-07days on market $165,000 Active 81 DOM
-
2026-06-05days on market $165,000 Active 78 DOM
-
2026-06-03days on market $165,000 Active 77 DOM
-
2026-06-02days on market $165,000 Active 76 DOM
-
2026-06-01days on market $165,000 Active 75 DOM
-
2026-05-31days on market $165,000 Active 74 DOM
-
2026-05-31days on market $165,000 Active 73 DOM
-
2026-03-19$165,000 Active 667-char remark
Show marketing remark (667 chars)
Looking for a 3-bed ranch home in Lower Paxton Township with one-level living, a partially finished basement, and off-street parking? 3993 Rauch St offers 3 bedrooms, 1 bath, approximately 1,000 sq ft, and a 6,599 sq ft lot in the Central Dauphin School District, Lower Paxton Township. Built in 1951, the property includes forced air heat, air conditioning, in-unit laundry, washer and dryer, and off-street parking. Convenient Harrisburg location with access to shopping, dining, and major commuter routes. * * * Currently tenant occupied with property management in place. Can be purchased with individually or with up to 3 other properties in portfolio. * * *
-
2026-03-15historical $165,000 667-char remark
Show marketing remark (667 chars)
Looking for a 3-bed ranch home in Lower Paxton Township with one-level living, a partially finished basement, and off-street parking? 3993 Rauch St offers 3 bedrooms, 1 bath, approximately 1,000 sq ft, and a 6,599 sq ft lot in the Central Dauphin School District, Lower Paxton Township. Built in 1951, the property includes forced air heat, air conditioning, in-unit laundry, washer and dryer, and off-street parking. Convenient Harrisburg location with access to shopping, dining, and major commuter routes. * * * Currently tenant occupied with property management in place. Can be purchased with individually or with up to 3 other properties in portfolio. * * *
-
1998-10-20soldstatus $65,500
-
1986-06-30soldstatus $54,900
ⓘ Source: listings_history table (triggers on properties + properties_extension) + one-shot
backfill from property_details.listing_events for pre-trigger history.
Tax reassessment forecast PA · Partial reset (capped growth)
- Current annual tax
- $2,291 · $191/mo
- Projected year-2 tax
- $2,449 · $204/mo
- Expected delta
- +$158/yr (+$13/mo · 6.9%)
ⓘ Screening estimate from a state-policy table — verify with the county assessor before closing.
Climate risk First Street
- Flood 1/10 Low FEMA zone X (unshaded) · 0% chance over 30 yrs
- Wildfire 1/10 Low
- Heat 5/10 Major 7 d/yr ≥100°F today · 15 d/yr by 30 yrs out
- Wind 3/10 Moderate 5% chance of damaging wind over 30 yrs
- Air quality 3/10 Moderate 2 unhealthy d/yr today · 4 by 30 yrs out
Nearby sold comps map
Loading sold comps map…
Walkable amenities ~0.75 mi
Loading nearby amenities…
Taxation est. · year 1
- Rental income
- $16,630
- − Mortgage interest
- −$9,243
- − Property taxes
- −$2,291
- − Insurance
- −$825
- − Repairs & maintenance
- −$1,330
- − Management
- −$1,330
- − Depreciation
- −$4,800
- Taxable loss
- −$3,190
- Est. tax savings @ 24.0%
- +$766
- After-tax cash flow
- $404/yr
For passive investors: Depreciation is non-cash, so a rental often shows a tax loss while cash-flowing — sheltering income. Rental losses are passive: they offset passive income freely, and up to $25,000/yr can offset ordinary (W-2) income if you actively participate and your MAGI is under $100k (phasing out to $0 by $150k); unused losses carry forward. On sale, claimed depreciation is recaptured at up to 25%, and gains may owe capital-gains tax (a 1031 exchange can defer both). Figures are a year-1 estimate at your 24.0% rate — not tax advice; consult a CPA.
Schools (NCES district)
- District
- Central Dauphin SD
- NCES district ID
- 4205400
- Math proficiency
- 30% ▼ -12.00%
- Reading proficiency
- 52% ▼ -7.00%
- Median HH income
- $62,792
- Composite
- 36.46/100
- National rank
- #4664
- State rank
- #305 of 539 in PA
Livability — Lower Paxton
No livability data for this city. (Only ~50 U.S. cities are tracked.)
Census & demographics
- Census place
- Progress, PA
- County
- Dauphin County · 247,857 people
- Metro
- Harrisburg-Carlisle, PA
- Population (ZIP)
- 27,466
- Household income
- $71,833
- Rent vs Own
- Severe rent burden
- 1266.0
Population outlook (Dauphin County) Hauer SSP2
- Today (2025)
- 281,628 people
- By 2030
- 283,549 · +0.7%
- By 2040
- 285,385 · +1.3%
- By 2050
- 286,188 · +1.6%
- By 2075
- 291,053 · +3.3%
- By 2100
- 282,374 · +0.3%
Race, ethnicity, and origin ACS 2023
- Neighborhood character
- Diverse neighborhood (Simpson 0.70)
- Race & ethnicity
- White 47% Black 23% Hispanic / Latino 13% Asian 11% Two or more races 11%
- Hispanic origin (detail)
- Mexican 2% Puerto Rican 5% Dominican 2%
- Common ancestry
- Romanian 2% Lithuanian 1% Polish 1%
- Foreign-born
- 17% · India, Vietnam, Canada
- Languages at home
- 81% English-only · Other Indo-European 5% Spanish 5% Vietnamese 2%
Political lean MEDSL · Dauphin
- 2024 margin
- Lean D (+5.9) · D 52.4% · R 46.5% · Other 1.1%
- 2008→2024 swing
- -3.1pp toward R · 2008: 9.1pp · 2024: 5.9pp
- All cycles
- 2024: D+5.9 2020: D+8.5 2016: D+2.8 2012: D+6.0 2008: D+9.1
Not yet ingested
- Civics
- —
Market trends
- HPI YoY
- ▼ -144.02%
- Current HPI
- 253.77
- Rent YoY
- ▲ 5.37%
- Metro
- Harrisburg-Carlisle, PA
- State GDP YoY
- ▲ 1.68%
- F500 in state
- 34
Industry mix (Fortune 500 HQ in PA)
| Industry | F500 HQs | Revenue |
|---|---|---|
| Healthcare | 2 | $309B |
|
||
| Insurance | 2 | $27B |
|
||
| Telecommunications / Media | 1 | $124B |
|
||
| Industrial Distribution | 1 | $22B |
|
||
| Financial Services | 1 | $20B |
|
||
| Chemicals / Materials | 1 | $18B |
|
||
Price history
+200.5% since first listed4 events — show timeline
- 2026-03-19 Listed $165,000 BRIGHT MLS
- 2026-03-15 Coming Soon $165,000 BRIGHT MLS
- 1998-10-20 Sold (Public Records) $65,500 Public Records
- 1986-06-30 Sold (Public Records) $54,900 Public Records
Property tax history
+2.4%/yrLatest (2026): $2,291 · +5.7% YoY. Source: county tax records.
Cash-flow waterfall
monthlySold comps — $/sqft
last 12 mo · ≤1 miLoading sold comps…