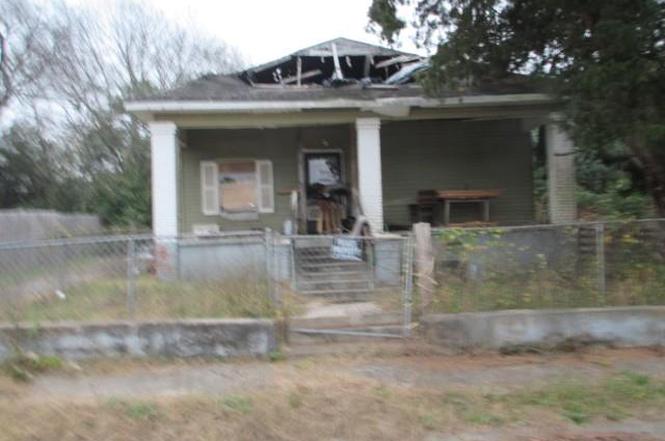
1902 11th Ct · Phenix City, AL
Flood risk 1/10 · Minimal
- FEMA flood zone
- X (unshaded)
- Chance of flooding over 30 yrs
- 0.0%
- Est. flood insurance / yr
- $507 – $1,088
Fire risk 1/10 · Minimal
- Est. fire insurance / yr
- $916 – $1,700
Heat risk 7/10 · Major
- Hot days now (above 107°F)
- 7 days/yr
- Hot days in 30 yrs
- 19 days/yr
Wind risk 6/10 · Moderate
- Chance of severe wind over 30 yrs
- 76.0%
Air-quality risk 5/10 · Moderate
- Unhealthy air days now
- 7 days/yr
- Unhealthy air days in 30 yrs
- 8 days/yr
Risk factors via First Street. Map © Google.
Why this score? — see what drove the D grade
The composite is a weighted blend of 9 inputs, each scored 0–100. Each bar is that input's sub-score; the figure is the points it added to the 100-point composite (weight × sub-score).
- Cash flow +15.0/30.0
- ARV discount +7.5/15.0
- 1% rule +5.0/10.0
- DSCR +5.0/10.0
- Rent growth +3.8/5.0
- Livability +3.0/5.0
- Schools +2.7/10.0
- Condition / age +2.5/5.0
- Appreciation +0.0/10.0
$19,900
🖨 Deal sheet 📄 Offer letter ✓ Due diligence
Listing remarks MLS
This property has lots of potential for buyers, investors, and flippers. Buit in 1930 with 1076 Square Feet, Large Covered Front Porch, Fenced Front and Back yard, Backyard with lots of Space. Property can be remodeled or torn down and build your own home. All offers must be submitted on Res.net. All buyers must sign a hold harmless agreement prior to entering the property.
Key facts
- 5,663 sq ft lot
- Parking
- Built 1930
Tags
Neighborhood map
What this means for you Summary
Snapshot
- This is a 2-bed/1.0-bath single-family listed at $20k.
Deal economics
- At list price, monthly cash flow is $927 ($11k/yr) — positive.
- The deal already cash-flows at list — no discount required.
- Meets the 1% rule at list price ($1k rent vs $20k).
- Recommended offer: $19k (6.0% below list) — sets the bar for market timing.
- Cap rate 62.2% vs local median 5.0% in Phenix City — top-decile yield for the area; either an underpriced asset or a hidden risk that comps aren't pricing in. Stress-test before assuming the spread holds.
Location & tenants
- Location reads 60/100 on livability (#297 in AL) — a middle-class / working-renter tenant base. Strengths: cost of living A+, housing A+; Watch: schools D+, crime F, amenities F.
- Phenix City (suburban): math 22% / reading 44% proficiency, ranked #59 of 129 in AL (top 46%) — families likely to look elsewhere, expect single-tenant / working-renter base with shorter leases; 64% free/reduced lunch — lower-income household profile, screen leases tightly.
- Market conditions: Rents rising fast (+5.3%/yr); 217 active listings in the ZIP; 4 comparable units currently listed for rent nearby; rentals at typical pace (median 21d on market — plan ~3-4 weeks tenant-placement turnaround); 183 units permitted in Russell County in 2024 (0 in 5+ unit buildings).
- This rent runs 34% of the median local income ($48k/yr) — at the standard rent-burdened threshold; future hikes will face affordability resistance.
Forward outlook
- Local home prices are declining (-3.0%/yr); year-one equity from $138 of loan paydown is wiped out by about $597 of value loss. Plan a longer hold.
- Russell County population projected at +42% by 2050 — long-run rental-demand tailwind backs the buy-and-hold thesis.
- At projected returns (-3.0% appreciation + 5.3% rent growth), your $6k cash investment doubles in ~1 year — after that, you're playing with house money.
Negotiation context
- It's been on market 87 days — a 6% lower offer ($19k) is reasonable based on typical stale-listing flexibility.
- 2 sale attempts with the ask held roughly flat each time — persistent listings suggest the price (not the market) is what's stuck; bring a comps-based counter.
Risks & watch-outs
- Watch-outs: built in 1930 — expect roof / HVAC / electrical / plumbing capex.
- Climate carrying-cost: major wind risk, 76% chance of damaging wind over 30y; extreme-heat days projected 7→19/yr by 2055 (HVAC capex compounding) — expect insurance premiums to compound above CPI over the hold.
Questions for the listing agent
- It's been on market 87 days. Have you received any prior offers? Is the seller open to a 6% concession, seller financing, or rate buy-down credit?
- Built in 1930 — when were the roof, HVAC, electrical panel, plumbing, and water heater last replaced?
- Why hasn't it sold? Are there any deal-killer items the seller is aware of (foundation, flood, title, zoning, code violations)?
- Is there a deadline driving the sale (1031 exchange, divorce, estate, relocation)? That informs how much negotiation room exists.
- Schools are D-rated, which usually means shorter tenancies and higher turnover. Who's the typical renter profile here, and what's been the actual vacancy rate?
- Crime grade is F in this area — have there been break-ins, vandalism, or insurance claims at this property in the last 3 years? What carrier currently insures it and at what premium?
- The area grade is low — what's the realistic commute time and amenity access for the typical tenant pool here? Any planned neighborhood developments (good or bad) we should know about?
- What's the average days-on-market for RENTAL listings here right now (not sales)? A rising rental-DOM trend means longer vacancies and softer asking-rent achievability than the comps imply.
- What's the recent tenant-quality profile in this submarket — average credit score on applications, eviction rate, late-payment / NSF rate, and stable-employment percentage? A property-management company in the area should have these aggregated.
- How much new for-sale + rental construction is in the pipeline within 1–3 miles? Heavy new supply typically softens prices + rents 12–24 months out; constrained supply supports both.
Investment metrics
- 1% rule
- 6.78% ✓
- Cap rate
- 62.19%
- Cash-on-cash
- 199.62%
- DSCR
- 9.88
- GRM
- 1.2
CMA / ARV
- ARV (on-the-fly)
- $109,752
- Comps found
- 12
Show comp detail 12 sales within ~0.75 mi
| Address | Dist | Beds/Ba | Sqft | Sold | Price | $/sf | Match |
|---|---|---|---|---|---|---|---|
| 1208 20th st St | 0.15mi | 3/1.0 (+1) | 1,040 (-3%) | 3mo | $50,800 | $49 | 80 |
| 1309 12th Pl | 0.62mi | 2/1.0 | 1,086 (+1%) | 1mo | $114,000 | $105 | 69 |
| 2002 6th Ave | 0.51mi | 2/1.0 | 1,024 (-5%) | 2mo | $32,500 | $32 | 66 |
| 604 20th St | 0.47mi | 3/1.0 (+1) | 1,094 (+2%) | 9mo | $58,000 | $53 | 63 |
| 804 N Railroad St St | 0.31mi | 2/2.0 | 938 (-13%) | 3mo | $64,000 | $68 | 58 |
| 923 16th St | 0.28mi | 2/1.0 | 1,224 (+14%) | 9mo | $20,000 | $16 | 56 |
| 1702 23rd Pl | 0.65mi | 3/2.0 (+1) | 1,100 (+2%) | 1mo | $165,000 | $150 | 56 |
| 1704 18th St | 0.54mi | 3/1.0 (+1) | 980 (-9%) | 3mo | $100,000 | $102 | 53 |
| 1713 19th Ave | 0.70mi | 3/1.0 (+1) | 1,121 (+4%) | 5mo | $130,000 | $116 | 52 |
| 1704 18th Ave | 0.53mi | 2/1.5 | 1,191 (+11%) | 5mo | $132,000 | $111 | 51 |
| 703 22nd St | 0.45mi | 2/2.0 | 1,188 (+10%) | 9mo | $145,000 | $122 | 50 |
| 1506 14th Ct | 0.34mi | 3/1.0 (+1) | 916 (-15%) | 9mo | $63,000 | $69 | 47 |
Match score weights: distance 35% · size 25% · config 20% · recency 20%. Top-matched comps best support the ARV.
Projected returns pro-forma
-3.0% appreciation · 5.33% rent growth · sell at horizon
- IRR
- —
- Equity multiple
- 11.60×
- Total profit
- $59,071
- Equity at exit
- $2,967
- IRR
- —
- Equity multiple
- 26.39×
- Total profit
- $141,481
- Equity at exit
- $1,721
Cash invested: $5,572 (down + closing). Projections, not guarantees.
Landlord ↔ Tenant lean methodology
- Overall (STATE)
- 90 Strongly Landlord-Friendly
- State Alabama
- 90 Strongly Landlord-Friendly · R+15
- County
- — inherits STATE
- City
- — inherits STATE
ZIP-level market 36867
- Home prices YoY
- -30.1%
- Rents YoY
- 5.3%
- Active inventory
- 217
- Price-to-rent
- 1.2×
Monthly cashflow live
- Estimated rent
- $1,350 medium interval (Pro) →
- Mortgage (P&I)
- −$104
- Tax from tax record
- −$27 /mo · $323/yr
- Insurance
- −$8
- HOA
- −$0
- Vacancy / Maint / Mgmt
- −$284
- Net cashflow
- $927
Break-even live
UW: 25.0% down · 7.5% · 30yr · 1.5% tax · 5.0% vac · 8.0% maint · 8.0% mgmt
Financing live
Cash to close
- Down payment
- $4,975
- Closing costs
- $597
- Reserves months
- —
- Total cash needed
- —
Loan-product check · same deal, 3 products live
Conventional
25% down · 7.5% · 30yr
- Down + closing
- —
- Monthly P&I
- —
- Monthly cashflow
- —
- DSCR
- —
- Eligible?
- —
Personal DTI + credit; lowest rate.
DSCR
20% down · 8.5% · 30yr
- Down + closing
- —
- Monthly P&I
- —
- Monthly cashflow
- —
- DSCR
- —
- Eligible?
- —
No personal income docs; deal must DSCR.
Hard money
10% down · 12.0% · 12mo
- Down + closing
- —
- Monthly P&I
- —
- Monthly cashflow
- —
- DSCR
- —
- Eligible?
- —
Short-term bridge; refi at stabilization.
Rent comps 4 comps
| Address | Beds | Baths | Sqft | Rent | $/sqft | DOM | Units | Dist |
|---|---|---|---|---|---|---|---|---|
| 2108 9th Ave Phenix City, AL | 3.0 | 1.0 | 1040 | $1,150 | $1.11 | 21d | 1 | 0.35mi |
| 1346 Ingersoll Dr Phenix City, AL | 3.0 | 2.0 | 1453 | $1,700 | $1.17 | 13d | 1 | 0.83mi |
| 2702 N Railroad St Phenix City, AL | 2.0 | 1.0 | 768 | $1,200 | $1.56 | 21d | 1 | 1.20mi |
| 1106 Broadway Unit 1106C Columbus, GA | 1.0 | 1.0 | 930 | $1,600 | $1.72 | 13d | 1 | 1.26mi |
Listing history 5 events
-
2026-04-20status Pending
-
2026-03-24status Pending 376-char remark
Show marketing remark (376 chars)
This property has lots of potential for buyers, investors, and flippers. Buit in 1930 with 1076 Square Feet, Large Covered Front Porch, Fenced Front and Back yard, Backyard with lots of Space. Property can be remodeled or torn down and build your own home. All offers must be submitted on Res.net. All buyers must sign a hold harmless agreement prior to entering the property.
-
2026-01-22$19,900 Active
Show marketing remark (376 chars)
This property has lots of potential for buyers, investors, and flippers. Buit in 1930 with 1076 Square Feet, Large Covered Front Porch, Fenced Front and Back yard, Backyard with lots of Space. Property can be remodeled or torn down and build your own home. All offers must be submitted on Res.net. All buyers must sign a hold harmless agreement prior to entering the property.
-
2026-01-22$19,900 Active 376-char remark
Show marketing remark (376 chars)
This property has lots of potential for buyers, investors, and flippers. Buit in 1930 with 1076 Square Feet, Large Covered Front Porch, Fenced Front and Back yard, Backyard with lots of Space. Property can be remodeled or torn down and build your own home. All offers must be submitted on Res.net. All buyers must sign a hold harmless agreement prior to entering the property.
-
1985-10-17soldstatus $25,308
ⓘ Source: listings_history table (triggers on properties + properties_extension) + one-shot
backfill from property_details.listing_events for pre-trigger history.
Tax reassessment forecast AL · Resets to sale price
- Current annual tax
- $323 · $27/mo
- Projected year-2 tax
- $323 · $27/mo
- Expected delta
- $0/yr ($0/mo · 0.0%)
ⓘ Screening estimate from a state-policy table — verify with the county assessor before closing.
Climate risk First Street
- Flood 1/10 Low FEMA zone X (unshaded) · 0% chance over 30 yrs
- Wildfire 1/10 Low
- Heat 7/10 Severe 7 d/yr ≥107°F today · 19 d/yr by 30 yrs out
- Wind 6/10 Major 76% chance of damaging wind over 30 yrs
- Air quality 5/10 Major 7 unhealthy d/yr today · 8 by 30 yrs out
Nearby sold comps map
Loading sold comps map…
Walkable amenities ~0.75 mi
Loading nearby amenities…
Taxation est. · year 1
- Rental income
- $16,200
- − Mortgage interest
- −$1,115
- − Property taxes
- −$323
- − Insurance
- −$100
- − Repairs & maintenance
- −$1,296
- − Management
- −$1,296
- − Depreciation
- −$579
- Taxable income
- $11,492
- Est. tax owed @ 24.0%
- −$2,758
- After-tax cash flow
- $8,365/yr
For passive investors: Depreciation is non-cash, so a rental often shows a tax loss while cash-flowing — sheltering income. Rental losses are passive: they offset passive income freely, and up to $25,000/yr can offset ordinary (W-2) income if you actively participate and your MAGI is under $100k (phasing out to $0 by $150k); unused losses carry forward. On sale, claimed depreciation is recaptured at up to 25%, and gains may owe capital-gains tax (a 1031 exchange can defer both). Figures are a year-1 estimate at your 24.0% rate — not tax advice; consult a CPA.
Schools (NCES district)
- District
- Phenix City
- NCES district ID
- 0102700
- Math proficiency
- 22% ▼ -24.00%
- Reading proficiency
- 44% ▼ -1.00%
- Median HH income
- $36,228
- Composite
- 27.29/100
- National rank
- #7001
- State rank
- #59 of 129 in AL
Livability — Phenix City
- Score
- 60/100
- State rank
- #297
- US rank
- #19037
Category grades
Schools grade is shown separately in the Schools card above.
Census & demographics
- Census place
- Phenix City, AL
- County
- Russell County · 53,055 people
- City population
- 62,290
- Metro
- Columbus, GA-AL
- Population (ZIP)
- 22,821
- Household income
- $48,026
- Rent vs Own
- Severe rent burden
- 1399.0
Population outlook (Russell County) Hauer SSP2
- Today (2025)
- 70,137 people
- By 2030
- 75,826 · +8.1%
- By 2040
- 87,858 · +25.3%
- By 2050
- 99,721 · +42.2%
- By 2075
- 128,009 · +82.5%
- By 2100
- 149,251 · +112.8%
Race, ethnicity, and origin ACS 2023
- Neighborhood character
- Diverse neighborhood (Simpson 0.60)
- Race & ethnicity
- White 53% Black 34% Hispanic / Latino 7% Two or more races 7% Asian 2%
- Hispanic origin (detail)
- Mexican 1% Puerto Rican 2% Cuban 2%
- Common ancestry
- Romanian 2% Italian 2% Slovak 1%
- Foreign-born
- 4% · Canada, China, South Korea
- Languages at home
- 94% English-only · Spanish 4% Tagalog/Filipino 1%
Political lean MEDSL · Russell
- 2024 margin
- Toss-up / Even · D 50.4% · R 48.7%
- 2008→2024 swing
- -5.6pp toward R · 2008: 7.3pp · 2024: 1.7pp
- All cycles
- 2024: D+1.7 2020: D+6.4 2016: D+1.9 2012: D+11.8 2008: D+7.3
Not yet ingested
- Civics
- —
Market trends
- HPI YoY
- ▼ -74.10%
- Current HPI
- 171.8426
- Rent YoY
- ▲ 5.33%
- Metro
- Columbus, GA-AL
- State GDP YoY
- ▲ 2.94%
- F500 in state
- 4
Industry mix (Fortune 500 HQ in AL)
| Industry | F500 HQs | Revenue |
|---|---|---|
| Financial Services | 1 | $8B |
|
||
| Healthcare | 1 | $5B |
|
||
Price history
-21.4% since first listed5 events — show timeline
- 2026-04-20 Pending — EABOR
- 2026-03-24 Pending — CBOR
- 2026-01-22 Listed $19,900 CBOR
- 2026-01-22 Listed $19,900 EABOR
- 1985-10-17 Sold (Public Records) $25,308 Public Records
Property tax history
+0.8%/yrLatest (2025): $323 · +4.2% YoY. Source: county tax records.
Cash-flow waterfall
monthlySold comps — $/sqft
last 12 mo · ≤1 miLoading sold comps…