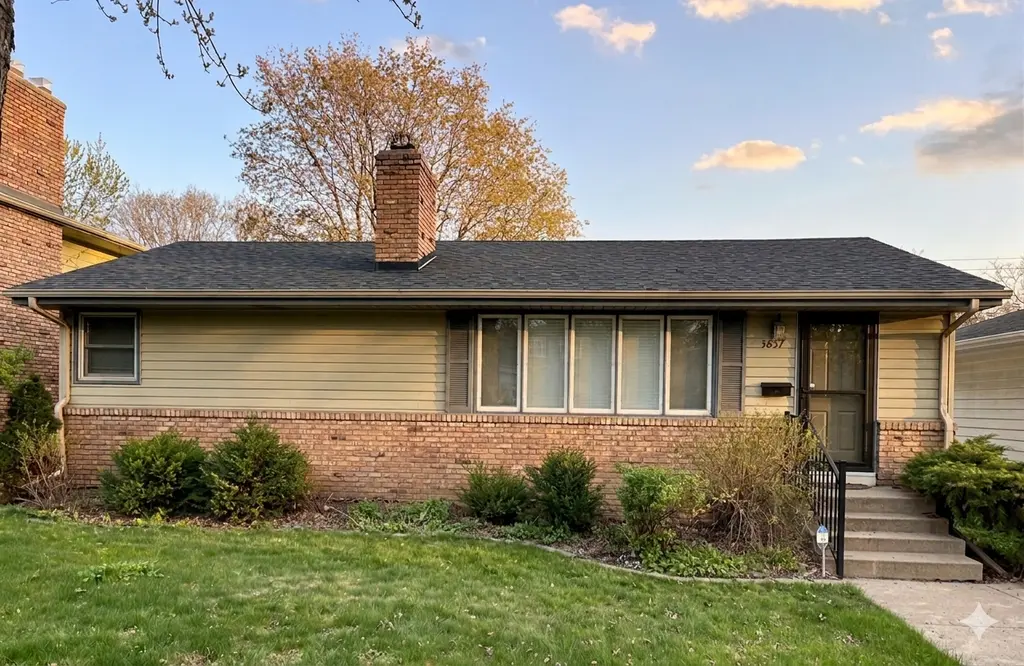
3837 France Ave S · Minneapolis, MN
Flood risk 1/10 · Minimal
- FEMA flood zone
- X (unshaded)
- Chance of flooding over 30 yrs
- 0.0%
- Est. flood insurance / yr
- $473 – $860
Fire risk 1/10 · Minimal
- Est. fire insurance / yr
- $888 – $1,650
Heat risk 2/10 · Minimal
- Hot days now (above 98°F)
- 7 days/yr
- Hot days in 30 yrs
- 14 days/yr
Wind risk 2/10 · Minimal
- Chance of severe wind over 30 yrs
- —
Air-quality risk 2/10 · Minimal
- Unhealthy air days now
- 1 days/yr
- Unhealthy air days in 30 yrs
- 1 days/yr
Risk factors via First Street. Map © Google.
Why this score? — see what drove the C grade
The composite is a weighted blend of 9 inputs, each scored 0–100. Each bar is that input's sub-score; the figure is the points it added to the 100-point composite (weight × sub-score).
- Cash flow +19.3/30.0
- ARV discount +14.9/15.0
- DSCR +6.1/10.0
- 1% rule +5.0/10.0
- Livability +3.9/5.0
- Schools +3.5/10.0
- Rent growth +3.1/5.0
- Condition / age +2.5/5.0
- Appreciation +0.0/10.0
$499,900
🖨 Deal sheet 📄 Offer letter ✓ Due diligence
Listing remarks MLS
Pristine mid-century charmer located in a fantastic Linden Hills neighborhood. Quality built with charming architectural details, featuring a large living room with an abundance of natural light and a fireplace. Tastefully remodeled kitchen with plenty of counter space, granite counters and stainless appliances. Spacious lower level family room with a fireplace. The lower level would be perfect for an in-law suite, including a bedroom, ¾ bathroom and an office, the possibilities are endless. Private fenced yard with a patio and a pool makes this home complete. Located in a high demand area, close to the lakes, 50th & France and freeway access. This home is a must see!
Key facts
- 6,534 sq ft lot
- Garage
- Built 1957
Property features AI
Exterior
- Parking: Detached or attached garage with electric opener; 1-car garage
- Utilities: City water (connected); City sewer (connected); Natural gas
- Home design: Residential property; One-level design with lower level/finished basement; Entry level/main living on one level
- Construction: Frame construction; Asphalt pitched roof; Foundation: other
- Exterior features: Stone, metal and vinyl exterior accents; Wood fencing; Deck and rear porch; Curb and sidewalk frontage; Publicly maintained road access
Interior
- Kitchen: Kitchen with window; Dishwasher; Range; Microwave; Refrigerator; Stainless steel appliances
- Bedrooms: 4 bedrooms total — three main level bedrooms and one lower level bedroom
- Bathrooms: One full bathroom on the main floor; One three-quarter bathroom in the basement
- Heating & cooling: Forced air heating; Central air conditioning
- Interior features: Finished full basement; Natural woodwork; Informal dining area; Deck and rear porch; 3 bedrooms on one level (main floor primary bedroom); Two decorative brick fireplaces
- Laundry & utility: Washer and dryer (washer/dryer hookup); Laundry sink in lower level
Neighborhood map
What this means for you Summary
Snapshot
- This is a 4-bed/2.0-bath single-family listed at $500k.
Deal economics
- At list price, monthly cash flow is $547 ($7k/yr) — positive.
- The deal already cash-flows at list — no discount required.
- To meet the 1% rule (rent ≥ 1% of price), the offer needs to be $498k (0.4% below list).
- Recommended offer: $492k (1.5% below list) — sets the bar for market timing.
- Cap rate 7.6% vs local median 3.1% in Minneapolis — top-decile yield for the area; either an underpriced asset or a hidden risk that comps aren't pricing in. Stress-test before assuming the spread holds.
Location & tenants
- Location reads 78/100 on livability (#110 in MN, #2,525 nationally) — a middle-class / working-renter tenant base. Strengths: amenities A+, commute A+, housing A+; Watch: cost of living C-, crime F.
- Minneapolis Public School District (urban): math 35% / reading 46% proficiency, ranked #217 of 301 in MN (top 72%) — families likely to look elsewhere, expect single-tenant / working-renter base with shorter leases.
- Market conditions: Rents rising (+2.3%/yr); 205 active listings in the ZIP; 9 comparable units currently listed for rent nearby; rentals at typical pace (median 18d on market — plan ~3-4 weeks tenant-placement turnaround); solid renter incomes; 4,651 units permitted in Hennepin County in 2024 (2,443 in 5+ unit buildings).
- At $4,980/mo this rent would consume 56% of the median local household income ($106k/yr) (locally 1213% of renters already pay >50% of income on rent) — very limited rent-growth headroom before tenants either downsize or default.
Forward outlook
- Local home prices are declining (-3.0%/yr); year-one equity from $3k of loan paydown is wiped out by about $15k of value loss. Plan a longer hold.
- Hennepin County population projected at +30% by 2050 — long-run rental-demand tailwind backs the buy-and-hold thesis.
Negotiation context
- It's been on market 21 days — a 2% lower offer ($492k) is reasonable based on typical stale-listing flexibility.
- 4 sale attempts since 23y ago; this cycle's ask is 33% above the opening price — seller raised mid-cycle; expect resistance to lowballs.
- Current owner paid $375k; 33% above their basis — modest negotiation headroom, anchor on the comps not their cost.
Risks & watch-outs
- Watch-outs: built in 1957 — expect roof / HVAC / electrical / plumbing capex.
Questions for the listing agent
- Built in 1957 — when were the roof, HVAC, electrical panel, plumbing, and water heater last replaced?
- Is there a deadline driving the sale (1031 exchange, divorce, estate, relocation)? That informs how much negotiation room exists.
- Crime grade is F in this area — have there been break-ins, vandalism, or insurance claims at this property in the last 3 years? What carrier currently insures it and at what premium?
- What's the average days-on-market for RENTAL listings here right now (not sales)? A rising rental-DOM trend means longer vacancies and softer asking-rent achievability than the comps imply.
- What's the recent tenant-quality profile in this submarket — average credit score on applications, eviction rate, late-payment / NSF rate, and stable-employment percentage? A property-management company in the area should have these aggregated.
- How much new for-sale + rental construction is in the pipeline within 1–3 miles? Heavy new supply typically softens prices + rents 12–24 months out; constrained supply supports both.
Investment metrics
- 1% rule
- 1.00% ✗
- Cap rate
- 7.61%
- Cash-on-cash
- 4.69%
- DSCR
- 1.21
- GRM
- 8.4
CMA / ARV
- ARV (on-the-fly)
- $599,040
- Comps found
- 2
Show comp detail 2 sales within ~0.75 mi
| Address | Dist | Beds/Ba | Sqft | Sold | Price | $/sf | Match |
|---|---|---|---|---|---|---|---|
| 4320 Xerxes Ave S | 0.74mi | 4/1.0 | 1,762 (-8%) | 13mo | $420,000 | $238 | 37 |
| 4212 Washburn Ave S | 0.69mi | 4/2.0 | 2,085 (+9%) | 20mo | $650,000 | $312 | 36 |
Match score weights: distance 35% · size 25% · config 20% · recency 20%. Top-matched comps best support the ARV.
Projected returns pro-forma
-3.0% appreciation · 2.26% rent growth · sell at horizon
- IRR
- -9.8%
- Equity multiple
- 0.64×
- Total profit
- $-49,804
- Equity at exit
- $74,537
- IRR
- -1.4%
- Equity multiple
- 0.91×
- Total profit
- $-13,239
- Equity at exit
- $43,222
Cash invested: $139,972 (down + closing). Projections, not guarantees.
Landlord ↔ Tenant lean methodology
- Overall (CITY)
- 34 Tenant-Leaning
- State Minnesota
- 46 Balanced · D+2
- County
- — inherits STATE
- City Minneapolis
- 34 Tenant-Leaning · D+50
ZIP-level market 55416
- Rents YoY
- 2.3%
- Active inventory
- 205
- Price-to-rent
- 8.4×
Monthly cashflow live
- Estimated rent
- $4,980 high interval (Pro) →
- Mortgage (P&I)
- −$2,622
- Tax from tax record
- −$557 /mo · $6,686/yr
- Insurance
- −$208
- HOA
- −$0
- Vacancy / Maint / Mgmt
- −$1,046
- Net cashflow
- $547
Break-even live
UW: 25.0% down · 7.5% · 30yr · 1.5% tax · 5.0% vac · 8.0% maint · 8.0% mgmt
Financing live
Cash to close
- Down payment
- $124,975
- Closing costs
- $14,997
- Reserves months
- —
- Total cash needed
- —
Loan-product check · same deal, 3 products live
Conventional
25% down · 7.5% · 30yr
- Down + closing
- —
- Monthly P&I
- —
- Monthly cashflow
- —
- DSCR
- —
- Eligible?
- —
Personal DTI + credit; lowest rate.
DSCR
20% down · 8.5% · 30yr
- Down + closing
- —
- Monthly P&I
- —
- Monthly cashflow
- —
- DSCR
- —
- Eligible?
- —
No personal income docs; deal must DSCR.
Hard money
10% down · 12.0% · 12mo
- Down + closing
- —
- Monthly P&I
- —
- Monthly cashflow
- —
- DSCR
- —
- Eligible?
- —
Short-term bridge; refi at stabilization.
Rent comps 9 comps
| Address | Beds | Baths | Sqft | Rent | $/sqft | DOM | Units | Dist |
|---|---|---|---|---|---|---|---|---|
| 4224 Drew Ave S Unit 1520896P Minneapolis, MN | 4.0 | 3.0 | 1776 | $10,092 | $5.68 | 22d | 1 | 0.50mi |
| 3430 List Pl Minneapolis, MN | 1.0–3.0 | 1.0–2.0 | 1118 | $3,460 | $3.09 | 8d | 1 | 0.97mi |
| 4059 Vernon Ave S Unit 1 Minneapolis, MN | 4.0 | 2.0 | 1500 | $2,395 | $1.60 | 44d | 1 | 1.04mi |
| 4061 Vernon Ave S St Louis Park, MN | 4.0 | 2.0 | 1500 | $2,295 | $1.53 | 18d | 1 | 1.05mi |
| 4061 Vernon Ave S Unit 4061 St Louis Park, MN | 4.0 | 2.0 | 1500 | $2,395 | $1.60 | 44d | 1 | 1.05mi |
| 2921 Sunset Blvd Minneapolis, MN | 4.0 | 2.0 | 2500 | $3,000 | $1.20 | 44d | 1 | 1.10mi |
| 3118 W Lake St Minneapolis, MN | 3.0 | 1.0–2.0 | 1005 | $3,327 | $3.31 | 2d | 15 | 1.23mi |
| 5855 Highway 7 Minneapolis, MN | 3.0 | 1.0–2.0 | 991 | $3,305 | $3.34 | 2d | 40 | 1.27mi |
| 2900 Thomas Ave S Minneapolis, MN | 4.0 | 1.0–3.0 | 1933 | $7,277 | $3.76 | 2d | 47 | 1.41mi |
Listing history 29 events
-
2026-06-18days on market $499,900 Active 21 DOM
-
2026-06-17days on market $499,900 Active 20 DOM
-
2026-06-16days on market $499,900 Active 19 DOM
-
2026-06-15days on market $499,900 Active 18 DOM
-
2026-06-13pricedays on market $499,900 Active 16 DOM
-
2026-06-09days on market $505,000 Active 12 DOM
-
2026-06-08days on market $505,000 Active 11 DOM
-
2026-06-07pricedays on market $505,000 Active 10 DOM
-
2026-06-04days on market $515,000 Active 7 DOM
-
2026-06-03days on market $515,000 Active 6 DOM
-
2026-06-02days on market $515,000 Active 5 DOM
-
2026-06-01days on market $515,000 Active 4 DOM
-
2026-05-31days on market $515,000 Active 3 DOM
-
2026-05-22historical $515,000
-
2020-12-16soldstatus $375,000
-
2020-11-06soldstatus $375,000 Sold 694-char remark
Show marketing remark (694 chars)
Pristine mid-century charmer located in a fantastic Linden Hills neighborhood. Quality built with charming architectural details, featuring a large living room with an abundance of natural light and a fireplace. Tastefully remodeled kitchen with plenty of counter space, granite counters and stainless appliances. Spacious lower level family room with a fireplace. The lower level would be perfect for an in-law suite, including a bedroom, ¾ bathroom and an office, the possibilities are endless. Private fenced yard with a patio and a pool makes this home complete. Located in a high demand area, close to the lakes, 50th & France and freeway access. This home is a must see!
-
2020-09-21historical Contingent - Inspection 694-char remark
Show marketing remark (694 chars)
Pristine mid-century charmer located in a fantastic Linden Hills neighborhood. Quality built with charming architectural details, featuring a large living room with an abundance of natural light and a fireplace. Tastefully remodeled kitchen with plenty of counter space, granite counters and stainless appliances. Spacious lower level family room with a fireplace. The lower level would be perfect for an in-law suite, including a bedroom, ¾ bathroom and an office, the possibilities are endless. Private fenced yard with a patio and a pool makes this home complete. Located in a high demand area, close to the lakes, 50th & France and freeway access. This home is a must see!
-
2020-09-17$375,000 Active 694-char remark
Show marketing remark (694 chars)
Pristine mid-century charmer located in a fantastic Linden Hills neighborhood. Quality built with charming architectural details, featuring a large living room with an abundance of natural light and a fireplace. Tastefully remodeled kitchen with plenty of counter space, granite counters and stainless appliances. Spacious lower level family room with a fireplace. The lower level would be perfect for an in-law suite, including a bedroom, ¾ bathroom and an office, the possibilities are endless. Private fenced yard with a patio and a pool makes this home complete. Located in a high demand area, close to the lakes, 50th & France and freeway access. This home is a must see!
-
2019-07-11soldstatus $325,000
-
2010-05-03historical
-
2010-02-11$279,850
-
2010-01-13historical
-
2009-07-29$315,000
-
2003-08-19soldstatus $225,900
-
2003-07-29soldstatus $225,900
-
2003-06-04historical
-
2003-05-14$224,900
-
1992-01-17soldstatus $77,500
-
1988-03-01soldstatus $75,000
ⓘ Source: listings_history table (triggers on properties + properties_extension) + one-shot
backfill from property_details.listing_events for pre-trigger history.
Tax reassessment forecast MN · Partial reset (capped growth)
- Current annual tax
- $6,686 · $557/mo
- Projected year-2 tax
- $6,686 · $557/mo
- Expected delta
- $0/yr ($0/mo · 0.0%)
ⓘ Screening estimate from a state-policy table — verify with the county assessor before closing.
Climate risk First Street
- Flood 1/10 Low FEMA zone X (unshaded) · 0% chance over 30 yrs
- Wildfire 1/10 Low
- Heat 2/10 Low 7 d/yr ≥98°F today · 14 d/yr by 30 yrs out
- Wind 2/10 Low
- Air quality 2/10 Low 1 unhealthy d/yr today · 1 by 30 yrs out
Nearby sold comps map
Loading sold comps map…
Walkable amenities ~0.75 mi
Loading nearby amenities…
Taxation est. · year 1
- Rental income
- $59,759
- − Mortgage interest
- −$28,002
- − Property taxes
- −$6,686
- − Insurance
- −$2,500
- − Repairs & maintenance
- −$4,781
- − Management
- −$4,781
- − Depreciation
- −$14,543
- Taxable loss
- −$1,532
- Est. tax savings @ 24.0%
- +$368
- After-tax cash flow
- $6,934/yr
For passive investors: Depreciation is non-cash, so a rental often shows a tax loss while cash-flowing — sheltering income. Rental losses are passive: they offset passive income freely, and up to $25,000/yr can offset ordinary (W-2) income if you actively participate and your MAGI is under $100k (phasing out to $0 by $150k); unused losses carry forward. On sale, claimed depreciation is recaptured at up to 25%, and gains may owe capital-gains tax (a 1031 exchange can defer both). Figures are a year-1 estimate at your 24.0% rate — not tax advice; consult a CPA.
Schools (NCES district)
- District
- Minneapolis Public School District
- NCES district ID
- 2721240
- Math proficiency
- 35% ▼ -7.00%
- Reading proficiency
- 46% ▼ -1.00%
- Median HH income
- $50,521
- Composite
- 34.92/100
- National rank
- #5067
- State rank
- #217 of 301 in MN
Livability — Minneapolis
- Score
- 78/100
- State rank
- #110
- US rank
- #2525
Category grades
Schools grade is shown separately in the Schools card above.
Census & demographics
- Census place
- Minneapolis, MN
- County
- Hennepin County · 1,150,272 people
- City population
- 417,555
- Metro
- Minneapolis-St. Paul-Bloomington, MN-WI
- Population (ZIP)
- 35,015
- Household income
- $105,958
- Rent vs Own
- Severe rent burden
- 1213.0
Population outlook (Hennepin County) Hauer SSP2
- Today (2025)
- 1,405,227 people
- By 2030
- 1,492,650 · +6.2%
- By 2040
- 1,660,157 · +18.1%
- By 2050
- 1,823,498 · +29.8%
- By 2075
- 2,221,283 · +58.1%
- By 2100
- 2,509,976 · +78.6%
Race, ethnicity, and origin ACS 2023
- Neighborhood character
- Predominantly White (79%)
- Race & ethnicity
- White 79% Two or more races 9% Hispanic / Latino 8% Black 5% Asian 4%
- Hispanic origin (detail)
- Mexican 4%
- Common ancestry
- Portuguese 12% Romanian 5% Lithuanian 4%
- Foreign-born
- 8% · Canada, China, South Korea
- Languages at home
- 89% English-only · Spanish 4% Other Indo-European 1% Other Asian/Pacific 1%
Political lean MEDSL · Hennepin
- 2024 margin
- Solid D (+42.6) · D 70.2% · R 27.5% · Other 2.3%
- 2008→2024 swing
- +14.0pp toward D · 2008: 28.6pp · 2024: 42.6pp
- All cycles
- 2024: D+42.6 2020: D+43.2 2016: D+35.3 2012: D+27.1 2008: D+28.6
Not yet ingested
- Civics
- —
Market trends
- HPI YoY
- ▼ -490.63%
- Current HPI
- 230.651
- Rent YoY
- ▲ 2.26%
- Metro
- Minneapolis-St. Paul-Bloomington, MN-WI
- State GDP YoY
- ▲ 2.41%
- F500 in state
- 34
Industry mix (Fortune 500 HQ in MN)
| Industry | F500 HQs | Revenue |
|---|---|---|
| Healthcare | 2 | $407B |
|
||
| Retail | 2 | $150B |
|
||
| Consumer Goods | 2 | $32B |
|
||
| Industrial Machinery | 2 | $6B |
|
||
| Agriculture | 1 | $40B |
|
||
| Healthcare / Medical Devices | 1 | $32B |
|
||
Price history
+586.7% since first listed16 events — show timeline
- 2026-05-22 Coming Soon $515,000 NORTHSTARMLS as Distributed by MLS Grid
- 2020-12-16 Sold (Public Records) $375,000 Public Records
- 2020-11-06 Sold (MLS) $375,000 NORTHSTARMLS as Distributed by MLS Grid
- 2020-09-21 Contingent — NORTHSTARMLS as Distributed by MLS Grid
- 2020-09-17 Listed $375,000 NORTHSTARMLS as Distributed by MLS Grid
- 2019-07-11 Sold (Public Records) $325,000 Public Records
- 2010-05-03 Listing Removed — NORTHSTARMLS as Distributed by MLS Grid
- 2010-02-11 Listed $279,850 NORTHSTARMLS as Distributed by MLS Grid
- 2010-01-13 Listing Removed — NORTHSTARMLS as Distributed by MLS Grid
- 2009-07-29 Listed $315,000 NORTHSTARMLS as Distributed by MLS Grid
- 2003-08-19 Sold (Public Records) $225,900 Public Records
- 2003-07-29 Sold (MLS) $225,900 NORTHSTARMLS as Distributed by MLS Grid
- 2003-06-04 Listing Removed — NORTHSTARMLS as Distributed by MLS Grid
- 2003-05-14 Listed $224,900 NORTHSTARMLS as Distributed by MLS Grid
- 1992-01-17 Sold (Public Records) $77,500 Public Records
- 1988-03-01 Sold (Public Records) $75,000 Public Records
Property tax history
+3.1%/yrLatest (2025): $6,686 · +18.3% YoY. Source: county tax records.
Cash-flow waterfall
monthlySold comps — $/sqft
last 12 mo · ≤1 miLoading sold comps…