 🏷️ Likely Rental
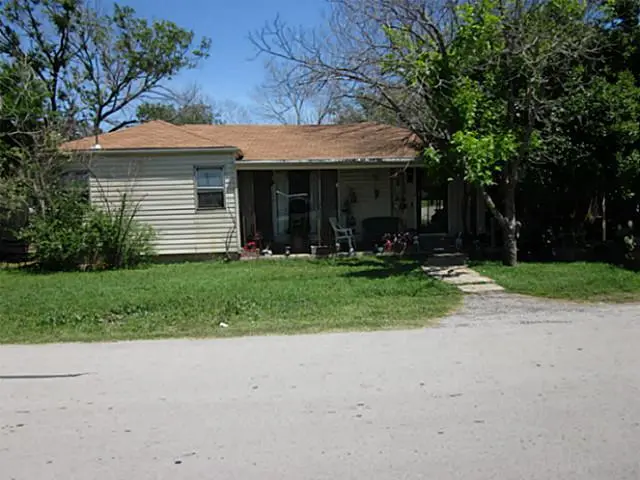
412 Crestview Dr · Kennedale, TX
Flood risk 1/10 · Minimal
- FEMA flood zone
- X (unshaded)
- Chance of flooding over 30 yrs
- 0.0%
- Est. flood insurance / yr
- $507 – $1,088
Fire risk 5/10 · Moderate
- Est. fire insurance / yr
- $1,222 – $2,270
Heat risk 7/10 · Major
- Hot days now (above 109°F)
- 7 days/yr
- Hot days in 30 yrs
- 24 days/yr
Wind risk 6/10 · Moderate
- Chance of severe wind over 30 yrs
- 27.0%
Air-quality risk 3/10 · Minor
- Unhealthy air days now
- 2 days/yr
- Unhealthy air days in 30 yrs
- 3 days/yr
Risk factors via First Street. Map © Google.
Why this score? — see what drove the B- grade
The composite is a weighted blend of 9 inputs, each scored 0–100. Each bar is that input's sub-score; the figure is the points it added to the 100-point composite (weight × sub-score).
- Cash flow +24.5/30.0
- ARV discount +15.0/15.0
- DSCR +7.9/10.0
- 1% rule +6.6/10.0
- Rent growth +4.0/5.0
- Livability +3.5/5.0
- Schools +3.0/10.0
- Condition / age +2.5/5.0
- Appreciation +0.0/10.0
$196,500
🖨 Deal sheet 📄 Offer letter ✓ Due diligence
Listing remarks MLS
3-2.5 older home in Downtown Kennedale. Walking distance to all that Kennedale has to offer. Opportunity for investor; leased by long time tenant.
Key facts
- 0.23 acre lot
- Built 1950
- Listed 42 days
Property features AI
Finance
- Other: Possession in 30–90 days; For sale (active listing)
- Financial info: Treat as clear loan type; No second mortgage
- HOA & community: No homeowners association
Exterior
- Parking: Driveway
- Utilities: City water; City sewer; No municipal utility district
- Home design: Single-family residence; Residential property; Built in 1950; One story
- Construction: Composition roof; No barns
- Exterior features: Lot under 0.5 acre (about 0.23 acre); Subdivision: JESSE B SURVEY ABSTRACT
Interior
- Kitchen: Other appliances
- Bedrooms: Primary bedroom on level 1 (approx. 10 x 10)
- Bathrooms: 2 full bathrooms
- Interior features: One-level layout; One living area; One dining area; Other interior features
Neighborhood map
What this means for you Summary
Snapshot
- This is a 3-bed/2.0-bath single-family listed at $196k.
Deal economics
- At list price, monthly cash flow is $403 ($5k/yr) — positive.
- The deal already cash-flows at list — no discount required.
- Meets the 1% rule at list price ($2k rent vs $196k).
- Recommended offer: $191k (3.0% below list) — sets the bar for market timing.
- Cap rate 8.8% vs local median 2.9% in Kennedale — top-decile yield for the area; either an underpriced asset or a hidden risk that comps aren't pricing in. Stress-test before assuming the spread holds.
Location & tenants
- Location reads 70/100 on livability (#340 in TX) — a middle-class / working-renter tenant base. Strengths: crime A+, employment A+, cost of living A+; Watch: amenities F, commute F, health & safety F.
- Kennedale ISD (suburban): math 27% / reading 37% proficiency, ranked #522 of 826 in TX (top 63%) — families likely to look elsewhere, expect single-tenant / working-renter base with shorter leases.
- Zoned schools: James F Delaney El (math 32% / reading 37%, grade F, #1,995 of 4,322 statewide, top 50%, 661 students, 64% FRL) — zoned schools average 64% FRL vs 38% district-wide (26 pts higher); higher-poverty schools than district average — tighter screening recommended.
- Market conditions: Rents rising fast (+6.0%/yr); 92 active listings in the ZIP; 7 comparable units currently listed for rent nearby; rentals at typical pace (median 17d on market — plan ~3-4 weeks tenant-placement turnaround); high-income renter base; 18,938 units permitted in Tarrant County in 2024 (8,336 in 5+ unit buildings).
Forward outlook
- Local home prices are declining (-3.0%/yr); year-one equity from $1k of loan paydown is wiped out by about $6k of value loss. Plan a longer hold.
- Tarrant County population projected at +41% by 2050 — long-run rental-demand tailwind backs the buy-and-hold thesis.
- At projected returns (-3.0% appreciation + 6.0% rent growth), your $55k cash investment doubles in ~9 years — after that, you're playing with house money.
Negotiation context
- It's been on market 42 days — a 3% lower offer ($191k) is reasonable based on typical stale-listing flexibility.
- 2 sale attempts since 14y ago with the ask held roughly flat each time — persistent listings suggest the price (not the market) is what's stuck; bring a comps-based counter.
Risks & watch-outs
- Watch-outs: built in 1950 — expect roof / HVAC / electrical / plumbing capex.
- Climate carrying-cost: major wind risk, 27% chance of damaging wind over 30y; moderate wildfire risk; extreme-heat days projected 7→24/yr by 2055 (HVAC capex compounding) — expect insurance premiums to compound above CPI over the hold.
Questions for the listing agent
- It's been on market 42 days. Have you received any prior offers? Is the seller open to a 3% concession, seller financing, or rate buy-down credit?
- Built in 1950 — when were the roof, HVAC, electrical panel, plumbing, and water heater last replaced?
- Is there a deadline driving the sale (1031 exchange, divorce, estate, relocation)? That informs how much negotiation room exists.
- What's the average days-on-market for RENTAL listings here right now (not sales)? A rising rental-DOM trend means longer vacancies and softer asking-rent achievability than the comps imply.
- What's the recent tenant-quality profile in this submarket — average credit score on applications, eviction rate, late-payment / NSF rate, and stable-employment percentage? A property-management company in the area should have these aggregated.
- How much new for-sale + rental construction is in the pipeline within 1–3 miles? Heavy new supply typically softens prices + rents 12–24 months out; constrained supply supports both.
Investment metrics
- 1% rule
- 1.16% ✓
- Cap rate
- 8.75%
- Cash-on-cash
- 8.79%
- DSCR
- 1.39
- GRM
- 7.2
CMA / ARV
- ARV (median comp)
- $290,898
- List price
- $196,500
- Delta
- -32.45%
- Verdict
- UNDERPRICED
- Comps
- 20 within 1.0 mi
Show comp detail 9 sales within ~0.75 mi
| Address | Dist | Beds/Ba | Sqft | Sold | Price | $/sf | Match |
|---|---|---|---|---|---|---|---|
| 601 Hilltop Ct | 0.25mi | 3/2.0 | 1,859 (+1%) | 5mo | $329,975 | $178 | 82 |
| 203 W 5th St | 0.21mi | 4/2.0 (+1) | 1,784 (-3%) | 2mo | $259,000 | $145 | 78 |
| 617 Ruth Dr | 0.30mi | 4/2.0 (+1) | 1,810 (-1%) | 12mo | $345,000 | $191 | 69 |
| 603 Ruth Dr | 0.22mi | 4/3.0 (+1) | 1,975 (+8%) | 10mo | $285,000 | $144 | 60 |
| 217 Arthur Dr | 0.45mi | 3/2.0 | 1,914 (+4%) | 15mo | $339,999 | $178 | 59 |
| 311 W 5th St | 0.28mi | 4/2.0 (+1) | 1,720 (-6%) | 18mo | $285,000 | $166 | 56 |
| 404 W 3rd St | 0.33mi | 4/2.0 (+1) | 2,067 (+13%) | 5mo | $400,000 | $194 | 54 |
| 344 Daleview Dr | 0.47mi | 3/2.0 | 2,061 (+12%) | 21mo | $345,000 | $167 | 40 |
| 325 Daleview Dr | 0.44mi | 4/2.0 (+1) | 2,015 (+10%) | 22mo | $360,500 | $179 | 39 |
Match score weights: distance 35% · size 25% · config 20% · recency 20%. Top-matched comps best support the ARV.
Projected returns pro-forma
-3.0% appreciation · 5.99% rent growth · sell at horizon
- IRR
- 0.4%
- Equity multiple
- 1.02×
- Total profit
- $947
- Equity at exit
- $29,299
- IRR
- 13.0%
- Equity multiple
- 2.18×
- Total profit
- $64,901
- Equity at exit
- $16,990
Cash invested: $55,020 (down + closing). Projections, not guarantees.
Landlord ↔ Tenant lean methodology
- Overall (STATE)
- 87 Strongly Landlord-Friendly
- State Texas
- 87 Strongly Landlord-Friendly · R+5
- County
- — inherits STATE
- City
- — inherits STATE
ZIP-level market 76060
- Home prices YoY
- -5.1%
- Rents YoY
- 6.0%
- Active inventory
- 92
- Price-to-rent
- 7.2×
Monthly cashflow live
- Estimated rent
- $2,277 high interval (Pro) →
- Mortgage (P&I)
- −$1,030
- Tax from tax record
- −$283 /mo · $3,396/yr
- Insurance
- −$82
- HOA
- −$0
- Vacancy / Maint / Mgmt
- −$478
- Net cashflow
- $403
Break-even live
UW: 25.0% down · 7.5% · 30yr · 1.5% tax · 5.0% vac · 8.0% maint · 8.0% mgmt
Financing live
Cash to close
- Down payment
- $49,125
- Closing costs
- $5,895
- Reserves months
- —
- Total cash needed
- —
Loan-product check · same deal, 3 products live
Conventional
25% down · 7.5% · 30yr
- Down + closing
- —
- Monthly P&I
- —
- Monthly cashflow
- —
- DSCR
- —
- Eligible?
- —
Personal DTI + credit; lowest rate.
DSCR
20% down · 8.5% · 30yr
- Down + closing
- —
- Monthly P&I
- —
- Monthly cashflow
- —
- DSCR
- —
- Eligible?
- —
No personal income docs; deal must DSCR.
Hard money
10% down · 12.0% · 12mo
- Down + closing
- —
- Monthly P&I
- —
- Monthly cashflow
- —
- DSCR
- —
- Eligible?
- —
Short-term bridge; refi at stabilization.
Rent comps 7 comps
| Address | Beds | Baths | Sqft | Rent | $/sqft | DOM | Units | Dist |
|---|---|---|---|---|---|---|---|---|
| 5733 Vandalia Trl Arlington, TX | 3.0 | 2.0 | 1638 | $1,995 | $1.22 | 44d | 1 | 1.29mi |
| 5900 Aloe Ct Arlington, TX | 3.0 | 2.0 | 1579 | $2,250 | $1.42 | 24d | 1 | 1.36mi |
| 1045 Cydnie St Kennedale, TX | 3.0 | 2.0 | 2150 | $2,995 | $1.39 | 1d | 1 | 1.39mi |
| 5905 Aloe Ct Arlington, TX | 3.0 | 2.0 | 1584 | $2,235 | $1.41 | 12d | 1 | 1.40mi |
| 6116 Silkcrest Trl Arlington, TX | 4.0 | 2.0 | 2010 | $2,500 | $1.24 | 43d | 1 | 1.44mi |
| 5611 Northstar Ln Arlington, TX | 3.0 | 2.0 | 1484 | $2,125 | $1.43 | 17d | 1 | 1.49mi |
| 5611 Northstar Ln Arlington, TX | 3.0 | 2.0 | 1484 | $2,125 | $1.43 | 4d | 1 | 1.49mi |
Listing history 20 events
-
2026-06-18days on market $196,500 Active 42 DOM
-
2026-06-17days on market $196,500 Active 41 DOM
-
2026-06-16days on market $196,500 Active 40 DOM
-
2026-06-15days on market $196,500 Active 39 DOM
-
2026-06-13days on market $196,500 Active 37 DOM
-
2026-06-09days on market $196,500 Active 33 DOM
-
2026-06-08days on market $196,500 Active 32 DOM
-
2026-06-07days on market $196,500 Active 31 DOM
-
2026-06-04days on market $196,500 Active 28 DOM
-
2026-06-03days on market $196,500 Active 27 DOM
-
2026-06-02days on market $196,500 Active 26 DOM
-
2026-06-01days on market $196,500 Active 25 DOM
-
2026-05-31days on market $196,500 Active 24 DOM
-
2026-05-07$196,500 Active 698-char remark
-
2025-11-10soldstatus
-
2013-01-15soldstatus Closed 146-char remark
Show marketing remark (146 chars)
3-2.5 older home in Downtown Kennedale. Walking distance to all that Kennedale has to offer. Opportunity for investor; leased by long time tenant.
-
2012-08-21status Pending 146-char remark
Show marketing remark (146 chars)
3-2.5 older home in Downtown Kennedale. Walking distance to all that Kennedale has to offer. Opportunity for investor; leased by long time tenant.
-
2012-06-16historical 146-char remark
Show marketing remark (146 chars)
3-2.5 older home in Downtown Kennedale. Walking distance to all that Kennedale has to offer. Opportunity for investor; leased by long time tenant.
-
2012-06-12$74,000 Active 146-char remark
Show marketing remark (146 chars)
3-2.5 older home in Downtown Kennedale. Walking distance to all that Kennedale has to offer. Opportunity for investor; leased by long time tenant.
-
2009-11-24soldstatus
ⓘ Source: listings_history table (triggers on properties + properties_extension) + one-shot
backfill from property_details.listing_events for pre-trigger history.
Tax reassessment forecast TX · Resets to sale price
- Current annual tax
- $3,396 · $283/mo
- Projected year-2 tax
- $3,596 · $300/mo
- Expected delta
- +$200/yr (+$17/mo · 5.9%)
ⓘ Screening estimate from a state-policy table — verify with the county assessor before closing.
Climate risk First Street
- Flood 1/10 Low FEMA zone X (unshaded) · 0% chance over 30 yrs
- Wildfire 5/10 Major
- Heat 7/10 Severe 7 d/yr ≥109°F today · 24 d/yr by 30 yrs out
- Wind 6/10 Major 27% chance of damaging wind over 30 yrs
- Air quality 3/10 Moderate 2 unhealthy d/yr today · 3 by 30 yrs out
Nearby sold comps map
Loading sold comps map…
Walkable amenities ~0.75 mi
Loading nearby amenities…
Taxation est. · year 1
- Rental income
- $27,320
- − Mortgage interest
- −$11,007
- − Property taxes
- −$3,396
- − Insurance
- −$982
- − Repairs & maintenance
- −$2,186
- − Management
- −$2,186
- − Depreciation
- −$5,716
- Taxable income
- $1,846
- Est. tax owed @ 24.0%
- −$443
- After-tax cash flow
- $4,395/yr
For passive investors: Depreciation is non-cash, so a rental often shows a tax loss while cash-flowing — sheltering income. Rental losses are passive: they offset passive income freely, and up to $25,000/yr can offset ordinary (W-2) income if you actively participate and your MAGI is under $100k (phasing out to $0 by $150k); unused losses carry forward. On sale, claimed depreciation is recaptured at up to 25%, and gains may owe capital-gains tax (a 1031 exchange can defer both). Figures are a year-1 estimate at your 24.0% rate — not tax advice; consult a CPA.
Schools (NCES district)
- District
- Kennedale ISD
- NCES district ID
- 4825500
- Math proficiency
- 27% ▼ -25.00%
- Reading proficiency
- 37% ▼ -13.00%
- Median HH income
- $70,497
- Composite
- 29.79/100
- National rank
- #6427
- State rank
- #522 of 826 in TX
Livability — Kennedale
- Score
- 70/100
- State rank
- #340
- US rank
- #7441
Category grades
Schools grade is shown separately in the Schools card above.
Census & demographics
- Census place
- Kennedale, TX
- County
- Tarrant County · 2,033,669 people
- City population
- 9,444
- Metro
- Dallas-Fort Worth-Arlington, TX
- Population (ZIP)
- 9,444
- Household income
- $119,156
- Rent vs Own
- Severe rent burden
- 244.0
Population outlook (Tarrant County) Hauer SSP2
- Today (2025)
- 2,380,417 people
- By 2030
- 2,578,900 · +8.3%
- By 2040
- 2,974,995 · +25.0%
- By 2050
- 3,350,489 · +40.8%
- By 2075
- 4,216,909 · +77.2%
- By 2100
- 4,741,527 · +99.2%
Race, ethnicity, and origin ACS 2023
- Neighborhood character
- Diverse neighborhood (Simpson 0.61)
- Race & ethnicity
- White 57% Black 19% Hispanic / Latino 16% Two or more races 9% Asian 4%
- Hispanic origin (detail)
- Mexican 13%
- Common ancestry
- Lithuanian 5% Slovak 2% Subsaharan African 1%
- Foreign-born
- 9% · Canada, Vietnam, Guatemala
- Languages at home
- 83% English-only · Spanish 11% Vietnamese 2% Other Indo-European 2%
Political lean MEDSL · Tarrant
- 2024 margin
- Lean R (+5.1) · D 46.7% · R 51.9% · Other 1.4%
- 2008→2024 swing
- +6.6pp toward D · 2008: -11.7pp · 2024: -5.1pp
- All cycles
- 2024: R+5.1 2020: D+0.2 2016: R+8.7 2012: R+15.7 2008: R+11.7
Not yet ingested
- Civics
- —
Market trends
- HPI YoY
- ▼ -14.02%
- Current HPI
- 261.8007
- Rent YoY
- ▲ 5.99%
- Metro
- Dallas-Fort Worth-Arlington, TX
- State GDP YoY
- ▲ 3.95%
- F500 in state
- 110
Industry mix (Fortune 500 HQ in TX)
| Industry | F500 HQs | Revenue |
|---|---|---|
| Energy | 16 | $1,198B |
|
||
| Technology | 5 | $198B |
|
||
| Engineering / Construction | 4 | $72B |
|
||
| Energy Services | 3 | $60B |
|
||
| Utilities | 3 | $41B |
|
||
| Healthcare | 2 | $330B |
|
||
Price history
+165.5% since first listed7 events — show timeline
- 2026-05-07 Listed $196,500 NTREIS
- 2025-11-10 Sold (Public Records) — Public Records
- 2013-01-15 Sold (MLS) — NTREIS
- 2012-08-21 Pending — NTREIS
- 2012-06-16 Listing Removed — NTREIS
- 2012-06-12 Listed $74,000 NTREIS
- 2009-11-24 Sold (Public Records) — Public Records
Property tax history
+3.6%/yrLatest (2025): $3,396 · -21.5% YoY. Source: county tax records.
Cash-flow waterfall
monthlySold comps — $/sqft
last 12 mo · ≤1 miLoading sold comps…