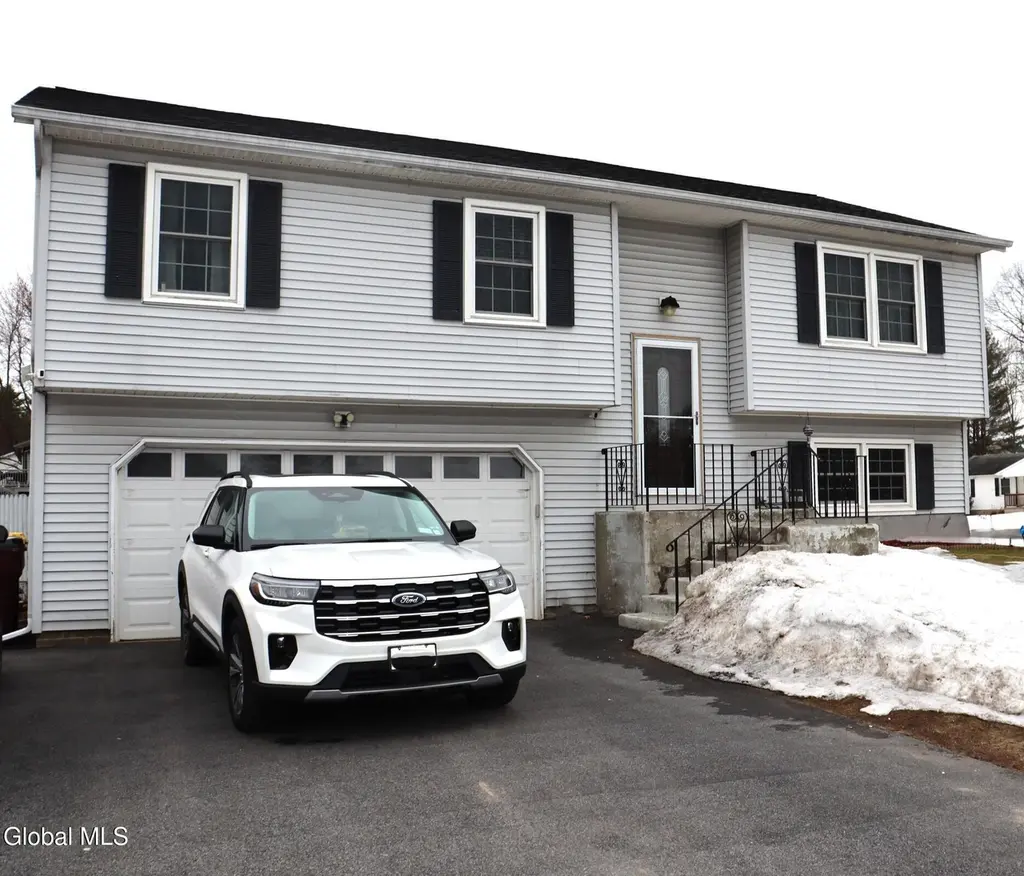
2 Moonglow Rd · Saratoga Springs, NY
Flood risk 1/10 · Minimal
- FEMA flood zone
- —
- Chance of flooding over 30 yrs
- 0.0%
- Est. flood insurance / yr
- —
Fire risk 4/10 · Minor
- Est. fire insurance / yr
- $691 – $1,283
Heat risk 3/10 · Minor
- Hot days now (above 97°F)
- 7 days/yr
- Hot days in 30 yrs
- 16 days/yr
Wind risk 2/10 · Minimal
- Chance of severe wind over 30 yrs
- 4.0%
Air-quality risk 1/10 · Minimal
- Unhealthy air days now
- 0 days/yr
- Unhealthy air days in 30 yrs
- 0 days/yr
Risk factors via First Street. Map © Google.
Why this score? — see what drove the D grade
The composite is a weighted blend of 9 inputs, each scored 0–100. Each bar is that input's sub-score; the figure is the points it added to the 100-point composite (weight × sub-score).
- ARV discount +11.7/15.0
- Cash flow +9.8/30.0
- Schools +4.7/10.0
- Livability +4.1/5.0
- DSCR +2.8/10.0
- Rent growth +2.5/5.0
- Condition / age +2.5/5.0
- 1% rule +2.4/10.0
- Appreciation +0.0/10.0
$377,200
🖨 Deal sheet 📄 Offer letter ✓ Due diligence
Listing remarks
This beautiful, well maintained home is located on a large corner lot just a few minutes off exit 16 of the Northway in a welcoming neighborhood. There are MANY upgrades and energy efficient improvements, all that's left to do is to move in and make it your own. Some modifications recently done are a new roof on the home (with a transferrable warranty) wooden shed also has new roof, whole house generator, recently remodeled main bathroom including an antifog LED mirror and double vanity sinks, leak defense padding, backing & carpeting, stainless steel LG energy star appliances in the kitchen, energy star water heater and whole house water system, low-emissivity windows, energy effici
Key facts
- Large corner lot
- Antifog led mirror
- New roof
Tags
Neighborhood map
What this means for you Summary
Snapshot
- This is a 3-bed/1.0-bath single-family listed at $377k.
Deal economics
- At list price, monthly cash flow is $-242 ($-3k/yr) — negative.
- To cash-flow at today's rent, offer at most $334k (11.3% below list).
- To meet the 1% rule (rent ≥ 1% of price), the offer needs to be $280k (25.8% below list).
- Recommended offer: $280k (25.8% below list) — sets the bar for 1% rule.
- Cap rate 5.5% vs local median 2.0% in Saratoga Springs — top-decile yield for the area; either an underpriced asset or a hidden risk that comps aren't pricing in. Stress-test before assuming the spread holds.
Location & tenants
- Location reads 82/100 on livability (#83 in NY, #1,284 nationally) — a professional / high-income tenant draw. Strengths: employment A+, housing A+, health & safety A; Watch: amenities D+, cost of living F.
- South Glens Falls Central School District (suburban): math 49% / reading 59% proficiency, ranked #307 of 590 in NY (top 52%) — acceptable for families but not a draw, mixed tenant base, ~2y average lease.
- Zoned schools: South Glens Falls Senior High School (math 92% / reading 91%, grade A+, #197 of 1,100 statewide, top 18%, 908 students, 36% FRL).
- Zoned-school proficiency averages 92% at this address vs 54% district-wide (+38 pts) — the actual schools serving this property are materially stronger than the South Glens Falls Central School District average implies; a family-tenant draw the district grade alone would hide.
- Market conditions: 113 active listings in the ZIP; 1 comparable units currently listed for rent nearby; solid renter incomes; 1,132 units permitted in Saratoga County in 2024 (378 in 5+ unit buildings).
- This rent runs 34% of the median local income ($100k/yr) — at the standard rent-burdened threshold; future hikes will face affordability resistance.
Forward outlook
- Local home prices are declining (-3.0%/yr); year-one equity from $3k of loan paydown is wiped out by about $11k of value loss. Plan a longer hold.
- Saratoga County population projected at +4% by 2050 — modest demand growth; plan on rents tracking national, not racing it.
Negotiation context
- It's been on market 39 days — a 3% lower offer ($366k) is reasonable based on typical stale-listing flexibility.
- 4 sale attempts since 25y ago with the ask held roughly flat each time — persistent listings suggest the price (not the market) is what's stuck; bring a comps-based counter.
- Current owner paid $96k; list at $377k implies a 293% gain — meaningful room to come down on a strong offer.
Questions for the listing agent
- What do current leases actually rent for vs. the listed asking? Can we see a recent rent roll and the last 12 months of T-12 income?
- It's been on market 39 days. Have you received any prior offers? Is the seller open to a 26% concession, seller financing, or rate buy-down credit?
- Is there a deadline driving the sale (1031 exchange, divorce, estate, relocation)? That informs how much negotiation room exists.
- Schools are A-rated — typically a magnet for longer-tenancy family renters. What's the average tenant stay here, and is there a school-zone premium baked into asking?
- The area grade is low — what's the realistic commute time and amenity access for the typical tenant pool here? Any planned neighborhood developments (good or bad) we should know about?
- What's the average days-on-market for RENTAL listings here right now (not sales)? A rising rental-DOM trend means longer vacancies and softer asking-rent achievability than the comps imply.
- What's the recent tenant-quality profile in this submarket — average credit score on applications, eviction rate, late-payment / NSF rate, and stable-employment percentage? A property-management company in the area should have these aggregated.
- How much new for-sale + rental construction is in the pipeline within 1–3 miles? Heavy new supply typically softens prices + rents 12–24 months out; constrained supply supports both.
Investment metrics
- 1% rule
- 0.74% ✗
- Cap rate
- 5.52%
- Cash-on-cash
- -2.75%
- DSCR
- 0.88
- GRM
- 11.2
CMA / ARV
- ARV (on-the-fly)
- $415,776
- Comps found
- 12
Show comp detail 12 sales within ~0.75 mi
| Address | Dist | Beds/Ba | Sqft | Sold | Price | $/sf | Match |
|---|---|---|---|---|---|---|---|
| 6 Kings Mills Rd | 0.22mi | 3/1.5 | 1,456 (-0%) | 5mo | $407,000 | $280 | 83 |
| 12 Tom Sawyer Dr | 0.56mi | 3/1.0 | 1,487 (+2%) | 8mo | $140,000 | $94 | 64 |
| 63 Traver Rd | 0.17mi | 3/2.0 | 1,582 (+8%) | 14mo | $398,000 | $252 | 63 |
| 1 New Kent Dr | 0.26mi | 4/1.5 (+1) | 1,344 (-8%) | 6mo | $369,900 | $275 | 62 |
| 5 Highgate Rd | 0.36mi | 3/1.5 | 1,600 (+9%) | 6mo | $408,000 | $255 | 60 |
| 10 New Kent Rd | 0.26mi | 3/1.5 | 1,248 (-15%) | 5mo | $375,000 | $300 | 57 |
| 40 Gailor Rd | 0.55mi | 3/3.5 | 1,552 (+6%) | 2mo | $475,000 | $306 | 53 |
| 5 Huckleberry Finn Ct | 0.63mi | 3/2.0 | 1,408 (-4%) | 12mo | $435,000 | $309 | 50 |
| 2 Tom Sawyer Dr | 0.50mi | 3/2.5 | 1,641 (+12%) | 8mo | $435,000 | $265 | 44 |
| 36 Tom Sawyer Dr | 0.63mi | 4/3.0 (+1) | 1,504 (+3%) | 12mo | $505,000 | $336 | 43 |
| 21 Damascus Dr | 0.70mi | 3/1.5 | 1,592 (+9%) | 12mo | $452,000 | $284 | 41 |
| 29 Highgate Rd | 0.51mi | 3/1.5 | 1,248 (-15%) | 12mo | $430,000 | $345 | 40 |
Match score weights: distance 35% · size 25% · config 20% · recency 20%. Top-matched comps best support the ARV.
Projected returns pro-forma
-3.0% appreciation · 3.0% rent growth · sell at horizon
- IRR
- -20.9%
- Equity multiple
- 0.27×
- Total profit
- $-76,594
- Equity at exit
- $56,242
- IRR
- -14.3%
- Equity multiple
- 0.18×
- Total profit
- $-86,764
- Equity at exit
- $32,613
Cash invested: $105,616 (down + closing). Projections, not guarantees.
Landlord ↔ Tenant lean methodology
- Overall (STATE)
- 15 Strongly Tenant-Friendly
- State New York
- 15 Strongly Tenant-Friendly · D+10
- County
- — inherits STATE
- City
- — inherits STATE
ZIP-level market 12831
- Home prices YoY
- -12.8%
- Active inventory
- 113
- Price-to-rent
- 11.2×
Monthly cashflow live
- Estimated rent
- $2,797 medium interval (Pro) →
- Mortgage (P&I)
- −$1,978
- Tax from tax record
- −$317 /mo · $3,802/yr
- Insurance
- −$157
- HOA
- −$0
- Vacancy / Maint / Mgmt
- −$587
- Net cashflow
- $-242
Break-even live
UW: 25.0% down · 7.5% · 30yr · 1.5% tax · 5.0% vac · 8.0% maint · 8.0% mgmt
Financing live
Cash to close
- Down payment
- $94,300
- Closing costs
- $11,316
- Reserves months
- —
- Total cash needed
- —
Loan-product check · same deal, 3 products live
Conventional
25% down · 7.5% · 30yr
- Down + closing
- —
- Monthly P&I
- —
- Monthly cashflow
- —
- DSCR
- —
- Eligible?
- —
Personal DTI + credit; lowest rate.
DSCR
20% down · 8.5% · 30yr
- Down + closing
- —
- Monthly P&I
- —
- Monthly cashflow
- —
- DSCR
- —
- Eligible?
- —
No personal income docs; deal must DSCR.
Hard money
10% down · 12.0% · 12mo
- Down + closing
- —
- Monthly P&I
- —
- Monthly cashflow
- —
- DSCR
- —
- Eligible?
- —
Short-term bridge; refi at stabilization.
Rent comps 1 comps
| Address | Beds | Baths | Sqft | Rent | $/sqft | DOM | Units | Dist |
|---|---|---|---|---|---|---|---|---|
| 3 Whispering Pines Rd Gansevoort, NY | 3.0 | 1.5 | 1400 | $2,100 | $1.50 | 13d | 1 | 1.45mi |
Listing history 14 events
-
2026-04-27status Pending
-
2026-03-19$377,200 Active
-
2025-09-23historical
-
2025-08-23price $379,900
-
2025-07-28price $389,000
-
2025-07-15price $394,000
-
2025-07-07price $399,000
-
2025-06-13$409,000 Active
-
2019-02-28historical
-
2005-02-02$276,550
-
2002-02-25soldstatus $96,000
-
2002-02-05soldstatus $96,000
-
2001-12-23historical
-
2001-12-01$96,000
ⓘ Source: listings_history table (triggers on properties + properties_extension) + one-shot
backfill from property_details.listing_events for pre-trigger history.
Tax reassessment forecast NY · Partial reset (capped growth)
- Current annual tax
- $3,802 · $317/mo
- Projected year-2 tax
- $5,088 · $424/mo
- Expected delta
- +$1,286/yr (+$107/mo · 33.8%)
ⓘ Screening estimate from a state-policy table — verify with the county assessor before closing.
Climate risk First Street
- Flood 1/10 Low 0% chance over 30 yrs
- Wildfire 4/10 Moderate
- Heat 3/10 Moderate 7 d/yr ≥97°F today · 16 d/yr by 30 yrs out
- Wind 2/10 Low 4% chance of damaging wind over 30 yrs
- Air quality 1/10 Low 0 unhealthy d/yr today · 0 by 30 yrs out
Nearby sold comps map
Loading sold comps map…
Walkable amenities ~0.75 mi
Loading nearby amenities…
Taxation est. · year 1
- Rental income
- $33,570
- − Mortgage interest
- −$21,129
- − Property taxes
- −$3,802
- − Insurance
- −$1,886
- − Repairs & maintenance
- −$2,686
- − Management
- −$2,686
- − Depreciation
- −$10,973
- Taxable loss
- −$9,592
- Est. tax savings @ 24.0%
- +$2,302
- After-tax cash flow
- $-603/yr
For passive investors: Depreciation is non-cash, so a rental often shows a tax loss while cash-flowing — sheltering income. Rental losses are passive: they offset passive income freely, and up to $25,000/yr can offset ordinary (W-2) income if you actively participate and your MAGI is under $100k (phasing out to $0 by $150k); unused losses carry forward. On sale, claimed depreciation is recaptured at up to 25%, and gains may owe capital-gains tax (a 1031 exchange can defer both). Figures are a year-1 estimate at your 24.0% rate — not tax advice; consult a CPA.
Schools (NCES district)
- District
- South Glens Falls Central School District
- NCES district ID
- 3627240
- Math proficiency
- 49% ▼ -9.00%
- Reading proficiency
- 59% ▲ 12.00%
- Median HH income
- $59,015
- Composite
- 46.93/100
- National rank
- #2363
- State rank
- #307 of 590 in NY
Livability — Saratoga Springs
- Score
- 82/100
- State rank
- #83
- US rank
- #1284
Category grades
Schools grade is shown separately in the Schools card above.
Census & demographics
- County
- Saratoga County · 166,192 people
- City population
- 40,057
- Metro
- Albany-Schenectady-Troy, NY
- Population (ZIP)
- 18,025
- Household income
- $100,024
- Rent vs Own
- Severe rent burden
- 497.0
Population outlook (Saratoga County) Hauer SSP2
- Today (2025)
- 238,889 people
- By 2030
- 243,681 · +2.0%
- By 2040
- 249,118 · +4.3%
- By 2050
- 248,638 · +4.1%
- By 2075
- 241,675 · +1.2%
- By 2100
- 213,150 · -10.8%
Race, ethnicity, and origin ACS 2023
- Neighborhood character
- Predominantly White (92%)
- Race & ethnicity
- White 92% Hispanic / Latino 3% Two or more races 3% Asian 1%
- Common ancestry
- Lithuanian 11% Romanian 4% Iranian 2%
- Foreign-born
- 3% · Canada
- Languages at home
- 95% English-only · Spanish 2% Russian/Polish/Slavic 1% Other Indo-European 1%
Political lean MEDSL · Saratoga
- 2024 margin
- Toss-up / Even · D 50.9% · R 49.1%
- 2008→2024 swing
- -1.6pp toward R · 2008: 3.4pp · 2024: 1.8pp
- All cycles
- 2024: D+1.8 2020: D+5.4 2016: R+4.4 2012: D+2.1 2008: D+3.4
Not yet ingested
- Civics
- —
Market trends
- HPI YoY
- ▼ -51.79%
- Current HPI
- 351.6972
- Rent YoY
- —
- Metro
- Albany-Schenectady-Troy, NY
- State GDP YoY
- ▲ 2.60%
- F500 in state
- 92
Industry mix (Fortune 500 HQ in NY)
| Industry | F500 HQs | Revenue |
|---|---|---|
| Financial Services | 10 | $950B |
|
||
| Consumer Goods | 9 | $162B |
|
||
| Insurance | 4 | $225B |
|
||
| Telecommunications | 2 | $144B |
|
||
| Pharmaceuticals | 2 | $112B |
|
||
| Media / Entertainment | 2 | $69B |
|
||
Price history
+292.9% since first listed14 events — show timeline
- 2026-04-27 Pending — Global MLS
- 2026-03-19 Listed $377,200 Global MLS
- 2025-09-23 Listing Removed — Global MLS
- 2025-08-23 Price Changed $379,900 Global MLS
- 2025-07-28 Price Changed $389,000 Global MLS
- 2025-07-15 Price Changed $394,000 Global MLS
- 2025-07-07 Price Changed $399,000 Global MLS
- 2025-06-13 Listed $409,000 Global MLS
- 2019-02-28 Listing Removed — Global MLS
- 2005-02-02 Listed $276,550 Global MLS
- 2002-02-25 Sold (Public Records) $96,000 Public Records
- 2002-02-05 Sold (MLS) $96,000 Global MLS
- 2001-12-23 Listing Removed — Global MLS
- 2001-12-01 Listed $96,000 Global MLS
Property tax history
+1.9%/yrLatest (2025): $3,802 · +3.2% YoY. Source: county tax records.
Cash-flow waterfall
monthlySold comps — $/sqft
last 12 mo · ≤1 miLoading sold comps…