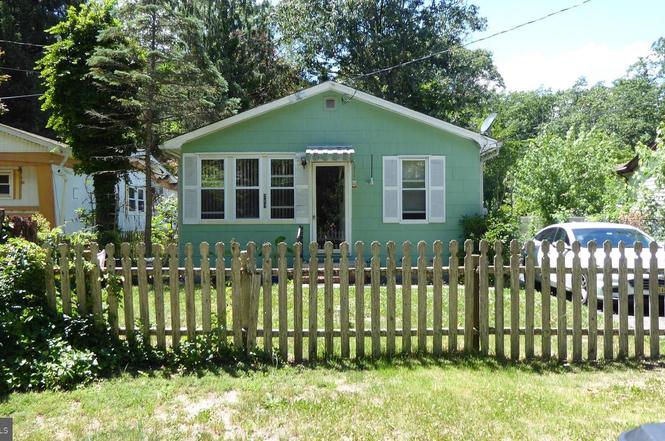
217 Robin Rd · Laurel Lake, NJ
Flood risk 1/10 · Minimal
- FEMA flood zone
- X (unshaded)
- Chance of flooding over 30 yrs
- 0.0%
- Est. flood insurance / yr
- $507 – $1,088
Fire risk 3/10 · Minor
- Est. fire insurance / yr
- $526 – $976
Heat risk 7/10 · Major
- Hot days now (above 102°F)
- 7 days/yr
- Hot days in 30 yrs
- 15 days/yr
Wind risk 8/10 · Major
- Chance of severe wind over 30 yrs
- 80.0%
Air-quality risk 3/10 · Minor
- Unhealthy air days now
- 3 days/yr
- Unhealthy air days in 30 yrs
- 5 days/yr
Risk factors via First Street. Map © Google.
Why this score? — see what drove the B- grade
The composite is a weighted blend of 9 inputs, each scored 0–100. Each bar is that input's sub-score; the figure is the points it added to the 100-point composite (weight × sub-score).
- Cash flow +25.0/30.0
- ARV discount +15.0/15.0
- DSCR +8.1/10.0
- 1% rule +7.2/10.0
- Rent growth +3.0/5.0
- Livability +2.8/5.0
- Condition / age +2.5/5.0
- Schools +1.5/10.0
- Appreciation +0.0/10.0
$125,000
🖨 Deal sheet 📄 Offer letter ✓ Due diligence
Listing remarks
ONE STORY home in need of some repairs. Electric is being updated. Well installed 2020. Septic inspection and Health Department determination letter performed in 2022 revealed a high-water condition in the seepage pit. See report in associated documents. Otherwise, selling AS IS. COME BUY!
Key facts
- Well installed 2020
- 3,999 sq ft lot
- 2 parking spots
Tags
Property features AI
Finance
- Other: Ownership is fee simple
Exterior
- Parking: Asphalt driveway with space for two cars; Total of two garage/parking spaces
- Utilities: On-site septic system; Well water; Electric hot water; Natural gas
- Home design: Detached home; Above-grade finished area reported (748 sq ft)
- Construction: Frame construction; Crawl space foundation; Above grade and below grade structures
- Exterior features: Not in a federal flood zone; Lot dimensions approximately 40 x 100
Interior
- Kitchen: Dishwasher; Gas range; Microwave
- Bedrooms: Two bedrooms on the main level
- Flooring: Ceramic tile; Hardwood
- Bathrooms: One full bathroom on the main level
- Heating & cooling: Forced air heating; Natural gas heating; Electric hot water
- Interior features: Dishwasher; Gas range (oven/range); Microwave; No basement
- Laundry & utility: Main floor laundry
Neighborhood map
What this means for you Summary
Snapshot
- This is a 2-bed/1.0-bath single-family listed at $125k.
Deal economics
- At list price, monthly cash flow is $272 ($3k/yr) — positive.
- The deal already cash-flows at list — no discount required.
- Meets the 1% rule at list price ($2k rent vs $125k).
- Cap rate 8.9% vs local median 7.3% in Laurel Lake — meaningfully above typical; check what's discounted (condition, days-on-market, listing class) to confirm the premium yield is real.
Location & tenants
- Location reads 56/100 on livability (#521 in NJ) — a working-class tenant base; expect higher turnover. Strengths: crime A+, housing A+, cost of living B; Watch: schools F, amenities F, commute F.
- Commercial Township School District (rural): math 5% / reading 29% proficiency, ranked #449 of 472 in NJ (top 95%) — low school quality limits family demand, transient renter base, plan for 1-2y turnover; 65% free/reduced lunch — lower-income household profile, screen leases tightly.
- Market conditions: Rents rising (+1.9%/yr); 296 active listings in the ZIP; 216 units permitted in Cumberland County in 2024 (73 in 5+ unit buildings).
Forward outlook
- Local home prices are declining (-3.0%/yr); year-one equity from $864 of loan paydown is wiped out by about $4k of value loss. Plan a longer hold.
- Cumberland County population projected to shrink 7% by 2050 — rents likely to lag national; underwrite the cash flow, not the appreciation.
Negotiation context
- Only 3 days on market — expect competitive offers; lowballing is unlikely to land.
- 5 sale attempts since 16y ago with the ask held roughly flat each time — persistent listings suggest the price (not the market) is what's stuck; bring a comps-based counter.
Risks & watch-outs
- Climate carrying-cost: severe wind risk, 80% chance of damaging wind over 30y; extreme-heat days projected 7→15/yr by 2055 (HVAC capex compounding) — expect insurance premiums to compound above CPI over the hold.
Questions for the listing agent
- Built in 1970 — when were the roof, HVAC, electrical panel, plumbing, and water heater last replaced?
- Is there a deadline driving the sale (1031 exchange, divorce, estate, relocation)? That informs how much negotiation room exists.
- Schools are F-rated, which usually means shorter tenancies and higher turnover. Who's the typical renter profile here, and what's been the actual vacancy rate?
- What's the average days-on-market for RENTAL listings here right now (not sales)? A rising rental-DOM trend means longer vacancies and softer asking-rent achievability than the comps imply.
- What's the recent tenant-quality profile in this submarket — average credit score on applications, eviction rate, late-payment / NSF rate, and stable-employment percentage? A property-management company in the area should have these aggregated.
- How much new for-sale + rental construction is in the pipeline within 1–3 miles? Heavy new supply typically softens prices + rents 12–24 months out; constrained supply supports both.
Investment metrics
- 1% rule
- 1.22% ✓
- Cap rate
- 8.90%
- Cash-on-cash
- 9.32%
- DSCR
- 1.41
- GRM
- 6.8
CMA / ARV
- ARV (on-the-fly)
- $181,016
- Comps found
- 12
Show comp detail 12 sales within ~0.75 mi
| Address | Dist | Beds/Ba | Sqft | Sold | Price | $/sf | Match |
|---|---|---|---|---|---|---|---|
| 328 Jute Rd | 0.27mi | 2/1.0 | 753 (+1%) | 7mo | $184,500 | $245 | 81 |
| 1857 Lakeshore Dr | 0.37mi | 1/1.0 (-1) | 736 (-2%) | 8mo | $60,000 | $82 | 68 |
| 432 Mistle Rd | 0.42mi | 2/1.0 | 700 (-6%) | 4mo | $129,900 | $186 | 67 |
| 118 Canary Rd | 0.32mi | 2/1.0 | 660 (-12%) | 2mo | $187,000 | $283 | 64 |
| 107 Pine Rd | 0.58mi | 2/1.0 | 776 (+4%) | 4mo | $184,900 | $238 | 64 |
| 1214 NE Lakeshore Dr | 0.58mi | 2/1.0 | 716 (-4%) | 13mo | $184,325 | $257 | 55 |
| 110 Daffodil Rd | 0.35mi | 1/2.0 (-1) | 858 (+15%) | 5mo | $187,500 | $219 | 46 |
| 214 SE Lakeshore Dr | 0.46mi | 2/1.0 | 828 (+11%) | 18mo | $240,000 | $290 | 45 |
| 317 Evergreen Rd | 0.40mi | 2/1.0 | 640 (-14%) | 15mo | $155,000 | $242 | 45 |
| 700 NE Lake Shore Dr | 0.73mi | 1/1.0 (-1) | 810 (+8%) | 6mo | $200,000 | $247 | 42 |
| 200 W Buckshutem Rd | 0.68mi | 2/1.0 | 852 (+14%) | 8mo | $115,000 | $135 | 38 |
| 439 Mistle Rd | 0.41mi | 2/1.0 | 858 (+15%) | 23mo | $25,000 | $29 | 37 |
Match score weights: distance 35% · size 25% · config 20% · recency 20%. Top-matched comps best support the ARV.
Projected returns pro-forma
-3.0% appreciation · 1.94% rent growth · sell at horizon
- IRR
- -3.5%
- Equity multiple
- 0.87×
- Total profit
- $-4,489
- Equity at exit
- $18,638
- IRR
- 5.0%
- Equity multiple
- 1.35×
- Total profit
- $12,187
- Equity at exit
- $10,808
Cash invested: $35,000 (down + closing). Projections, not guarantees.
Landlord ↔ Tenant lean methodology
- Overall (STATE)
- 21 Tenant-Leaning
- State New Jersey
- 21 Tenant-Leaning · D+6
- County
- — inherits STATE
- City
- — inherits STATE
ZIP-level market 08332
- Home prices YoY
- -28.9%
- Rents YoY
- 1.9%
- Active inventory
- 296
- Price-to-rent
- 6.8×
Monthly cashflow live
- Estimated rent
- $1,522 medium interval (Pro) →
- Mortgage (P&I)
- −$656
- Tax from tax record
- −$223 /mo · $2,672/yr
- Insurance
- −$52
- HOA
- −$0
- Vacancy / Maint / Mgmt
- −$320
- Net cashflow
- $272
Break-even live
UW: 25.0% down · 7.5% · 30yr · 1.5% tax · 5.0% vac · 8.0% maint · 8.0% mgmt
Financing live
Cash to close
- Down payment
- $31,250
- Closing costs
- $3,750
- Reserves months
- —
- Total cash needed
- —
Loan-product check · same deal, 3 products live
Conventional
25% down · 7.5% · 30yr
- Down + closing
- —
- Monthly P&I
- —
- Monthly cashflow
- —
- DSCR
- —
- Eligible?
- —
Personal DTI + credit; lowest rate.
DSCR
20% down · 8.5% · 30yr
- Down + closing
- —
- Monthly P&I
- —
- Monthly cashflow
- —
- DSCR
- —
- Eligible?
- —
No personal income docs; deal must DSCR.
Hard money
10% down · 12.0% · 12mo
- Down + closing
- —
- Monthly P&I
- —
- Monthly cashflow
- —
- DSCR
- —
- Eligible?
- —
Short-term bridge; refi at stabilization.
Listing history 4 events
-
2026-06-19days on market $125,000 Active 3 DOM
-
2026-06-18days on market $125,000 Active 2 DOM
-
2026-06-17remarks 290-char remark
-
2026-06-17$125,000 Active 1 DOM
ⓘ Source: listings_history table (triggers on properties + properties_extension) + one-shot
backfill from property_details.listing_events for pre-trigger history.
Tax reassessment forecast NJ · Partial reset (capped growth)
- Current annual tax
- $2,672 · $223/mo
- Projected year-2 tax
- $2,892 · $241/mo
- Expected delta
- +$220/yr (+$18/mo · 8.3%)
ⓘ Screening estimate from a state-policy table — verify with the county assessor before closing.
Climate risk First Street
- Flood 1/10 Low FEMA zone X (unshaded) · 0% chance over 30 yrs
- Wildfire 3/10 Moderate
- Heat 7/10 Severe 7 d/yr ≥102°F today · 15 d/yr by 30 yrs out
- Wind 8/10 Severe 80% chance of damaging wind over 30 yrs
- Air quality 3/10 Moderate 3 unhealthy d/yr today · 5 by 30 yrs out
Nearby sold comps map
Loading sold comps map…
Walkable amenities ~0.75 mi
Loading nearby amenities…
Taxation est. · year 1
- Rental income
- $18,258
- − Mortgage interest
- −$7,002
- − Property taxes
- −$2,672
- − Insurance
- −$625
- − Repairs & maintenance
- −$1,461
- − Management
- −$1,461
- − Depreciation
- −$3,636
- Taxable income
- $1,402
- Est. tax owed @ 24.0%
- −$336
- After-tax cash flow
- $2,925/yr
For passive investors: Depreciation is non-cash, so a rental often shows a tax loss while cash-flowing — sheltering income. Rental losses are passive: they offset passive income freely, and up to $25,000/yr can offset ordinary (W-2) income if you actively participate and your MAGI is under $100k (phasing out to $0 by $150k); unused losses carry forward. On sale, claimed depreciation is recaptured at up to 25%, and gains may owe capital-gains tax (a 1031 exchange can defer both). Figures are a year-1 estimate at your 24.0% rate — not tax advice; consult a CPA.
Schools (NCES district)
- District
- Commercial Township School District
- NCES district ID
- 3403480
- Math proficiency
- 5% ▼ -7.00%
- Reading proficiency
- 29% ▲ 10.00%
- Median HH income
- $45,143
- Composite
- 14.86/100
- National rank
- #9378
- State rank
- #449 of 472 in NJ
Livability — Laurel Lake
- Score
- 56/100
- State rank
- #521
- US rank
- #22397
Category grades
Schools grade is shown separately in the Schools card above.
Census & demographics
- Census place
- Laurel Lake, NJ
- County
- Cumberland County · 80,266 people
- Metro
- Vineland-Bridgeton, NJ
- Population (ZIP)
- 35,228
- Household income
- $67,496
- Rent vs Own
- Severe rent burden
- 1761.0
Population outlook (Cumberland County) Hauer SSP2
- Today (2025)
- 152,743 people
- By 2030
- 150,373 · -1.6%
- By 2040
- 146,881 · -3.8%
- By 2050
- 142,653 · -6.6%
- By 2075
- 129,468 · -15.2%
- By 2100
- 107,456 · -29.6%
Race, ethnicity, and origin ACS 2023
- Neighborhood character
- Diverse neighborhood (Simpson 0.60)
- Race & ethnicity
- White 59% Hispanic / Latino 17% Black 15% Two or more races 11% Asian 2%
- Hispanic origin (detail)
- Mexican 4% Puerto Rican 10%
- Common ancestry
- Romanian 4% Lithuanian 2% Slovak 1%
- Foreign-born
- 7% · Canada
- Languages at home
- 85% English-only · Spanish 11% Other Indo-European 1% Other Asian/Pacific 1%
Political lean MEDSL · Cumberland
- 2024 margin
- Toss-up / Even · D 47.6% · R 51.3% · Other 1.1%
- 2008→2024 swing
- -25.4pp toward R · 2008: 21.6pp · 2024: -3.8pp
- All cycles
- 2024: R+3.8 2020: D+6.0 2016: D+5.3 2012: D+23.1 2008: D+21.6
Not yet ingested
- Civics
- —
Market trends
- HPI YoY
- ▼ -111.45%
- Current HPI
- 274.8011
- Rent YoY
- ▲ 1.94%
- Metro
- Vineland-Bridgeton, NJ
- State GDP YoY
- ▲ 2.05%
- F500 in state
- 34
Industry mix (Fortune 500 HQ in NJ)
| Industry | F500 HQs | Revenue |
|---|---|---|
| Consumer Goods | 3 | $31B |
|
||
| Pharmaceuticals | 2 | $153B |
|
||
| Technology | 2 | $21B |
|
||
| Insurance | 2 | $20B |
|
||
| Healthcare | 2 | $19B |
|
||
| Financial Services | 1 | $70B |
|
||
Price history
+5.0% since first listed9 events — show timeline
- 2026-06-16 Listed $125,000 BRIGHT MLS
- 2013-11-02 Listing Removed — BRIGHT MLS
- 2013-05-02 Listed $89,900 BRIGHT MLS
- 2013-04-30 Listing Removed — BRIGHT MLS
- 2012-10-10 Listed $90,000 BRIGHT MLS
- 2012-05-31 Listing Removed — SJSRMLS
- 2011-11-07 Listed $90,000 SJSRMLS
- 2011-04-01 Listing Removed — SJSRMLS
- 2010-09-23 Listed $119,000 SJSRMLS
Property tax history
+3.8%/yrLatest (2025): $2,672 · +4.9% YoY. Source: county tax records.
Cash-flow waterfall
monthlySold comps — $/sqft
last 12 mo · ≤1 miLoading sold comps…