34 Harbor Blvd · Springs, NY
Flood risk 1/10 · Minimal
- FEMA flood zone
- X (unshaded)
- Chance of flooding over 30 yrs
- 0.0%
- Est. flood insurance / yr
- $507 – $1,088
Fire risk 1/10 · Minimal
- Est. fire insurance / yr
- $691 – $1,283
Heat risk 4/10 · Minor
- Hot days now (above 89°F)
- 7 days/yr
- Hot days in 30 yrs
- 19 days/yr
Wind risk 8/10 · Major
- Chance of severe wind over 30 yrs
- 80.0%
Air-quality risk 3/10 · Minor
- Unhealthy air days now
- 2 days/yr
- Unhealthy air days in 30 yrs
- 3 days/yr
Risk factors via First Street. Map © Google.
Why this score? — see what drove the C- grade
The composite is a weighted blend of 9 inputs, each scored 0–100. Each bar is that input's sub-score; the figure is the points it added to the 100-point composite (weight × sub-score).
- Cash flow +25.1/30.0
- DSCR +8.2/10.0
- 1% rule +5.5/10.0
- Schools +5.1/10.0
- Rent growth +5.0/5.0
- Livability +3.2/5.0
- Condition / age +2.5/5.0
- ARV discount +0.0/15.0
- Appreciation +0.0/10.0
$1,939,000
🖨 Deal sheet 📄 Offer letter ✓ Due diligence
Listing remarks
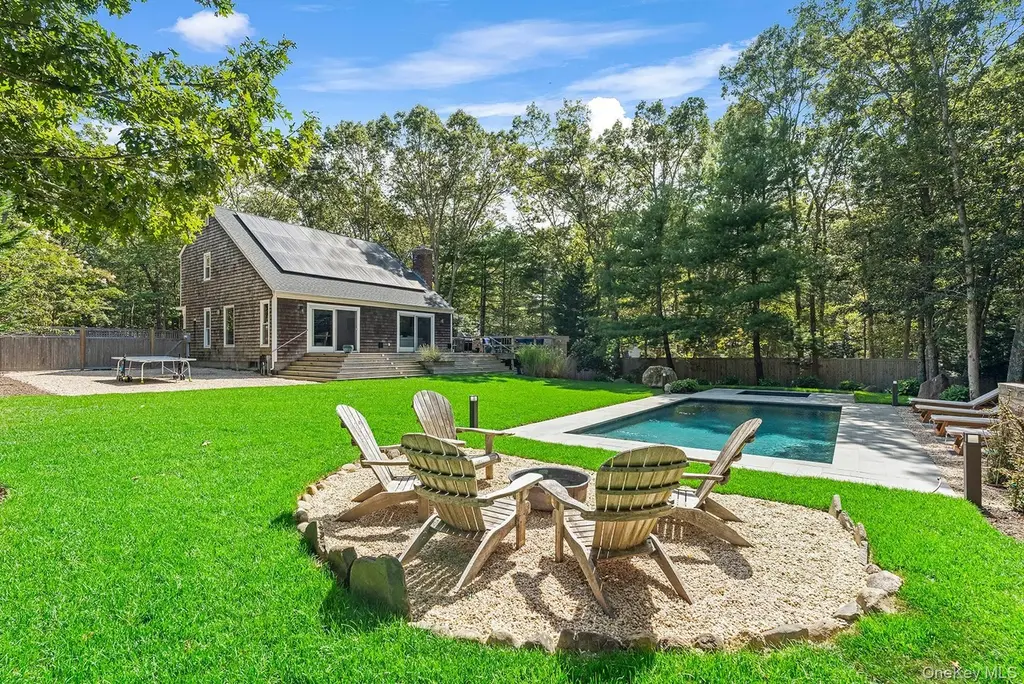
Don't miss this opportunity to own a designer's own piece of East Hampton! Tucked away on a quiet corner lot of just over 0.63 acres, this three-bedroom, two-bath Saltbox blends Hamptons charm with modern upgrades and sustainable living. Inside, the sun-drenched living room showcases a dramatic floor-to-ceiling brick fireplace and glass sliders leading to an expansive new 3,000± sq. ft. mahogany deck-perfect for entertaining or quiet relaxation. This special home has been thoughtfully updated and features a brand-new solar system, a high-efficiency heat pump, a new HVAC system, and a universal EV charger to minimize energy costs and environmental impact. Additional enhancements inclu
Key facts
- Universal ev charger
- New mahogany deck
- New hvac system
Tags
Property features AI
Exterior
- Parking: Driveway (no carport)
- Utilities: Septic tank; Natural gas available
- Home design: Single family residence
- Construction: Wood siding construction
- Exterior features: Private pool; Wood siding; Not waterfront
Interior
- Kitchen: Dishwasher; Microwave; Oven; Range
- Bedrooms: 7 rooms total
- Bathrooms: 2 full bathrooms
- Heating & cooling: Electric heating; Central air conditioning; Wood-burning fireplace (1)
- Interior features: First floor full bath; Eat-in kitchen; Entrance foyer; Unfinished attic; Unfinished basement
- Laundry & utility: Basement utility space
Neighborhood map
What this means for you Summary
Snapshot
- This is a 3-bed/2.0-bath single-family listed at $1.94M.
Deal economics
- At list price, monthly cash flow is $4k ($52k/yr) — positive.
- The deal already cash-flows at list — no discount required.
- Meets the 1% rule at list price ($20k rent vs $1.94M).
- Recommended offer: $1.88M (3.0% below list) — sets the bar for market timing.
Location & tenants
- Location reads 63/100 on livability (#809 in NY) — a middle-class / working-renter tenant base. Strengths: crime A+, employment A+; Watch: housing C-, schools D-, amenities F.
- Springs Union Free School District (town): math 55% / reading 60% proficiency, ranked #239 of 590 in NY (top 40%) — acceptable for families but not a draw, mixed tenant base, ~2y average lease; only 9% free/reduced lunch — higher-income household profile.
- Market conditions: Rents rising fast (+12.3%/yr); 135 active listings in the ZIP; 7 comparable units currently listed for rent nearby; rentals at typical pace (median 22d on market — plan ~3-4 weeks tenant-placement turnaround); high-income renter base; 1,366 units permitted in Suffolk County in 2024 (216 in 5+ unit buildings).
- At $20,339/mo this rent would consume 188% of the median local household income ($130k/yr) (locally 896% of renters already pay >50% of income on rent) — very limited rent-growth headroom before tenants either downsize or default.
Forward outlook
- Local home prices are declining (-3.0%/yr); year-one equity from $13k of loan paydown is wiped out by about $58k of value loss. Plan a longer hold.
- Suffolk County population projected to shrink 5% by 2050 — rents likely to lag national; underwrite the cash flow, not the appreciation.
- At projected returns (-3.0% appreciation + 8.0% rent growth), your $543k cash investment doubles in ~8 years — after that, you're playing with house money.
Negotiation context
- It's been on market 41 days — a 3% lower offer ($1.88M) is reasonable based on typical stale-listing flexibility.
- 6 sale attempts since 2y ago with the ask held roughly flat each time — persistent listings suggest the price (not the market) is what's stuck; bring a comps-based counter.
- Current owner paid $1.40M; 38% above their basis — modest negotiation headroom, anchor on the comps not their cost.
Risks & watch-outs
- Climate carrying-cost: severe wind risk, 80% chance of damaging wind over 30y — expect insurance premiums to compound above CPI over the hold.
Questions for the listing agent
- It's been on market 41 days. Have you received any prior offers? Is the seller open to a 3% concession, seller financing, or rate buy-down credit?
- Built in 1977 — when were the roof, HVAC, electrical panel, plumbing, and water heater last replaced?
- Is there a deadline driving the sale (1031 exchange, divorce, estate, relocation)? That informs how much negotiation room exists.
- Schools are D-rated, which usually means shorter tenancies and higher turnover. Who's the typical renter profile here, and what's been the actual vacancy rate?
- What's the average days-on-market for RENTAL listings here right now (not sales)? A rising rental-DOM trend means longer vacancies and softer asking-rent achievability than the comps imply.
- What's the recent tenant-quality profile in this submarket — average credit score on applications, eviction rate, late-payment / NSF rate, and stable-employment percentage? A property-management company in the area should have these aggregated.
- How much new for-sale + rental construction is in the pipeline within 1–3 miles? Heavy new supply typically softens prices + rents 12–24 months out; constrained supply supports both.
Investment metrics
- 1% rule
- 1.05% ✓
- Cap rate
- 8.96%
- Cash-on-cash
- 9.51%
- DSCR
- 1.42
- GRM
- 7.9
CMA / ARV
- ARV (median comp)
- $1,348,531
- List price
- $1,939,000
- Delta
- 43.79%
- Verdict
- OVERPRICED
- Comps
- 12 within 1.0 mi
Show comp detail 4 sales within ~0.75 mi
| Address | Dist | Beds/Ba | Sqft | Sold | Price | $/sf | Match |
|---|---|---|---|---|---|---|---|
| 65 Sandra Rd | 0.45mi | 2/1.5 (-1) | 1,500 (0%) | 5mo | $1,575,000 | $1,050 | 68 |
| 158 Woodbine Dr | 0.49mi | 3/2.0 | 1,418 (-6%) | 7mo | $1,075,000 | $758 | 62 |
| 51 Cedar Ridge Dr | 0.13mi | 3/1.0 | 1,300 (-13%) | 14mo | $1,100,000 | $846 | 56 |
| 23 Squaw Rd | 0.72mi | 4/2.0 (+1) | 1,500 (0%) | 16mo | $1,610,000 | $1,073 | 48 |
Match score weights: distance 35% · size 25% · config 20% · recency 20%. Top-matched comps best support the ARV.
Projected returns pro-forma
-3.0% appreciation · 8.0% rent growth · sell at horizon
- IRR
- 3.0%
- Equity multiple
- 1.12×
- Total profit
- $66,702
- Equity at exit
- $289,111
- IRR
- 16.6%
- Equity multiple
- 2.65×
- Total profit
- $897,433
- Equity at exit
- $167,649
Cash invested: $542,920 (down + closing). Projections, not guarantees.
Landlord ↔ Tenant lean methodology
- Overall (STATE)
- 15 Strongly Tenant-Friendly
- State New York
- 15 Strongly Tenant-Friendly · D+10
- County
- — inherits STATE
- City
- — inherits STATE
ZIP-level market 11937
- Rents YoY
- 12.3%
- Active inventory
- 135
- Price-to-rent
- 7.9×
Monthly cashflow live
- Estimated rent
- $20,339 medium interval (Pro) →
- Mortgage (P&I)
- −$10,168
- Tax from tax record
- −$788 /mo · $9,454/yr
- Insurance
- −$808
- HOA
- −$0
- Vacancy / Maint / Mgmt
- −$4,271
- Net cashflow
- $4,304
Break-even live
UW: 25.0% down · 7.5% · 30yr · 1.5% tax · 5.0% vac · 8.0% maint · 8.0% mgmt
Financing live
Cash to close
- Down payment
- $484,750
- Closing costs
- $58,170
- Reserves months
- —
- Total cash needed
- —
Loan-product check · same deal, 3 products live
Conventional
25% down · 7.5% · 30yr
- Down + closing
- —
- Monthly P&I
- —
- Monthly cashflow
- —
- DSCR
- —
- Eligible?
- —
Personal DTI + credit; lowest rate.
DSCR
20% down · 8.5% · 30yr
- Down + closing
- —
- Monthly P&I
- —
- Monthly cashflow
- —
- DSCR
- —
- Eligible?
- —
No personal income docs; deal must DSCR.
Hard money
10% down · 12.0% · 12mo
- Down + closing
- —
- Monthly P&I
- —
- Monthly cashflow
- —
- DSCR
- —
- Eligible?
- —
Short-term bridge; refi at stabilization.
Rent comps 7 comps
| Address | Beds | Baths | Sqft | Rent | $/sqft | DOM | Units | Dist |
|---|---|---|---|---|---|---|---|---|
| 117 Woodbine Dr East Hampton, NY | 3.0 | 2.0 | 1496 | $65,000 | $43.45 | 43d | 1 | 0.39mi |
| 289 Three Mile Harbor Hog Creek Rd East Hampton, NY | 3.0 | 3.0 | 1600 | $45,600 | $28.50 | 43d | 1 | 0.55mi |
| 8 Beverly Rd East Hampton, NY | 4.0 | 2.0 | 1269 | $20,000 | $15.76 | 1d | 1 | 0.69mi |
| 20 Howard St East Hampton, NY | 3.0 | 2.5 | 2000 | $75,000 | $37.50 | 22d | 1 | 0.79mi |
| 3 Birdie Ln East Hampton, NY | 3.0 | 2.5 | 2000 | $15,000 | $7.50 | 1d | 1 | 1.28mi |
| 319 Three Mile Harbor Rd East Hampton, NY | 2.0 | 1.0 | 1100 | $5,500 | $5.00 | 1d | 1 | 1.29mi |
| 3 Forest Ct East Hampton, NY | 3.0 | 2.0 | 1750 | $50,000 | $28.57 | 24d | 1 | 1.33mi |
Listing history 19 events
-
2026-06-04days on market $1,939,000 Active 41 DOM
-
2026-06-03days on market $1,939,000 Active 40 DOM
-
2026-06-02days on market $1,939,000 Active 39 DOM
-
2026-06-01days on market $1,939,000 Active 38 DOM
-
2026-05-31days on market $1,939,000 Active 37 DOM
-
2026-04-24$1,939,000 Active 1505-char remark
-
2025-09-15$1,950,000 Active
-
2025-09-15historical
-
2025-09-06$1,950,000 Active
-
2025-08-13soldstatus $1,400,000
-
2025-07-22soldstatus $1,400,000 Closed
-
2025-05-14status Pending
-
2025-04-17price $1,495,000
-
2025-03-27price $1,565,000
-
2025-02-14status Active
-
2024-12-20$1,595,000 Active
-
2024-02-15$1,749,000 Active
-
2022-06-18soldstatus $1,125,000
-
2020-03-31soldstatus $600,000
ⓘ Source: listings_history table (triggers on properties + properties_extension) + one-shot
backfill from property_details.listing_events for pre-trigger history.
Tax reassessment forecast NY · Partial reset (capped growth)
- Current annual tax
- $9,454 · $788/mo
- Projected year-2 tax
- $21,112 · $1,759/mo
- Expected delta
- +$11,658/yr (+$971/mo · 123.3%)
ⓘ Screening estimate from a state-policy table — verify with the county assessor before closing.
Climate risk First Street
- Flood 1/10 Low FEMA zone X (unshaded) · 0% chance over 30 yrs
- Wildfire 1/10 Low
- Heat 4/10 Moderate 7 d/yr ≥89°F today · 19 d/yr by 30 yrs out
- Wind 8/10 Severe 80% chance of damaging wind over 30 yrs
- Air quality 3/10 Moderate 2 unhealthy d/yr today · 3 by 30 yrs out
Nearby sold comps map
Loading sold comps map…
Walkable amenities ~0.75 mi
Loading nearby amenities…
Taxation est. · year 1
- Rental income
- $244,070
- − Mortgage interest
- −$108,614
- − Property taxes
- −$9,454
- − Insurance
- −$9,695
- − Repairs & maintenance
- −$19,526
- − Management
- −$19,526
- − Depreciation
- −$56,407
- Taxable income
- $20,848
- Est. tax owed @ 24.0%
- −$5,004
- After-tax cash flow
- $46,643/yr
For passive investors: Depreciation is non-cash, so a rental often shows a tax loss while cash-flowing — sheltering income. Rental losses are passive: they offset passive income freely, and up to $25,000/yr can offset ordinary (W-2) income if you actively participate and your MAGI is under $100k (phasing out to $0 by $150k); unused losses carry forward. On sale, claimed depreciation is recaptured at up to 25%, and gains may owe capital-gains tax (a 1031 exchange can defer both). Figures are a year-1 estimate at your 24.0% rate — not tax advice; consult a CPA.
Schools (NCES district)
- District
- Springs Union Free School District
- NCES district ID
- 3627900
- Math proficiency
- 55% ▲ 6.00%
- Reading proficiency
- 60% ▲ 10.00%
- Median HH income
- $75,413
- Composite
- 51.42/100
- National rank
- #1728
- State rank
- #239 of 590 in NY
Livability — Springs
- Score
- 63/100
- State rank
- #809
- US rank
- #15666
Category grades
Schools grade is shown separately in the Schools card above.
Census & demographics
- Census place
- Springs, NY
- County
- Suffolk County · 679,920 people
- Metro
- New York-Newark-Jersey City, NY-NJ-PA
- Population (ZIP)
- 21,882
- Household income
- $129,883
- Rent vs Own
- Severe rent burden
- 896.0
Population outlook (Suffolk County) Hauer SSP2
- Today (2025)
- 1,505,262 people
- By 2030
- 1,498,318 · -0.5%
- By 2040
- 1,471,101 · -2.3%
- By 2050
- 1,424,848 · -5.3%
- By 2075
- 1,337,157 · -11.2%
- By 2100
- 1,217,720 · -19.1%
Race, ethnicity, and origin ACS 2023
- Neighborhood character
- Majority White (61%)
- Race & ethnicity
- White 61% Hispanic / Latino 32% Two or more races 23% Black 2% Asian 2%
- Hispanic origin (detail)
- Mexican 2% Puerto Rican 1%
- Common ancestry
- Romanian 5% Scotch-Irish 4% Italian 2%
- Foreign-born
- 25% · Canada, Guatemala, Jamaica
- Languages at home
- 68% English-only · Spanish 28% Other Indo-European 1% Russian/Polish/Slavic 1%
Political lean MEDSL · Suffolk
- 2024 margin
- Lean R (+10.0) · D 45.0% · R 55.0%
- 2008→2024 swing
- -16.0pp toward R · 2008: 6.0pp · 2024: -10.0pp
- All cycles
- 2024: R+10.0 2020: R+0.0 2016: R+8.2 2012: D+2.9 2008: D+6.0
Not yet ingested
- Civics
- —
Market trends
- HPI YoY
- ▼ -285.21%
- Current HPI
- 444.1499
- Rent YoY
- ▲ 12.28%
- Metro
- New York-Newark-Jersey City, NY-NJ-PA
- State GDP YoY
- ▲ 2.60%
- F500 in state
- 92
Industry mix (Fortune 500 HQ in NY)
| Industry | F500 HQs | Revenue |
|---|---|---|
| Financial Services | 10 | $950B |
|
||
| Consumer Goods | 9 | $162B |
|
||
| Insurance | 4 | $225B |
|
||
| Telecommunications | 2 | $144B |
|
||
| Pharmaceuticals | 2 | $112B |
|
||
| Media / Entertainment | 2 | $69B |
|
||
Price history
+223.2% since first listed14 events — show timeline
- 2026-04-24 Listed $1,939,000 OneKey® MLS as Distributed by MLS Grid
- 2025-09-15 Listed $1,950,000 OneKey® MLS as Distributed by MLS Grid
- 2025-09-15 Listing Removed — OneKey® MLS as Distributed by MLS Grid
- 2025-09-06 Listed $1,950,000 OneKey® MLS as Distributed by MLS Grid
- 2025-08-13 Sold (Public Records) $1,400,000 Public Records
- 2025-07-22 Sold (MLS) $1,400,000 OneKey® MLS as Distributed by MLS Grid
- 2025-05-14 Pending — OneKey® MLS as Distributed by MLS Grid
- 2025-04-17 Price Changed $1,495,000 OneKey® MLS as Distributed by MLS Grid
- 2025-03-27 Price Changed $1,565,000 OneKey® MLS as Distributed by MLS Grid
- 2025-02-14 Relisted — OneKey® MLS as Distributed by MLS Grid
- 2024-12-20 Listed $1,595,000 OneKey® MLS as Distributed by MLS Grid
- 2024-02-15 Listed $1,749,000 OneKey® MLS as Distributed by MLS Grid
- 2022-06-18 Sold (Public Records) $1,125,000 Public Records
- 2020-03-31 Sold (Public Records) $600,000 Public Records
Property tax history
+3.9%/yrLatest (2025): $9,454 · +0.0% YoY. Source: county tax records.
Cash-flow waterfall
monthlySold comps — $/sqft
last 12 mo · ≤1 miLoading sold comps…