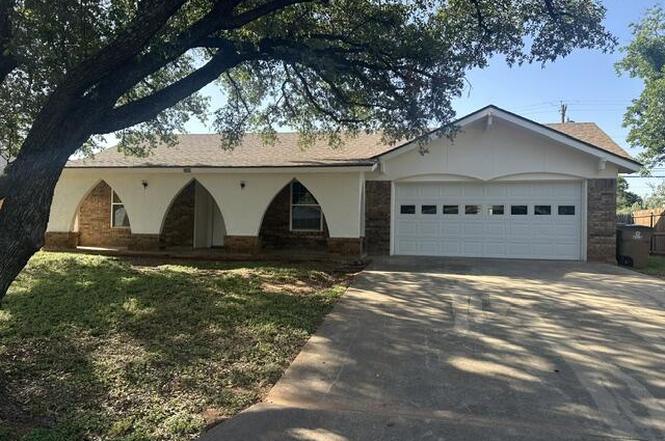
3909 Robin Hood Trl · San Angelo, TX
Flood risk 1/10 · Minimal
- FEMA flood zone
- X (unshaded)
- Chance of flooding over 30 yrs
- 0.0%
- Est. flood insurance / yr
- $507 – $1,088
Fire risk 7/10 · Major
- Est. fire insurance / yr
- $1,222 – $2,270
Heat risk 7/10 · Major
- Hot days now (above 104°F)
- 7 days/yr
- Hot days in 30 yrs
- 24 days/yr
Wind risk 4/10 · Minor
- Chance of severe wind over 30 yrs
- 14.0%
Air-quality risk 2/10 · Minimal
- Unhealthy air days now
- 0 days/yr
- Unhealthy air days in 30 yrs
- 1 days/yr
Risk factors via First Street. Map © Google.
Why this score? — see what drove the D grade
The composite is a weighted blend of 9 inputs, each scored 0–100. Each bar is that input's sub-score; the figure is the points it added to the 100-point composite (weight × sub-score).
- Appreciation +10.0/10.0
- ARV discount +9.3/15.0
- Cash flow +6.9/30.0
- Rent growth +3.9/5.0
- Livability +3.7/5.0
- Schools +2.6/10.0
- Condition / age +2.5/5.0
- 1% rule +2.4/10.0
- DSCR +1.1/10.0
$229,000
🖨 Deal sheet (PDF) 📄 Offer letter ✓ Due diligence
Listing remarks MLS
Great investment or starter home. 3 bedrooms, 2 baths, 2 living areas. Mature trees, privacy fence, 2-car garage. This one will absolutely go quickly.
Key facts
- Sliding glass door
- 7,667 sq ft lot
- 2 garage spots
Tags
Property features AI
Exterior
- Parking: Attached garage; 2-car garage; Driveway parking; On-street parking
- Security: Smoke detectors
- Utilities: Public water; Public sewer
- Home design: Single family residence; One story
- Construction: Brick and stucco construction; Composition roof; Slab foundation; Built on a 0.18-acre lot (approx. 60 x 120)
- Exterior features: Covered patio; Privacy fencing; Fenced yard; Paved city street frontage; Interior lot
Interior
- Kitchen: Electric range; Refrigerator
- Bedrooms: Total rooms: 8
- Flooring: Simulated wood; Tile; Vinyl
- Bathrooms: 2 full bathrooms
- Heating & cooling: Central heating (natural gas); Central electric cooling; Ceiling fans
- Interior features: Laminate counters; Ceiling fans; Double pane windows
- Laundry & utility: Washer hookup; Electric dryer hookup; Laundry area in garage
Neighborhood map
What this means for you Summary
Snapshot
- This is a 3-bed/2.0-bath single-family listed at $229k.
Deal economics
- At list price, monthly cash flow is $-350 ($-4k/yr) — negative.
- To cash-flow at today's rent, offer at most $167k (27.0% below list).
- To meet the 1% rule (rent ≥ 1% of price), the offer needs to be $169k (26.4% below list).
- Recommended offer: $167k (27.0% below list) — sets the bar for cash-flow.
Location & tenants
- Location reads 73/100 on livability (#199 in TX) — a middle-class / working-renter tenant base. Strengths: cost of living A+, housing A+, health & safety A+; Watch: employment C-, amenities F, commute F.
- San Angelo ISD (urban): math 27% / reading 33% proficiency, ranked #627 of 826 in TX (top 76%) — families likely to look elsewhere, expect single-tenant / working-renter base with shorter leases.
- Zoned schools: Mcgill El (math 42% / reading 42%, grade F, #1,335 of 4,322 statewide, top 33%, 306 students, 79% FRL); Lone Star Middle (math 28% / reading 32%, grade F, #1,056 of 1,662 statewide, top 65%, 903 students, 63% FRL); Central H S (math 22% / reading 43%, grade F, #1,029 of 1,632 statewide, top 64%, 3,065 students, 48% FRL).
- Market conditions: Rents rising fast (+5.8%/yr); 334 active listings in the ZIP; 27 comparable units currently listed for rent nearby; rentals at typical pace (median 23d on market — plan ~3-4 weeks tenant-placement turnaround); 48% of comp listings sitting > 30 days — soft ceiling on asking rent; 233 units permitted in Tom Green County in 2024 (0 in 5+ unit buildings).
Forward outlook
- In year one you build about $24k of equity ($2k loan paydown + $23k appreciation (10.0% local appreciation)).
- Tom Green County population projected at +35% by 2050 — long-run rental-demand tailwind backs the buy-and-hold thesis.
- By year 2, paydown + projected appreciation supports a ~$39k cash-out refi (75% LTV) — recoverable capital for the next deal without selling this one.
Negotiation context
- Only 2 days on market — expect competitive offers; lowballing is unlikely to land.
- 4 sale attempts since 14y ago with the ask held roughly flat each time — persistent listings suggest the price (not the market) is what's stuck; bring a comps-based counter.
Risks & watch-outs
- Climate carrying-cost: major wildfire risk; extreme-heat days projected 7→24/yr by 2055 (HVAC capex compounding) — expect insurance premiums to compound above CPI over the hold.
Questions for the listing agent
- What do current leases actually rent for vs. the listed asking? Can we see a recent rent roll and the last 12 months of T-12 income?
- Built in 1967 — when were the roof, HVAC, electrical panel, plumbing, and water heater last replaced?
- Is there a deadline driving the sale (1031 exchange, divorce, estate, relocation)? That informs how much negotiation room exists.
- Schools are F-rated, which usually means shorter tenancies and higher turnover. Who's the typical renter profile here, and what's been the actual vacancy rate?
- The area grade is low — what's the realistic commute time and amenity access for the typical tenant pool here? Any planned neighborhood developments (good or bad) we should know about?
- What's the average days-on-market for RENTAL listings here right now (not sales)? A rising rental-DOM trend means longer vacancies and softer asking-rent achievability than the comps imply.
- What's the recent tenant-quality profile in this submarket — average credit score on applications, eviction rate, late-payment / NSF rate, and stable-employment percentage? A property-management company in the area should have these aggregated.
- How much new for-sale + rental construction is in the pipeline within 1–3 miles? Heavy new supply typically softens prices + rents 12–24 months out; constrained supply supports both.
Investment metrics
- 1% rule
- 0.74% ✗
- Cap rate
- 4.46%
- Cash-on-cash
- -6.55%
- DSCR
- 0.71
- GRM
- 11.3
CMA / ARV
- ARV (on-the-fly)
- $238,784
- Comps found
- 12
Show comp detail 12 sales within ~0.75 mi
| Address | Dist | Beds/Ba | Sqft | Sold | Price | $/sf | Match |
|---|---|---|---|---|---|---|---|
| 271 Amistad Rd | 0.29mi | 3/2.0 | 1,446 (-1%) | 1mo | $239,250 | $165 | 84 |
| 242 Amistad Rd | 0.20mi | 3/2.0 | 1,531 (+5%) | 2mo | $237,000 | $155 | 81 |
| 237 Westwood Dr | 0.18mi | 3/2.0 | 1,566 (+8%) | 2mo | $259,900 | $166 | 78 |
| 3609 Clare Dr | 0.29mi | 4/2.0 (+1) | 1,428 (-2%) | 2mo | $240,000 | $168 | 76 |
| 3530 Old Post Rd | 0.63mi | 3/2.0 | 1,441 (-1%) | 3mo | $247,500 | $172 | 66 |
| 3613 Old Post Rd | 0.58mi | 3/2.0 | 1,330 (-9%) | 1mo | $215,000 | $162 | 57 |
| 3301 Oxford Dr | 0.58mi | 4/4.0 (+1) | 1,430 (-2%) | 2mo | $195,000 | $136 | 56 |
| 3313 Stanford Dr | 0.55mi | 3/2.0 | 1,265 (-13%) | 2mo | $225,000 | $178 | 51 |
| 3934 Millbrook Dr | 0.71mi | 3/2.0 | 1,599 (+10%) | 0mo | $250,000 | $156 | 50 |
| 3118 Hummingbird Ln | 0.65mi | 3/2.0 | 1,628 (+12%) | 2mo | $254,900 | $157 | 48 |
| 3805 Sandstone Rd | 0.62mi | 4/3.0 (+1) | 1,648 (+13%) | 1mo | $269,900 | $164 | 40 |
| 3621 Old Post Ct | 0.59mi | 3/4.0 | 1,658 (+14%) | 3mo | $246,000 | $148 | 39 |
Match score weights: distance 35% · size 25% · config 20% · recency 20%. Top-matched comps best support the ARV.
Projected returns pro-forma
10.0% appreciation · 5.78% rent growth · sell at horizon
- IRR
- 20.5%
- Equity multiple
- 2.67×
- Total profit
- $107,365
- Equity at exit
- $206,301
- IRR
- 19.3%
- Equity multiple
- 6.38×
- Total profit
- $344,875
- Equity at exit
- $444,897
Cash invested: $64,120 (down + closing). Projections, not guarantees.
Landlord ↔ Tenant lean methodology
- Overall (STATE)
- 87 Strongly Landlord-Friendly
- State Texas
- 87 Strongly Landlord-Friendly · R+5
- County
- — inherits STATE
- City
- — inherits STATE
ZIP-level market 76901
- Home prices YoY
- 6.4%
- Rents YoY
- 5.8%
- Active inventory
- 334
- Price-to-rent
- 11.3×
Monthly cashflow live
- Estimated rent
- $1,686 high interval (Pro) →
- Mortgage (P&I)
- −$1,201
- Tax from tax record
- −$385 /mo · $4,625/yr
- Insurance
- −$95
- HOA
- −$0
- Vacancy / Maint / Mgmt
- −$354
- Net cashflow
- $-350
Break-even live
Sensitivity live
| Price | -10% $-220 | -5% $-285 | +0% $-350 | +5% $-415 | +10% $-480 |
|---|---|---|---|---|---|
| Rent | -10% $-483 | -5% $-417 | +0% $-350 | +5% $-283 | +10% $-217 |
| Rate | -1.0pp $-235 | -0.5pp $-292 | base $-350 | +0.5pp $-409 | +1.0pp $-470 |
UW: 25.0% down · 7.5% · 30yr · 1.5% tax · 5.0% vac · 8.0% maint · 8.0% mgmt
Financing live
Cash to close
- Down payment
- $57,250
- Closing costs
- $6,870
- Reserves months
- —
- Total cash needed
- —
Loan-product check · same deal, 3 products live
Conventional
25% down · 7.5% · 30yr
- Down + closing
- —
- Monthly P&I
- —
- Monthly cashflow
- —
- DSCR
- —
- Eligible?
- —
Personal DTI + credit; lowest rate.
DSCR
20% down · 8.5% · 30yr
- Down + closing
- —
- Monthly P&I
- —
- Monthly cashflow
- —
- DSCR
- —
- Eligible?
- —
No personal income docs; deal must DSCR.
Hard money
10% down · 12.0% · 12mo
- Down + closing
- —
- Monthly P&I
- —
- Monthly cashflow
- —
- DSCR
- —
- Eligible?
- —
Short-term bridge; refi at stabilization.
Rent comps 27 comps
| Address | Beds | Baths | Sqft | Rent | $/sqft | DOM | Units | Dist |
|---|---|---|---|---|---|---|---|---|
| 279 Glenna Dr San Angelo, TX | 3.0 | 2.0 | 1625 | $1,795 | $1.10 | 23d | 1 | 0.27mi |
| 3755 Arden Rd San Angelo, TX | 2.0–3.0 | 1.0 | 875 | $1,025 | $1.17 | 23d | 1 | 0.38mi |
| 3801 Arden Rd Apt 108 San Angelo, TX | 2.0 | 2.0 | 1025 | $1,215 | $1.19 | 45d | 1 | 0.40mi |
| 3801 Arden Rd Apt 65 San Angelo, TX | 2.0 | 2.0 | 1025 | $1,199 | $1.17 | 23d | 1 | 0.40mi |
| 2431 College Hills Blvd San Angelo, TX | 1.0–3.0 | 1.0–2.0 | 1025 | $1,609 | $1.57 | 23d | 17 | 0.64mi |
| 3344 Trinity Ave San Angelo, TX | 3.0 | 2.0 | 1545 | $1,900 | $1.23 | 23d | 1 | 0.68mi |
| 3426 Millbrook Dr San Angelo, TX | 1.0–2.0 | 1.0–2.0 | 845 | $1,459 | $1.73 | 45d | 13 | 0.70mi |
| 3207 Trinity Ave San Angelo, TX | 3.0 | 2.0 | 1536 | $1,995 | $1.30 | 45d | 1 | 0.70mi |
| 4110 Wellington St San Angelo, TX | 1.0–2.0 | 1.0–2.0 | 881 | $1,145 | $1.30 | 23d | 4 | 0.87mi |
| 3609 High Meadow Dr San Angelo, TX | 2.0 | 2.0 | 1266 | $2,400 | $1.90 | 45d | 1 | 0.90mi |
| 2756 Sac Ave San Angelo, TX | 3.0 | 1.0 | 1461 | $1,650 | $1.13 | 45d | 1 | 0.92mi |
| 1210 Guthrie St San Angelo, TX | 3.0 | 2.0 | 1157 | $1,400 | $1.21 | 23d | 1 | 1.06mi |
| 5706 Stratford Ct San Angelo, TX | 4.0 | 2.0 | 1742 | $2,800 | $1.61 | 45d | 1 | 1.08mi |
| 2804 Abilene St San Angelo, TX | 3.0 | 2.0 | 1304 | $1,550 | $1.19 | 45d | 1 | 1.14mi |
| 2013 Rosemont Dr San Angelo, TX | 3.0 | 2.0 | 1400 | $2,100 | $1.50 | 23d | 1 | 1.21mi |
| 2630 Waco St San Angelo, TX | 3.0 | 2.0 | 1024 | $1,600 | $1.56 | 23d | 1 | 1.21mi |
| 1405 Hassell St San Angelo, TX | 3.0 | 2.0 | 1064 | $1,950 | $1.83 | 45d | 1 | 1.25mi |
| 707 Wicklow Ct San Angelo, TX | 3.0 | 2.0 | 1576 | $2,000 | $1.27 | 45d | 1 | 1.26mi |
| 2430 Rio Grande St San Angelo, TX | 3.0 | 1.0 | 1200 | $1,395 | $1.16 | 45d | 1 | 1.32mi |
| 2505 W Harris Ave San Angelo, TX | 2.0 | 2.0 | 1582 | $1,300 | $0.82 | 45d | 1 | 1.33mi |
| 5910 Southampton Pl San Angelo, TX | 3.0 | 2.0 | 1596 | $2,100 | $1.32 | 23d | 1 | 1.35mi |
| 3410 Wildewood Dr San Angelo, TX | 1.0–2.0 | 1.0–2.0 | 882 | $975 | $1.10 | 23d | 2 | 1.36mi |
| 5921 Stratford Ave San Angelo, TX | 3.0 | 2.0 | 1738 | $2,400 | $1.38 | 23d | 1 | 1.38mi |
| 2425 Waco St San Angelo, TX | 4.0 | 1.0 | 1225 | $1,395 | $1.14 | 45d | 1 | 1.40mi |
| 2629 Forest Park Ave San Angelo, TX | 3.0 | 2.0 | 1336 | $1,895 | $1.42 | 45d | 1 | 1.41mi |
| 4418 Southwest Blvd San Angelo, TX | 1.0–2.0 | 1.0 | 801 | $1,136 | $1.42 | 23d | 21 | 1.45mi |
| 3326 Rock Brook Dr San Angelo, TX | 1.0–2.0 | 1.0–2.0 | 886 | $1,205 | $1.36 | 23d | 13 | 1.47mi |
Listing history 3 events
-
2026-06-22days on market $229,000 Active 2 DOM
-
2026-06-19remarks 481-char remark
-
2026-06-19$229,000 Active 1 DOM
ⓘ Source: listings_history table (triggers on properties + properties_extension) + one-shot
backfill from property_details.listing_events for pre-trigger history.
Tax reassessment forecast TX · Resets to sale price
- Current annual tax
- $4,625 · $385/mo
- Projected year-2 tax
- $4,625 · $385/mo
- Expected delta
- $0/yr ($0/mo · 0.0%)
ⓘ Screening estimate from a state-policy table — verify with the county assessor before closing.
Climate risk First Street
- Flood 1/10 Low FEMA zone X (unshaded) · 0% chance over 30 yrs
- Wildfire 7/10 Severe
- Heat 7/10 Severe 7 d/yr ≥104°F today · 24 d/yr by 30 yrs out
- Wind 4/10 Moderate 14% chance of damaging wind over 30 yrs
- Air quality 2/10 Low 0 unhealthy d/yr today · 1 by 30 yrs out
Nearby sold comps map
Loading sold comps map…
Walkable amenities ~0.75 mi
Loading nearby amenities…
Taxation est. · year 1
- Rental income
- $20,230
- − Mortgage interest
- −$12,828
- − Property taxes
- −$4,625
- − Insurance
- −$1,145
- − Repairs & maintenance
- −$1,618
- − Management
- −$1,618
- − Depreciation
- −$6,662
- Taxable loss
- −$8,266
- Est. tax savings @ 24.0%
- +$1,984
- After-tax cash flow
- $-2,215/yr
For passive investors: Depreciation is non-cash, so a rental often shows a tax loss while cash-flowing — sheltering income. Rental losses are passive: they offset passive income freely, and up to $25,000/yr can offset ordinary (W-2) income if you actively participate and your MAGI is under $100k (phasing out to $0 by $150k); unused losses carry forward. On sale, claimed depreciation is recaptured at up to 25%, and gains may owe capital-gains tax (a 1031 exchange can defer both). Figures are a year-1 estimate at your 24.0% rate — not tax advice; consult a CPA.
Schools (NCES district)
- District
- San Angelo ISD
- NCES district ID
- 4838700
- Math proficiency
- 27% ▼ -9.00%
- Reading proficiency
- 33% ▼ -3.00%
- Median HH income
- $43,501
- Composite
- 25.56/100
- National rank
- #7427
- State rank
- #627 of 826 in TX
Livability — San Angelo
- Score
- 73/100
- State rank
- #199
- US rank
- #5030
Category grades
Schools grade is shown separately in the Schools card above.
Census & demographics
- Census place
- San Angelo, TX
- County
- Tom Green County · 113,188 people
- City population
- 81,357
- Metro
- San Angelo, TX
- Population (ZIP)
- 31,831
- Household income
- $69,450
- Rent vs Own
- Severe rent burden
- 1034.0
Population outlook (Tom Green County) Hauer SSP2
- Today (2025)
- 135,110 people
- By 2030
- 144,090 · +6.6%
- By 2040
- 162,561 · +20.3%
- By 2050
- 182,158 · +34.8%
- By 2075
- 232,274 · +71.9%
- By 2100
- 268,218 · +98.5%
Race, ethnicity, and origin ACS 2023
- Neighborhood character
- Majority White (55%)
- Race & ethnicity
- White 55% Hispanic / Latino 41% Two or more races 17% Black 2%
- Hispanic origin (detail)
- Mexican 38%
- Common ancestry
- Lithuanian 3% Slovak 3% Iranian 1%
- Foreign-born
- 5% · Canada
- Languages at home
- 77% English-only · Spanish 21% German/W. Germanic 1%
Political lean MEDSL · Tom Green
- 2024 margin
- Solid R (+48.0) · D 25.5% · R 73.5% · Other 1.0%
- 2008→2024 swing
- -6.3pp toward R · 2008: -41.7pp · 2024: -48.0pp
- All cycles
- 2024: R+48.0 2020: R+44.4 2016: R+47.9 2012: R+47.9 2008: R+41.7
Not yet ingested
- Civics
- —
Market trends
- HPI YoY
- ▲ 47.96%
- Current HPI
- 798.58
- Rent YoY
- ▲ 5.78%
- Metro
- San Angelo, TX
- State GDP YoY
- ▲ 3.95%
- F500 in state
- 110
Industry mix (Fortune 500 HQ in TX)
| Industry | F500 HQs | Revenue |
|---|---|---|
| Energy | 16 | $1,198B |
|
||
| Technology | 5 | $198B |
|
||
| Engineering / Construction | 4 | $72B |
|
||
| Energy Services | 3 | $60B |
|
||
| Utilities | 3 | $41B |
|
||
| Healthcare | 2 | $330B |
|
||
Price history
+110.1% since first listed10 events — show timeline
- 2026-06-19 Listed $229,000 SAAR TX
- 2025-02-27 Rental Removed $1,500 SAARTX
- 2025-02-16 Price Changed $1,500 SAARTX
- 2024-12-29 Listed for Rent $1,600 SAARTX
- 2021-07-09 Sold (Public Records) — Public Records
- 2021-07-09 Sold (MLS) — SAAR TX
- 2021-06-16 Listed $170,000 SAAR TX
- 2013-02-12 Sold (Public Records) — Public Records
- 2013-02-11 Sold (MLS) — SAAR TX
- 2012-11-20 Listed $109,000 SAAR TX
Property tax history
+4.3%/yrLatest (2025): $4,625 · +33.0% YoY. Source: county tax records.
Cash-flow waterfall
monthlySold comps — $/sqft
last 12 mo · ≤1 miLoading sold comps…