2632 NW 203rd St · Oklahoma City, OK
Flood risk 1/10 · Minimal
- FEMA flood zone
- X (unshaded)
- Chance of flooding over 30 yrs
- 0.0%
- Est. flood insurance / yr
- $507 – $1,088
Fire risk 4/10 · Minor
- Est. fire insurance / yr
- $2,463 – $4,575
Heat risk 6/10 · Moderate
- Hot days now (above 108°F)
- 7 days/yr
- Hot days in 30 yrs
- 19 days/yr
Wind risk 2/10 · Minimal
- Chance of severe wind over 30 yrs
- 4.0%
Air-quality risk 2/10 · Minimal
- Unhealthy air days now
- 1 days/yr
- Unhealthy air days in 30 yrs
- 1 days/yr
Risk factors via First Street. Map © Google.
Why this score? — see what drove the D grade
The composite is a weighted blend of 9 inputs, each scored 0–100. Each bar is that input's sub-score; the figure is the points it added to the 100-point composite (weight × sub-score).
- ARV discount +12.2/15.0
- Cash flow +10.8/30.0
- Schools +4.1/10.0
- Livability +4.0/5.0
- Condition / age +4.0/5.0
- 1% rule +3.3/10.0
- DSCR +3.1/10.0
- Rent growth +2.8/5.0
- Appreciation +0.0/10.0
$225,900
🖨 Deal sheet 📄 Offer letter ✓ Due diligence
Listing remarks
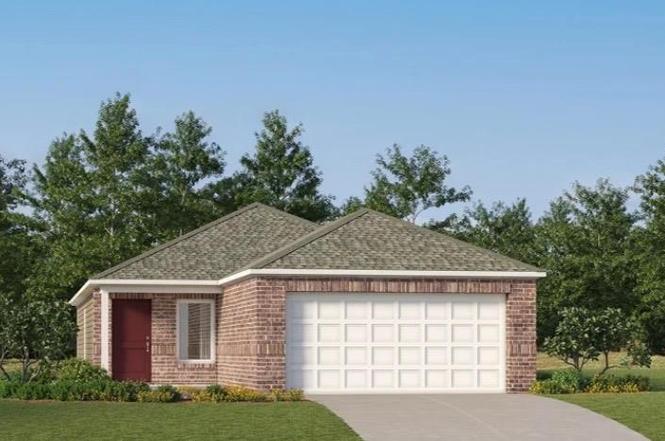
This single-level home showcases a spacious open floorplan shared between the kitchen, dining area and family room for easy entertaining during gatherings. An owner’s suite enjoys a private location in a rear corner of the home, complemented by an en-suite bathroom and walk-in closet. There are two secondary bedrooms along the side of the home, which are comfortable spaces for household members and overnight guests. Prices, dimensions and features may vary and are subject to change. Photos are for illustrative purposes only.
Key facts
- Walk-in closet
- Open floorplan
- Secondary bedrooms
Tags
Property features AI
Finance
- Other: Located in Antler Creek addition
- Financial info: Loan qualifying permitted; Not assumable
- HOA & community: Mandatory association dues; Association fee $350 (includes common area maintenance)
Exterior
- Parking: 2-car garage
- Utilities: Homestead eligibility
- Home design: Single family residence; One story; New home; Residential property
- Construction: Brick and frame construction; Shingle roof; Post tension foundation; Built by Lennar
- Exterior features: Interior lot; No additional exterior features listed
Interior
- Kitchen: Dining area (1)
- Bedrooms: 3 bedrooms
- Bathrooms: 2 full bathrooms
- Interior features: Open living area
Neighborhood map
What this means for you Summary
Snapshot
- This is a 3-bed/2.0-bath single-family listed at $226k. Condition is rated good.
Deal economics
- At list price, monthly cash flow is $-103 ($-1k/yr) — negative.
- To cash-flow at today's rent, offer at most $211k (6.6% below list).
- To meet the 1% rule (rent ≥ 1% of price), the offer needs to be $188k (16.7% below list).
- Recommended offer: $188k (16.7% below list) — sets the bar for 1% rule.
- Cap rate 5.7% vs local median 3.7% in Oklahoma City — top-decile yield for the area; either an underpriced asset or a hidden risk that comps aren't pricing in. Stress-test before assuming the spread holds.
Location & tenants
- Location reads 80/100 on livability (#3 in OK, #1,635 nationally) — a professional / high-income tenant draw. Strengths: amenities A+, commute A+, cost of living A+; Watch: crime F.
- Deer Creek (rural): math 41% / reading 44% proficiency, ranked #4 of 270 in OK (top 2%) — families likely to look elsewhere, expect single-tenant / working-renter base with shorter leases; only 7% free/reduced lunch — higher-income household profile.
- Zoned schools: Rose Union Es (math 72% / reading 52%, grade B, #6 of 845 statewide, top 1%, 606 students, 0% FRL); Deer Creek Hs (math 39% / reading 51%, grade D-, #13 of 447 statewide, top 3%, 2,036 students, 0% FRL).
- Market conditions: Rents rising (+1.2%/yr); 626 active listings in the ZIP; 28 comparable units currently listed for rent nearby; rentals leasing fast (median 4d on market — plan ~1-2 weeks tenant-placement turnaround); high-income renter base; 5,365 units permitted in Oklahoma County in 2024 (569 in 5+ unit buildings).
- This rent is only 18% of the median local income ($127k/yr) — well below the 30% rent-burden line; pricing power to push rent on renewal without tenant pushback.
Forward outlook
- Local home prices are declining (-3.0%/yr); year-one equity from $2k of loan paydown is wiped out by about $7k of value loss. Plan a longer hold.
- Oklahoma County population projected at +41% by 2050 — long-run rental-demand tailwind backs the buy-and-hold thesis.
Negotiation context
- Only 1 days on market — expect competitive offers; lowballing is unlikely to land.
Risks & watch-outs
- Climate carrying-cost: extreme-heat days projected 7→19/yr by 2055 (HVAC capex compounding) — expect insurance premiums to compound above CPI over the hold.
Questions for the listing agent
- What do current leases actually rent for vs. the listed asking? Can we see a recent rent roll and the last 12 months of T-12 income?
- What does the HOA fee cover, when was the last increase, and are there any pending special assessments or reserve-fund shortfalls?
- Is there a deadline driving the sale (1031 exchange, divorce, estate, relocation)? That informs how much negotiation room exists.
- Schools are F-rated, which usually means shorter tenancies and higher turnover. Who's the typical renter profile here, and what's been the actual vacancy rate?
- Crime grade is F in this area — have there been break-ins, vandalism, or insurance claims at this property in the last 3 years? What carrier currently insures it and at what premium?
- The area grade is low — what's the realistic commute time and amenity access for the typical tenant pool here? Any planned neighborhood developments (good or bad) we should know about?
- What's the average days-on-market for RENTAL listings here right now (not sales)? A rising rental-DOM trend means longer vacancies and softer asking-rent achievability than the comps imply.
- What's the recent tenant-quality profile in this submarket — average credit score on applications, eviction rate, late-payment / NSF rate, and stable-employment percentage? A property-management company in the area should have these aggregated.
- How much new for-sale + rental construction is in the pipeline within 1–3 miles? Heavy new supply typically softens prices + rents 12–24 months out; constrained supply supports both.
Investment metrics
- 1% rule
- 0.83% ✗
- Cap rate
- 5.75%
- Cash-on-cash
- -1.95%
- DSCR
- 0.91
- GRM
- 10.0
CMA / ARV
- ARV (on-the-fly)
- $251,934
- Comps found
- 12
Show comp detail 12 sales within ~0.75 mi
| Address | Dist | Beds/Ba | Sqft | Sold | Price | $/sf | Match |
|---|---|---|---|---|---|---|---|
| 19641 Ferris Dr | 0.43mi | 3/2.0 | 1,257 (-1%) | 2mo | $261,024 | $208 | 77 |
| 3021 NW 196th Pl | 0.45mi | 3/2.0 | 1,257 (-1%) | 2mo | $261,024 | $208 | 76 |
| 2928 NW 196th Pl | 0.49mi | 3/2.0 | 1,257 (-1%) | 1mo | $263,024 | $209 | 75 |
| 19621 Canning Rd | 0.51mi | 3/2.0 | 1,257 (-1%) | 3mo | $256,284 | $204 | 73 |
| 3016 NW 196th Pl | 0.48mi | 3/2.0 | 1,249 (-1%) | 4mo | $254,400 | $204 | 72 |
| 19629 Ferris Dr | 0.46mi | 3/2.0 | 1,347 (+6%) | 2mo | $268,064 | $199 | 67 |
| 3020 NW 196th Pl | 0.48mi | 3/2.0 | 1,347 (+6%) | 2mo | $268,144 | $199 | 65 |
| 19813 Brunswick Ct | 0.66mi | 3/2.0 | 1,260 (-0%) | 4mo | $222,000 | $176 | 65 |
| 2520 NW 199th St | 0.67mi | 3/2.0 | 1,282 (+1%) | 4mo | $250,000 | $195 | 64 |
| 2920 NW 196th Pl | 0.47mi | 3/2.0 | 1,347 (+6%) | 4mo | $261,200 | $194 | 64 |
| 2508 NW 199th St | 0.69mi | 3/2.0 | 1,360 (+7%) | 4mo | $253,000 | $186 | 52 |
| 19704 Forsythe Dr | 0.64mi | 3/2.0 | 1,453 (+15%) | 4mo | $248,000 | $171 | 42 |
Match score weights: distance 35% · size 25% · config 20% · recency 20%. Top-matched comps best support the ARV.
Projected returns pro-forma
-3.0% appreciation · 1.21% rent growth · sell at horizon
- IRR
- -21.6%
- Equity multiple
- 0.27×
- Total profit
- $-46,440
- Equity at exit
- $33,682
- IRR
- -20.2%
- Equity multiple
- 0.02×
- Total profit
- $-61,873
- Equity at exit
- $19,532
Cash invested: $63,252 (down + closing). Projections, not guarantees.
Landlord ↔ Tenant lean methodology
- Overall (STATE)
- 83 Strongly Landlord-Friendly
- State Oklahoma
- 83 Strongly Landlord-Friendly · R+20
- County
- — inherits STATE
- City
- — inherits STATE
ZIP-level market 73012
- Home prices YoY
- -17.9%
- Rents YoY
- 1.2%
- Active inventory
- 626
- Price-to-rent
- 10.0×
Monthly cashflow live
- Estimated rent
- $1,883 high interval (Pro) →
- Mortgage (P&I)
- −$1,185
- Tax est. 1.5%
- −$282 /mo · $3,388/yr
- Insurance
- −$94
- HOA
- −$29
- Vacancy / Maint / Mgmt
- −$395
- Net cashflow
- $-103
Break-even live
UW: 25.0% down · 7.5% · 30yr · 1.5% tax · 5.0% vac · 8.0% maint · 8.0% mgmt
Financing live
Cash to close
- Down payment
- $56,475
- Closing costs
- $6,777
- Reserves months
- —
- Total cash needed
- —
Loan-product check · same deal, 3 products live
Conventional
25% down · 7.5% · 30yr
- Down + closing
- —
- Monthly P&I
- —
- Monthly cashflow
- —
- DSCR
- —
- Eligible?
- —
Personal DTI + credit; lowest rate.
DSCR
20% down · 8.5% · 30yr
- Down + closing
- —
- Monthly P&I
- —
- Monthly cashflow
- —
- DSCR
- —
- Eligible?
- —
No personal income docs; deal must DSCR.
Hard money
10% down · 12.0% · 12mo
- Down + closing
- —
- Monthly P&I
- —
- Monthly cashflow
- —
- DSCR
- —
- Eligible?
- —
Short-term bridge; refi at stabilization.
Rent comps 28 comps
| Address | Beds | Baths | Sqft | Rent | $/sqft | DOM | Units | Dist |
|---|---|---|---|---|---|---|---|---|
| 19804 Canning Ct Edmond, OK | 3.0 | 2.0 | 1875 | $2,595 | $1.38 | 17d | 1 | 0.33mi |
| 19717 Whitley Rd Edmond, OK | 4.0 | 2.0 | 1701 | $1,995 | $1.17 | 17d | 1 | 0.42mi |
| 19629 Ferris Dr Edmond, OK | 3.0 | 2.0 | 1347 | $1,850 | $1.37 | 23d | 1 | 0.44mi |
| 2941 NW 195th St Edmond, OK | 3.0 | 2.0 | 1342 | $1,695 | $1.26 | 4d | 1 | 0.48mi |
| 2945 NW 195th St Edmond, OK | 3.0 | 2.0 | 1253 | $1,650 | $1.32 | 4d | 1 | 0.48mi |
| 19501 Conway Dr Edmond, OK | 3.0 | 2.0 | 1253 | $1,650 | $1.32 | 4d | 1 | 0.50mi |
| 19505 Conway Dr Edmond, OK | 3.0 | 2.0 | 1342 | $1,695 | $1.26 | 23d | 1 | 0.50mi |
| 19513 Conway Dr Edmond, OK | 3.0 | 2.0 | 1253 | $1,650 | $1.32 | 23d | 1 | 0.50mi |
| 19521 Conway Dr Edmond, OK | 3.0 | 2.0 | 1253 | $1,650 | $1.32 | 23d | 1 | 0.50mi |
| 19509 Conway Dr Edmond, OK | 3.0 | 2.0 | 1342 | $1,695 | $1.26 | 4d | 1 | 0.50mi |
| 2925 NW 195th St Edmond, OK | 3.0 | 2.0 | 1342 | $1,695 | $1.26 | 23d | 1 | 0.55mi |
| 2921 NW 195th St Edmond, OK | 3.0 | 2.0 | 1342 | $1,695 | $1.26 | 10d | 1 | 0.55mi |
| 19613 Bolton Rd Edmond, OK | 3.0 | 2.0 | 1340 | $1,795 | $1.34 | 1d | 1 | 0.56mi |
| 19708 Barrister Cir Edmond, OK | 3.0 | 2.0 | 1257 | $1,595 | $1.27 | 1d | 1 | 0.65mi |
| 19704 Taggert Dr Edmond, OK | 3.0 | 2.0 | 1330 | $1,645 | $1.24 | 4d | 1 | 0.74mi |
| 19217 Garden Creek Ln Edmond, OK | 4.0 | 2.0 | 1828 | $2,045 | $1.12 | 10d | 1 | 0.82mi |
| 2800 NW 192nd St Edmond, OK | 1.0–2.0 | 1.0–2.0 | 1118 | $2,270 | $2.03 | 1d | 11 | 0.85mi |
| 19704 Vivace Dr Edmond, OK | 3.0 | 2.0 | 1450 | $1,699 | $1.17 | 1d | 1 | 0.86mi |
| 2364 NW 197th St Edmond, OK | 3.0 | 2.0 | 1250 | $1,595 | $1.28 | 1d | 1 | 0.90mi |
| 2317 NW 198th St Edmond, OK | 3.0 | 2.0 | 1320 | $1,700 | $1.29 | 23d | 1 | 0.95mi |
| 19601 N Pennsylvania Ave Edmond, OK | 3.0 | 2.5 | 1441 | $1,745 | $1.21 | 1d | 1 | 1.21mi |
| 19501 N Pennsylvania Ave Edmond, OK | 2.0–3.0 | 1.0–2.0 | 1122 | $1,750 | $1.56 | 1d | 11 | 1.23mi |
| 3005 NW 183rd St Edmond, OK | 3.0 | 2.0 | 1320 | $1,650 | $1.25 | 2d | 1 | 1.30mi |
| 2145 Scissortail Landing Dr Edmond, OK | 4.0 | 2.0 | 1800 | $1,795 | $1.00 | 1d | 1 | 1.32mi |
| 18613 Vivo Dr Edmond, OK | 3.0 | 2.0 | 1682 | $1,995 | $1.19 | 19d | 1 | 1.32mi |
| 2344 Roca Dr Edmond, OK | 3.0 | 2.0 | 1213 | $1,650 | $1.36 | 11d | 1 | 1.37mi |
| 18509 Agua Dr Edmond, OK | 3.0 | 2.0 | 1595 | $1,800 | $1.13 | 1d | 1 | 1.39mi |
| 18321 Groveton Blvd Edmond, OK | 3.0 | 2.0 | 1739 | $2,200 | $1.27 | 17d | 1 | 1.42mi |
HOA detail
- Monthly dues
- $29 · $348/yr
Listing history 2 events
-
2026-06-18remarks 530-char remark
-
2026-06-18$225,900 Active 1 DOM
ⓘ Source: listings_history table (triggers on properties + properties_extension) + one-shot
backfill from property_details.listing_events for pre-trigger history.
Climate risk First Street
- Flood 1/10 Low FEMA zone X (unshaded) · 0% chance over 30 yrs
- Wildfire 4/10 Moderate
- Heat 6/10 Major 7 d/yr ≥108°F today · 19 d/yr by 30 yrs out
- Wind 2/10 Low 4% chance of damaging wind over 30 yrs
- Air quality 2/10 Low 1 unhealthy d/yr today · 1 by 30 yrs out
Nearby sold comps map
Loading sold comps map…
Walkable amenities ~0.75 mi
Loading nearby amenities…
Taxation est. · year 1
- Rental income
- $22,592
- − Mortgage interest
- −$12,654
- − Property taxes
- −$3,388
- − Insurance
- −$1,130
- − Repairs & maintenance
- −$1,807
- − Management
- −$1,807
- − HOA
- −$348
- − Depreciation
- −$6,572
- Taxable loss
- −$5,114
- Est. tax savings @ 24.0%
- +$1,227
- After-tax cash flow
- $-7/yr
For passive investors: Depreciation is non-cash, so a rental often shows a tax loss while cash-flowing — sheltering income. Rental losses are passive: they offset passive income freely, and up to $25,000/yr can offset ordinary (W-2) income if you actively participate and your MAGI is under $100k (phasing out to $0 by $150k); unused losses carry forward. On sale, claimed depreciation is recaptured at up to 25%, and gains may owe capital-gains tax (a 1031 exchange can defer both). Figures are a year-1 estimate at your 24.0% rate — not tax advice; consult a CPA.
Condition & rehab AI · 11 photos
This single-level home features a spacious open floorplan with modern finishes and a good condition. It is ready for a new owner or tenant with minor maintenance items to address.
Value-add opportunities
- Resale Paint exterior trim — Enhances curb appeal and value
- Rental Replace window screens — Improves comfort and energy efficiency
Renovation cost estimate screening
Value-add ROI direction
- Resale Paint exterior trim — Enhances curb appeal and value ↑
- Rental Replace window screens — Improves comfort and energy efficiency ↑
ⓘ Cost ranges are severity-bucket heuristics (US national rule-of-thumb). Get contractor quotes + a written scope before underwriting a rehab budget.
Schools (NCES district)
- District
- Deer Creek
- NCES district ID
- 4009570
- Math proficiency
- 41% ▼ -16.00%
- Reading proficiency
- 44% ▼ -14.00%
- Median HH income
- $101,218
- Composite
- 41.46/100
- National rank
- #3465
- State rank
- #4 of 270 in OK
Livability — Oklahoma City
- Score
- 80/100
- State rank
- #3
- US rank
- #1635
Category grades
Schools grade is shown separately in the Schools card above.
Census & demographics
- County
- Oklahoma County · 771,644 people
- City population
- 498,656
- Metro
- Oklahoma City, OK
- Population (ZIP)
- 46,993
- Household income
- $126,659
- Rent vs Own
- Severe rent burden
- 898.0
Population outlook (Oklahoma County) Hauer SSP2
- Today (2025)
- 911,875 people
- By 2030
- 982,413 · +7.7%
- By 2040
- 1,130,468 · +24.0%
- By 2050
- 1,288,422 · +41.3%
- By 2075
- 1,711,482 · +87.7%
- By 2100
- 2,088,448 · +129.0%
Race, ethnicity, and origin ACS 2023
- Neighborhood character
- Predominantly White (67%)
- Race & ethnicity
- White 67% Two or more races 10% Black 8% Asian 8% Hispanic / Latino 8% Native American 2%
- Hispanic origin (detail)
- Mexican 5%
- Common ancestry
- Italian 3% Slovak 2% Romanian 2%
- Foreign-born
- 11% · Canada, China, Vietnam
- Languages at home
- 86% English-only · Spanish 4% Other Indo-European 2% Chinese 2%
Political lean MEDSL · Oklahoma
- 2024 margin
- Toss-up / Even · D 48.0% · R 49.7% · Other 2.3%
- 2008→2024 swing
- +15.1pp toward D · 2008: -16.8pp · 2024: -1.7pp
- All cycles
- 2024: R+1.7 2020: R+1.1 2016: R+10.5 2012: R+16.7 2008: R+16.8
Not yet ingested
- Civics
- —
Market trends
- HPI YoY
- ▼ -44.41%
- Current HPI
- 203.1105
- Rent YoY
- ▲ 1.21%
- Metro
- Oklahoma City, OK
- State GDP YoY
- ▲ 1.55%
- F500 in state
- 6
Industry mix (Fortune 500 HQ in OK)
| Industry | F500 HQs | Revenue |
|---|---|---|
| Energy | 3 | $48B |
|
||
Price history
1 event — show timeline
- 2026-06-18 Listed $225,900 MLSOK
Cash-flow waterfall
monthlySold comps — $/sqft
last 12 mo · ≤1 miLoading sold comps…