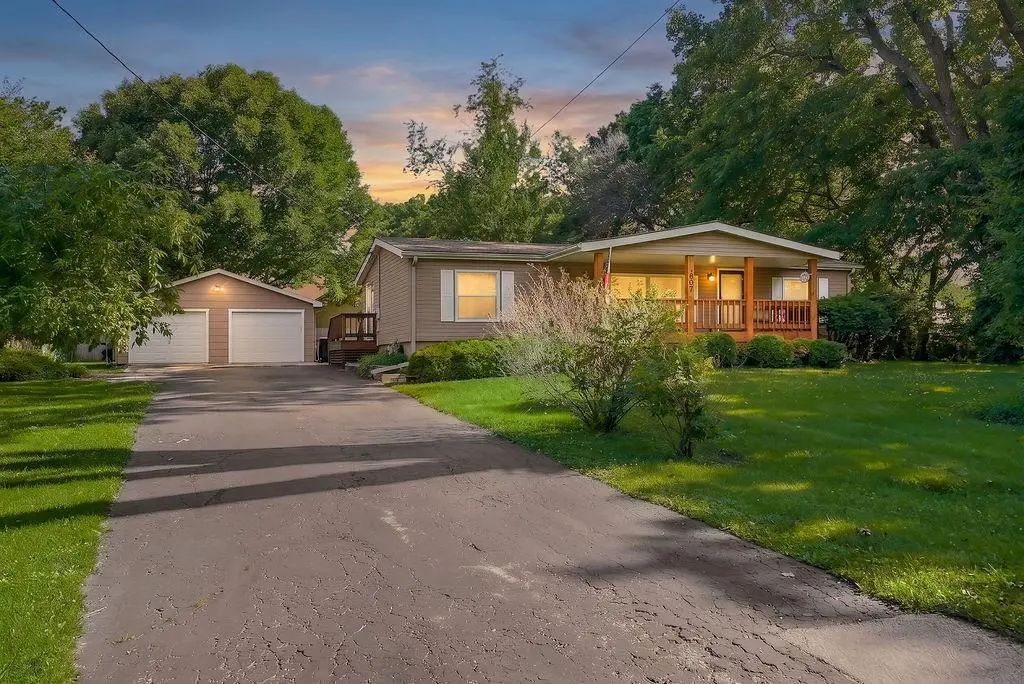
807 Chestnut St · Greenwood, MO
Flood risk 1/10 · Minimal
- FEMA flood zone
- X (unshaded)
- Chance of flooding over 30 yrs
- 0.0%
- Est. flood insurance / yr
- $473 – $860
Fire risk 3/10 · Minor
- Est. fire insurance / yr
- $1,054 – $1,958
Heat risk 4/10 · Minor
- Hot days now (above 107°F)
- 7 days/yr
- Hot days in 30 yrs
- 17 days/yr
Wind risk 2/10 · Minimal
- Chance of severe wind over 30 yrs
- —
Air-quality risk 2/10 · Minimal
- Unhealthy air days now
- 1 days/yr
- Unhealthy air days in 30 yrs
- 2 days/yr
Risk factors via First Street. Map © Google.
Why this score? — see what drove the C- grade
The composite is a weighted blend of 9 inputs, each scored 0–100. Each bar is that input's sub-score; the figure is the points it added to the 100-point composite (weight × sub-score).
- Cash flow +21.2/30.0
- ARV discount +7.5/15.0
- DSCR +6.8/10.0
- 1% rule +5.5/10.0
- Schools +4.6/10.0
- Livability +3.4/5.0
- Rent growth +2.5/5.0
- Condition / age +2.5/5.0
- Appreciation +0.0/10.0
$189,900
🖨 Deal sheet 📄 Offer letter ✓ Due diligence
Listing remarks
Beautifully situated in a peaceful, treed setting, this charming Ranch home offers 3 bedrooms, 2 full baths, and comfortable one-level living. Located on a quiet street, the home features main-floor laundry, a spacious unfinished basement ready for your personal touch, and a detached 2-car garage/workshop with plenty of room for storage, projects, or hobbies. Relax and enjoy the outdoors from the large covered front porch, perfect for morning coffee or evening sunsets. All appliances stay, making this home move-in ready. Enjoy the privacy and tranquility of country-style living while still being conveniently located near everyday amenities.
Key facts
- Ranch home
- Country-style living
- Main-floor laundry
Tags
Property features AI
Finance
- Other: Living area approximately 1,344 (per public records); Age approximately 31-40 years; Lot approximately 15,655 square feet (about 101 x 155)
Exterior
- Parking: Detached 2-car garage
- Utilities: Public water; Public sewer
- Home design: Single-family residence (manufactured); Ranch floor plan; North-facing
- Construction: Wood siding construction; Composition roof; Has a full basement
- Exterior features: Level lot; Outbuilding; Paved road with public maintenance; Not in a flood plain
Interior
- Kitchen: Equipped with dishwasher, microwave, electric range, and refrigerator
- Bedrooms: 3 bedrooms
- Flooring: Carpet flooring
- Bathrooms: 2 full bathrooms
- Heating & cooling: Forced air heating; Electric cooling (air conditioning)
- Interior features: Dishwasher; Dryer; Microwave; Refrigerator; Electric Range; Washer; Breakfast area
- Laundry & utility: Laundry available on main level and bedroom level
Neighborhood map
What this means for you Summary
Snapshot
- This is a 3-bed/2.0-bath manufactured listed at $190k.
Deal economics
- At list price, monthly cash flow is $276 ($3k/yr) — positive.
- The deal already cash-flows at list — no discount required.
- Meets the 1% rule at list price ($2k rent vs $190k).
- Cap rate 8.0% vs local median 4.1% in Greenwood — top-decile yield for the area; either an underpriced asset or a hidden risk that comps aren't pricing in. Stress-test before assuming the spread holds.
Location & tenants
- Location reads 67/100 on livability (#219 in MO) — a middle-class / working-renter tenant base. Strengths: crime A+, employment A+, housing A+; Watch: amenities F, commute F, health & safety F.
- Lee'S Summit R-VII (suburban): math 46% / reading 55% proficiency, ranked #23 of 324 in MO (top 7%) — acceptable for families but not a draw, mixed tenant base, ~2y average lease; only 16% free/reduced lunch — higher-income household profile.
- Zoned schools: Greenwood Elem. (math 51% / reading 54%, grade C-, #226 of 1,115 statewide, top 21%, 333 students, 18% FRL) — zoned schools at 18% FRL track the district average.
- Market conditions: 86 active listings in the ZIP; 6 comparable units currently listed for rent nearby; rentals leasing fast (median 11d on market — plan ~1-2 weeks tenant-placement turnaround); high-income renter base; 4,002 units permitted in Jackson County in 2024 (2,271 in 5+ unit buildings).
Forward outlook
- Local home prices are declining (-3.0%/yr); year-one equity from $1k of loan paydown is wiped out by about $6k of value loss. Plan a longer hold.
- Jackson County population projected at +4% by 2050 — modest demand growth; plan on rents tracking national, not racing it.
Negotiation context
- Only 1 days on market — expect competitive offers; lowballing is unlikely to land.
Questions for the listing agent
- Is there a deadline driving the sale (1031 exchange, divorce, estate, relocation)? That informs how much negotiation room exists.
- Schools are B-rated — typically a magnet for longer-tenancy family renters. What's the average tenant stay here, and is there a school-zone premium baked into asking?
- What's the average days-on-market for RENTAL listings here right now (not sales)? A rising rental-DOM trend means longer vacancies and softer asking-rent achievability than the comps imply.
- What's the recent tenant-quality profile in this submarket — average credit score on applications, eviction rate, late-payment / NSF rate, and stable-employment percentage? A property-management company in the area should have these aggregated.
- How much new for-sale + rental construction is in the pipeline within 1–3 miles? Heavy new supply typically softens prices + rents 12–24 months out; constrained supply supports both.
Investment metrics
- 1% rule
- 1.05% ✓
- Cap rate
- 8.04%
- Cash-on-cash
- 6.23%
- DSCR
- 1.28
- GRM
- 7.9
CMA / ARV
No comps found within radius.
Projected returns pro-forma
-3.0% appreciation · 3.0% rent growth · sell at horizon
- IRR
- -6.7%
- Equity multiple
- 0.75×
- Total profit
- $-13,177
- Equity at exit
- $28,315
- IRR
- 2.9%
- Equity multiple
- 1.21×
- Total profit
- $11,241
- Equity at exit
- $16,419
Cash invested: $53,172 (down + closing). Projections, not guarantees.
Landlord ↔ Tenant lean methodology
- Overall (STATE)
- 81 Strongly Landlord-Friendly
- State Missouri
- 81 Strongly Landlord-Friendly · R+10
- County
- — inherits STATE
- City
- — inherits STATE
ZIP-level market 64034
- Home prices YoY
- -26.7%
- Active inventory
- 86
- Price-to-rent
- 7.9×
Monthly cashflow live
- Estimated rent
- $1,992 high interval (Pro) →
- Mortgage (P&I)
- −$996
- Tax from tax record
- −$223 /mo · $2,672/yr
- Insurance
- −$79
- HOA
- −$0
- Vacancy / Maint / Mgmt
- −$418
- Net cashflow
- $276
Break-even live
UW: 25.0% down · 7.5% · 30yr · 1.5% tax · 5.0% vac · 8.0% maint · 8.0% mgmt
Financing live
Cash to close
- Down payment
- $47,475
- Closing costs
- $5,697
- Reserves months
- —
- Total cash needed
- —
Loan-product check · same deal, 3 products live
Conventional
25% down · 7.5% · 30yr
- Down + closing
- —
- Monthly P&I
- —
- Monthly cashflow
- —
- DSCR
- —
- Eligible?
- —
Personal DTI + credit; lowest rate.
DSCR
20% down · 8.5% · 30yr
- Down + closing
- —
- Monthly P&I
- —
- Monthly cashflow
- —
- DSCR
- —
- Eligible?
- —
No personal income docs; deal must DSCR.
Hard money
10% down · 12.0% · 12mo
- Down + closing
- —
- Monthly P&I
- —
- Monthly cashflow
- —
- DSCR
- —
- Eligible?
- —
Short-term bridge; refi at stabilization.
Rent comps 6 comps
| Address | Beds | Baths | Sqft | Rent | $/sqft | DOM | Units | Dist |
|---|---|---|---|---|---|---|---|---|
| 1501 Allendale Dr Greenwood, MO | 3.0 | 3.0 | 1333 | $2,055 | $1.54 | 14d | 1 | 0.42mi |
| 401 20th Ave S Greenwood, MO | 4.0 | 2.0 | 1518 | $1,450 | $0.96 | 10d | 1 | 0.70mi |
| 1902 Brent Ln Greenwood, MO | 3.0 | 3.0 | 1840 | $2,373 | $1.29 | 14d | 1 | 0.70mi |
| 122 Court Dr Greenwood, MO | 2.0 | 1.0 | 950 | $897 | $0.94 | 1d | 1 | 0.71mi |
| 400 20th Ave S Greenwood, MO | 4.0 | 2.0 | 1680 | $1,950 | $1.16 | 10d | 1 | 0.71mi |
| 503 E Main St Unit 122 Greenwood, MO | 2.0 | 1.0 | 950 | $897 | $0.94 | 1d | 1 | 0.75mi |
Listing history 2 events
-
2026-06-05remarks 648-char remark
-
2026-06-05$189,900 Pending 1 DOM
ⓘ Source: listings_history table (triggers on properties + properties_extension) + one-shot
backfill from property_details.listing_events for pre-trigger history.
Tax reassessment forecast MO · Resets to sale price
- Current annual tax
- $2,672 · $223/mo
- Projected year-2 tax
- $2,672 · $223/mo
- Expected delta
- $0/yr ($0/mo · 0.0%)
ⓘ Screening estimate from a state-policy table — verify with the county assessor before closing.
Climate risk First Street
- Flood 1/10 Low FEMA zone X (unshaded) · 0% chance over 30 yrs
- Wildfire 3/10 Moderate
- Heat 4/10 Moderate 7 d/yr ≥107°F today · 17 d/yr by 30 yrs out
- Wind 2/10 Low
- Air quality 2/10 Low 1 unhealthy d/yr today · 2 by 30 yrs out
Nearby sold comps map
Loading sold comps map…
Walkable amenities ~0.75 mi
Loading nearby amenities…
Taxation est. · year 1
- Rental income
- $23,902
- − Mortgage interest
- −$10,637
- − Property taxes
- −$2,672
- − Insurance
- −$950
- − Repairs & maintenance
- −$1,912
- − Management
- −$1,912
- − Depreciation
- −$5,524
- Taxable income
- $295
- Est. tax owed @ 24.0%
- −$71
- After-tax cash flow
- $3,240/yr
For passive investors: Depreciation is non-cash, so a rental often shows a tax loss while cash-flowing — sheltering income. Rental losses are passive: they offset passive income freely, and up to $25,000/yr can offset ordinary (W-2) income if you actively participate and your MAGI is under $100k (phasing out to $0 by $150k); unused losses carry forward. On sale, claimed depreciation is recaptured at up to 25%, and gains may owe capital-gains tax (a 1031 exchange can defer both). Figures are a year-1 estimate at your 24.0% rate — not tax advice; consult a CPA.
Schools (NCES district)
- District
- Lee'S Summit R-VII
- NCES district ID
- 2918300
- Math proficiency
- 46% ▼ -12.00%
- Reading proficiency
- 55% ▼ -6.00%
- Median HH income
- $77,031
- Composite
- 45.75/100
- National rank
- #2570
- State rank
- #23 of 324 in MO
Livability — Greenwood
- Score
- 67/100
- State rank
- #219
- US rank
- #10843
Category grades
Schools grade is shown separately in the Schools card above.
Census & demographics
- Census place
- Greenwood, MO
- County
- Jackson County · 687,798 people
- City population
- 8,998
- Metro
- Kansas City, MO-KS
- Population (ZIP)
- 8,998
- Household income
- $120,041
- Rent vs Own
Population outlook (Jackson County) Hauer SSP2
- Today (2025)
- 719,589 people
- By 2030
- 731,456 · +1.6%
- By 2040
- 746,689 · +3.8%
- By 2050
- 749,289 · +4.1%
- By 2075
- 736,227 · +2.3%
- By 2100
- 668,210 · -7.1%
Race, ethnicity, and origin ACS 2023
- Neighborhood character
- Predominantly White (88%)
- Race & ethnicity
- White 88% Two or more races 6% Hispanic / Latino 4% Black 3%
- Common ancestry
- Italian 6% Iranian 2% Lithuanian 2%
- Foreign-born
- 1% · South Korea
Political lean MEDSL · Jackson
- 2024 margin
- D (+19.3) · D 58.9% · R 39.5% · Other 1.6%
- 2008→2024 swing
- -6.1pp toward R · 2008: 25.4pp · 2024: 19.3pp
- All cycles
- 2024: D+19.3 2020: D+22.0 2016: D+16.6 2012: D+19.0 2008: D+25.4
Not yet ingested
- Civics
- —
Market trends
- HPI YoY
- ▼ -92.32%
- Current HPI
- 252.9111
- Rent YoY
- —
- Metro
- Kansas City, MO-KS
- State GDP YoY
- ▲ 1.84%
- F500 in state
- 20
Industry mix (Fortune 500 HQ in MO)
| Industry | F500 HQs | Revenue |
|---|---|---|
| Healthcare | 1 | $163B |
|
||
| Insurance | 1 | $21B |
|
||
| Industrial Technology | 1 | $17B |
|
||
| Retail | 1 | $16B |
|
||
| Industrial Distribution | 1 | $10B |
|
||
| Utilities | 1 | $9B |
|
||
Price history
3 events — show timeline
- 2026-06-04 Pending — Heartland MLS as Distributed by MLS Grid
- 2026-06-03 Listed $189,900 Heartland MLS as Distributed by MLS Grid
- 1990-10-08 Sold (Public Records) — Public Records
Property tax history
+5.5%/yrLatest (2025): $2,672 · +12.7% YoY. Source: county tax records.
Cash-flow waterfall
monthlySold comps — $/sqft
last 12 mo · ≤1 miLoading sold comps…