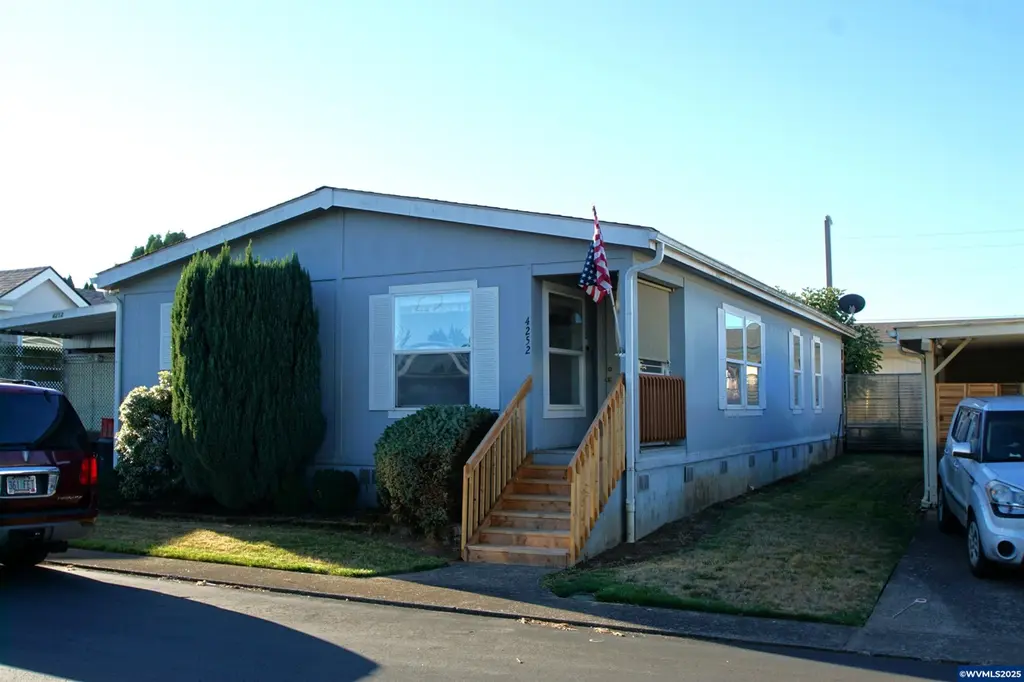
4252 Lemon St NE · Salem, OR
Flood risk 1/10 · Minimal
- FEMA flood zone
- X (unshaded)
- Chance of flooding over 30 yrs
- 0.0%
- Est. flood insurance / yr
- $507 – $1,088
Fire risk 1/10 · Minimal
- Est. fire insurance / yr
- $498 – $926
Heat risk 4/10 · Minor
- Hot days now (above 92°F)
- 7 days/yr
- Hot days in 30 yrs
- 14 days/yr
Wind risk 1/10 · Minimal
- Chance of severe wind over 30 yrs
- —
Air-quality risk 10/10 · Severe
- Unhealthy air days now
- 13 days/yr
- Unhealthy air days in 30 yrs
- 14 days/yr
Risk factors via First Street. Map © Google.
Why this score? — see what drove the C+ grade
The composite is a weighted blend of 9 inputs, each scored 0–100. Each bar is that input's sub-score; the figure is the points it added to the 100-point composite (weight × sub-score).
- Cash flow +30.0/30.0
- 1% rule +10.0/10.0
- DSCR +10.0/10.0
- Livability +4.0/5.0
- Schools +3.7/10.0
- Rent growth +2.5/5.0
- Condition / age +2.5/5.0
- ARV discount +0.0/15.0
- Appreciation +0.0/10.0
$75,000
🖨 Deal sheet 📄 Offer letter ✓ Due diligence
Listing remarks MLS
Open floorplan on this 2002 built home. Spacious bedrooms, primary has 2 closets, roomy bathroom with linen closet. Den (or bed #3), Large laundry room. Carport with an extra space for another car or make it an enclosed patio! Shop/storage room, storage shed in the yard. Rent includes water, sewer, garbage and clubhouse usage.
Key facts
- Open floorplan
- Roomy bathroom
- Large laundry room
Tags
Neighborhood map
What this means for you Summary
Snapshot
- This is a 3-bed/2.0-bath manufactured listed at $75k.
Deal economics
- At list price, monthly cash flow is $1k ($16k/yr) — positive.
- The deal already cash-flows at list — no discount required.
- Meets the 1% rule at list price ($2k rent vs $75k).
- Recommended offer: $66k (12.0% below list) — sets the bar for market timing.
- Cap rate 27.5% vs local median 2.9% in Salem — top-decile yield for the area; either an underpriced asset or a hidden risk that comps aren't pricing in. Stress-test before assuming the spread holds.
Location & tenants
- Location reads 79/100 on livability (#59 in OR, #2,084 nationally) — a middle-class / working-renter tenant base. Strengths: amenities A+, commute A+, housing A+; Watch: schools D, crime F.
- Salem-Keizer SD 24J (urban): math 34% / reading 47% proficiency, ranked #103 of 183 in OR (top 56%) — families likely to look elsewhere, expect single-tenant / working-renter base with shorter leases.
- Market conditions: 175 active listings in the ZIP; 9 comparable units currently listed for rent nearby; rentals leasing fast (median 14d on market — plan ~1-2 weeks tenant-placement turnaround); 1,591 units permitted in Marion County in 2024 (716 in 5+ unit buildings).
Forward outlook
- Local home prices are declining (-3.0%/yr); year-one equity from $519 of loan paydown is wiped out by about $2k of value loss. Plan a longer hold.
- Marion County population projected at +17% by 2050 — long-run rental-demand tailwind backs the buy-and-hold thesis.
- At projected returns (-3.0% appreciation + 3.0% rent growth), your $21k cash investment doubles in ~2 years — after that, you're playing with house money.
Negotiation context
- It's been on market 274 days — a 12% lower offer ($66k) is reasonable based on typical stale-listing flexibility.
- 3 sale attempts since 10y ago; this cycle's ask has dropped $23k (23%) from the opening price — seller is motivated, your offer sets the floor, not the list.
- Current owner paid $55k; 36% above their basis — modest negotiation headroom, anchor on the comps not their cost.
Questions for the listing agent
- It's been on market 274 days. Have you received any prior offers? Is the seller open to a 12% concession, seller financing, or rate buy-down credit?
- Why hasn't it sold? Are there any deal-killer items the seller is aware of (foundation, flood, title, zoning, code violations)?
- Is there a deadline driving the sale (1031 exchange, divorce, estate, relocation)? That informs how much negotiation room exists.
- Schools are D-rated, which usually means shorter tenancies and higher turnover. Who's the typical renter profile here, and what's been the actual vacancy rate?
- Crime grade is F in this area — have there been break-ins, vandalism, or insurance claims at this property in the last 3 years? What carrier currently insures it and at what premium?
- What's the average days-on-market for RENTAL listings here right now (not sales)? A rising rental-DOM trend means longer vacancies and softer asking-rent achievability than the comps imply.
- What's the recent tenant-quality profile in this submarket — average credit score on applications, eviction rate, late-payment / NSF rate, and stable-employment percentage? A property-management company in the area should have these aggregated.
- How much new for-sale + rental construction is in the pipeline within 1–3 miles? Heavy new supply typically softens prices + rents 12–24 months out; constrained supply supports both.
Investment metrics
- 1% rule
- 3.14% ✓
- Cap rate
- 27.48%
- Cash-on-cash
- 75.67%
- DSCR
- 4.37
- GRM
- 2.7
CMA / ARV
- ARV (median comp)
- $58,750
- List price
- $75,000
- Delta
- 27.66%
- Verdict
- OVERPRICED
- Comps
- 20 within 1.0 mi
Show comp detail 12 sales within ~0.75 mi
| Address | Dist | Beds/Ba | Sqft | Sold | Price | $/sf | Match |
|---|---|---|---|---|---|---|---|
| 4353 Lemon St NE | 0.11mi | 3/2.0 | 1,386 (-1%) | 4mo | $57,500 | $41 | 90 |
| 5422 Portland Rd NE #80 | 0.14mi | 3/2.0 | 1,344 (-4%) | 1mo | $81,000 | $60 | 86 |
| 5422 Portland Rd NE #47 | 0.14mi | 3/2.0 | 1,344 (-4%) | 4mo | $35,000 | $26 | 83 |
| 5422 Portland Rd NE #24 | 0.14mi | 2/2.0 (-1) | 1,440 (+3%) | 1mo | $60,000 | $42 | 83 |
| 5422 Portland Rd NE #139 | 0.14mi | 3/2.0 | 1,512 (+8%) | 3mo | $85,750 | $57 | 78 |
| 5287 Gold Dust St #222 | 0.32mi | 4/2.0 (+1) | 1,404 (0%) | 4mo | $136,850 | $97 | 77 |
| 5422 Portland Rd NE #37 | 0.14mi | 3/2.0 | 1,296 (-8%) | 4mo | $39,000 | $30 | 77 |
| 5422 Portland Rd NE #89 | 0.14mi | 3/2.0 | 1,536 (+9%) | 6mo | $104,000 | $68 | 73 |
| 4374 Larch Lp NE | 0.16mi | 2/2.0 (-1) | 1,536 (+9%) | 0mo | $99,900 | $65 | 72 |
| 5279 Gold Dust St NE #220 | 0.34mi | 3/2.0 | 1,512 (+8%) | 4mo | $130,000 | $86 | 68 |
| 5151 Copper Creek Loop #183 | 0.39mi | 3/2.0 | 1,512 (+8%) | 2mo | $130,000 | $86 | 67 |
| 4230 Hazelgreen Rd NE #52 | 0.06mi | 2/2.0 (-1) | 1,200 (-14%) | 3mo | $32,000 | $27 | 66 |
Match score weights: distance 35% · size 25% · config 20% · recency 20%. Top-matched comps best support the ARV.
Projected returns pro-forma
-3.0% appreciation · 3.0% rent growth · sell at horizon
- IRR
- 75.6%
- Equity multiple
- 4.44×
- Total profit
- $72,241
- Equity at exit
- $11,183
- IRR
- 79.3%
- Equity multiple
- 9.18×
- Total profit
- $171,709
- Equity at exit
- $6,485
Cash invested: $21,000 (down + closing). Projections, not guarantees.
Landlord ↔ Tenant lean methodology
- Overall (STATE)
- 28 Tenant-Leaning
- State Oregon
- 28 Tenant-Leaning · D+6
- County
- — inherits STATE
- City
- — inherits STATE
ZIP-level market 97305
- Active inventory
- 175
- Price-to-rent
- 2.7×
Monthly cashflow live
- Estimated rent
- $2,357 high interval (Pro) →
- Mortgage (P&I)
- −$393
- Tax from tax record
- −$113 /mo · $1,362/yr
- Insurance
- −$31
- HOA
- −$0
- Vacancy / Maint / Mgmt
- −$495
- Net cashflow
- $1,324
Break-even live
UW: 25.0% down · 7.5% · 30yr · 1.5% tax · 5.0% vac · 8.0% maint · 8.0% mgmt
Financing live
Cash to close
- Down payment
- $18,750
- Closing costs
- $2,250
- Reserves months
- —
- Total cash needed
- —
Loan-product check · same deal, 3 products live
Conventional
25% down · 7.5% · 30yr
- Down + closing
- —
- Monthly P&I
- —
- Monthly cashflow
- —
- DSCR
- —
- Eligible?
- —
Personal DTI + credit; lowest rate.
DSCR
20% down · 8.5% · 30yr
- Down + closing
- —
- Monthly P&I
- —
- Monthly cashflow
- —
- DSCR
- —
- Eligible?
- —
No personal income docs; deal must DSCR.
Hard money
10% down · 12.0% · 12mo
- Down + closing
- —
- Monthly P&I
- —
- Monthly cashflow
- —
- DSCR
- —
- Eligible?
- —
Short-term bridge; refi at stabilization.
Rent comps 9 comps
| Address | Beds | Baths | Sqft | Rent | $/sqft | DOM | Units | Dist |
|---|---|---|---|---|---|---|---|---|
| 5115 Countryside St NE Salem, OR | 3.0 | 1.0–2.0 | 876 | $2,260 | $2.58 | 13d | 20 | 0.48mi |
| 4115 Geranium Loop NE Salem, OR | 3.0 | 2.5 | 1316 | $2,250 | $1.71 | 13d | 1 | 0.75mi |
| 4927 Orbit Ave NE Salem, OR | 3.0 | 2.5 | 1598 | $2,395 | $1.50 | 21d | 1 | 0.86mi |
| 5034 Armstrong Ave NE Salem, OR | 3.0 | 2.5 | 1400 | $2,550 | $1.82 | 43d | 1 | 0.91mi |
| 4823 Settlers Dr NE Salem, OR | 3.0 | 2.0 | 1228 | $2,395 | $1.95 | 43d | 1 | 0.91mi |
| 5150 Constellation Ave NE Salem, OR | 3.0 | 2.0 | 1869 | $2,795 | $1.50 | 13d | 1 | 1.01mi |
| 4040 Hayesville Dr NE Salem, OR | 1.0–3.0 | 1.0–2.0 | 927 | $1,995 | $2.15 | 13d | 25 | 1.03mi |
| 4624 Lancaster Dr NE Salem, OR | 2.0–3.0 | 2.0–2.5 | 963 | $2,325 | $2.41 | 13d | 10 | 1.16mi |
| 4473 47th Ave NE Salem, OR | 3.0 | 1.0 | 1244 | $2,200 | $1.77 | 43d | 1 | 1.40mi |
Listing history 21 events
-
2026-06-18days on market $75,000 Active 274 DOM
-
2026-06-17days on market $75,000 Active 273 DOM
-
2026-06-16days on market $75,000 Active 272 DOM
-
2026-06-15days on market $75,000 Active 271 DOM
-
2026-06-14days on market $75,000 Active 269 DOM
-
2026-06-10days on market $75,000 Active 266 DOM
-
2026-06-09days on market $75,000 Active 265 DOM
-
2026-06-08days on market $75,000 Active 264 DOM
-
2026-06-07days on market $75,000 Active 263 DOM
-
2026-06-03days on market $75,000 Active 259 DOM
-
2026-06-02days on market $75,000 Active 258 DOM
-
2026-06-01days on market $75,000 Active 257 DOM
-
2026-05-31days on market $75,000 Active 256 DOM
-
2026-05-30days on market $75,000 Active 255 DOM
-
2026-03-11status Active 328-char remark
Show marketing remark (328 chars)
Open floorplan on this 2002 built home. Spacious bedrooms, primary has 2 closets, roomy bathroom with linen closet. Den (or bed #3), Large laundry room. Carport with an extra space for another car or make it an enclosed patio! Shop/storage room, storage shed in the yard. Rent includes water, sewer, garbage and clubhouse usage.
-
2026-03-02historical Active under Contract 328-char remark
Show marketing remark (328 chars)
Open floorplan on this 2002 built home. Spacious bedrooms, primary has 2 closets, roomy bathroom with linen closet. Den (or bed #3), Large laundry room. Carport with an extra space for another car or make it an enclosed patio! Shop/storage room, storage shed in the yard. Rent includes water, sewer, garbage and clubhouse usage.
-
2025-12-05price $75,000 328-char remark
Show marketing remark (328 chars)
Open floorplan on this 2002 built home. Spacious bedrooms, primary has 2 closets, roomy bathroom with linen closet. Den (or bed #3), Large laundry room. Carport with an extra space for another car or make it an enclosed patio! Shop/storage room, storage shed in the yard. Rent includes water, sewer, garbage and clubhouse usage.
-
2025-09-17$98,000 Active 328-char remark
Show marketing remark (328 chars)
Open floorplan on this 2002 built home. Spacious bedrooms, primary has 2 closets, roomy bathroom with linen closet. Den (or bed #3), Large laundry room. Carport with an extra space for another car or make it an enclosed patio! Shop/storage room, storage shed in the yard. Rent includes water, sewer, garbage and clubhouse usage.
-
2016-08-25soldstatus $55,000 Sold 386-char remark
Show marketing remark (386 chars)
A spacious open floor plan in this 2002 Double Wide. Bright and clean with vaulted ceilings throughout. Large master bedroom. Besides a second bedroom, there is a den area suitable for many uses. Includes washer and dryer, refrigerator, stove, newer window coverings. Located in an active community of Salem Mobile Estates. Yard with sprinkler system in place. A must see to appreciate.
-
2016-08-18historical Active under Contract 386-char remark
Show marketing remark (386 chars)
A spacious open floor plan in this 2002 Double Wide. Bright and clean with vaulted ceilings throughout. Large master bedroom. Besides a second bedroom, there is a den area suitable for many uses. Includes washer and dryer, refrigerator, stove, newer window coverings. Located in an active community of Salem Mobile Estates. Yard with sprinkler system in place. A must see to appreciate.
-
2016-08-09$55,000 Active 386-char remark
Show marketing remark (386 chars)
A spacious open floor plan in this 2002 Double Wide. Bright and clean with vaulted ceilings throughout. Large master bedroom. Besides a second bedroom, there is a den area suitable for many uses. Includes washer and dryer, refrigerator, stove, newer window coverings. Located in an active community of Salem Mobile Estates. Yard with sprinkler system in place. A must see to appreciate.
ⓘ Source: listings_history table (triggers on properties + properties_extension) + one-shot
backfill from property_details.listing_events for pre-trigger history.
Tax reassessment forecast OR · Resets to sale price
- Current annual tax
- $1,362 · $113/mo
- Projected year-2 tax
- $1,362 · $113/mo
- Expected delta
- $0/yr ($0/mo · 0.0%)
ⓘ Screening estimate from a state-policy table — verify with the county assessor before closing.
Climate risk First Street
- Flood 1/10 Low FEMA zone X (unshaded) · 0% chance over 30 yrs
- Wildfire 1/10 Low
- Heat 4/10 Moderate 7 d/yr ≥92°F today · 14 d/yr by 30 yrs out
- Wind 1/10 Low
- Air quality 10/10 Extreme 13 unhealthy d/yr today · 14 by 30 yrs out
Nearby sold comps map
Loading sold comps map…
Walkable amenities ~0.75 mi
Loading nearby amenities…
Taxation est. · year 1
- Rental income
- $28,289
- − Mortgage interest
- −$4,201
- − Property taxes
- −$1,362
- − Insurance
- −$375
- − Repairs & maintenance
- −$2,263
- − Management
- −$2,263
- − Depreciation
- −$2,182
- Taxable income
- $15,643
- Est. tax owed @ 24.0%
- −$3,754
- After-tax cash flow
- $12,137/yr
For passive investors: Depreciation is non-cash, so a rental often shows a tax loss while cash-flowing — sheltering income. Rental losses are passive: they offset passive income freely, and up to $25,000/yr can offset ordinary (W-2) income if you actively participate and your MAGI is under $100k (phasing out to $0 by $150k); unused losses carry forward. On sale, claimed depreciation is recaptured at up to 25%, and gains may owe capital-gains tax (a 1031 exchange can defer both). Figures are a year-1 estimate at your 24.0% rate — not tax advice; consult a CPA.
Schools (NCES district)
- District
- Salem-Keizer SD 24J
- NCES district ID
- 4110820
- Math proficiency
- 34% ▼ -1.00%
- Reading proficiency
- 47% ▼ -2.00%
- Median HH income
- $48,632
- Composite
- 37.16/100
- National rank
- #9017
- State rank
- #103 of 183 in OR
Livability — Salem
- Score
- 79/100
- State rank
- #59
- US rank
- #2084
Category grades
Schools grade is shown separately in the Schools card above.
Census & demographics
- Census place
- Salem, OR
- City population
- 193,601
- Population (ZIP)
- 45,044
Population outlook (Marion County) Hauer SSP2
- Today (2025)
- 360,940 people
- By 2030
- 375,178 · +3.9%
- By 2040
- 400,914 · +11.1%
- By 2050
- 422,187 · +17.0%
- By 2075
- 460,305 · +27.5%
- By 2100
- 464,025 · +28.6%
Race, ethnicity, and origin ACS 2023
- Neighborhood character
- Diverse neighborhood (Simpson 0.61)
- Race & ethnicity
- Hispanic / Latino 44% White 44% Two or more races 16% Asian 3% Pacific Islander 3% Native American 3% Black 1%
- Hispanic origin (detail)
- Mexican 41%
- Common ancestry
- Italian 2% Slovak 2% Scotch-Irish 2%
- Foreign-born
- 23% · Canada, China
- Languages at home
- 57% English-only · Spanish 35% Other Asian/Pacific 3% Russian/Polish/Slavic 2%
Political lean MEDSL · Marion
- 2024 margin
- Toss-up / Even · D 47.5% · R 49.5% · Other 3.0%
- 2008→2024 swing
- -4.2pp toward R · 2008: 2.2pp · 2024: -2.0pp
- All cycles
- 2024: R+2.0 2020: D+1.1 2016: R+5.0 2012: R+3.5 2008: D+2.2
Not yet ingested
- Civics
- —
Market trends
- HPI YoY
- ▼ -328.50%
- Current HPI
- 296.3428
- Rent YoY
- —
- Metro
- —
- State GDP YoY
- ▲ 2.05%
- F500 in state
- 2
Industry mix (Fortune 500 HQ in OR)
| Industry | F500 HQs | Revenue |
|---|---|---|
| Consumer Goods | 1 | $51B |
|
||
Price history
+36.4% since first listed7 events — show timeline
- 2026-03-11 Relisted — WVMLS
- 2026-03-02 Contingent — WVMLS
- 2025-12-05 Price Changed $75,000 WVMLS
- 2025-09-17 Listed $98,000 WVMLS
- 2016-08-25 Sold (MLS) $55,000 WVMLS
- 2016-08-18 Contingent — WVMLS
- 2016-08-09 Listed $55,000 WVMLS
Property tax history
+2.4%/yrLatest (2025): $1,362 · +7.7% YoY. Source: county tax records.
Cash-flow waterfall
monthlySold comps — $/sqft
last 12 mo · ≤1 miLoading sold comps…