5800 Sabal Trace Dr #801 · North Port, FL
Flood risk 5/10 · Moderate
- FEMA flood zone
- X (unshaded)
- Chance of flooding over 30 yrs
- 0.23%
- Est. flood insurance / yr
- $507 – $1,088
Fire risk 1/10 · Minimal
- Est. fire insurance / yr
- $947 – $1,759
Heat risk 10/10 · Severe
- Hot days now (above 107°F)
- 7 days/yr
- Hot days in 30 yrs
- 28 days/yr
Wind risk 10/10 · Severe
- Chance of severe wind over 30 yrs
- 99.0%
Air-quality risk 3/10 · Minor
- Unhealthy air days now
- 2 days/yr
- Unhealthy air days in 30 yrs
- 3 days/yr
Risk factors via First Street. Map © Google.
Why this score? — see what drove the D- grade
The composite is a weighted blend of 9 inputs, each scored 0–100. Each bar is that input's sub-score; the figure is the points it added to the 100-point composite (weight × sub-score).
- Cash flow +9.8/30.0
- ARV discount +7.5/15.0
- Schools +5.4/10.0
- 1% rule +5.0/10.0
- Livability +3.8/5.0
- DSCR +2.8/10.0
- Rent growth +2.6/5.0
- Condition / age +2.5/5.0
- Appreciation +0.0/10.0
$210,000
🖨 Deal sheet (PDF) 📄 Offer letter ✓ Due diligence
Listing remarks MLS
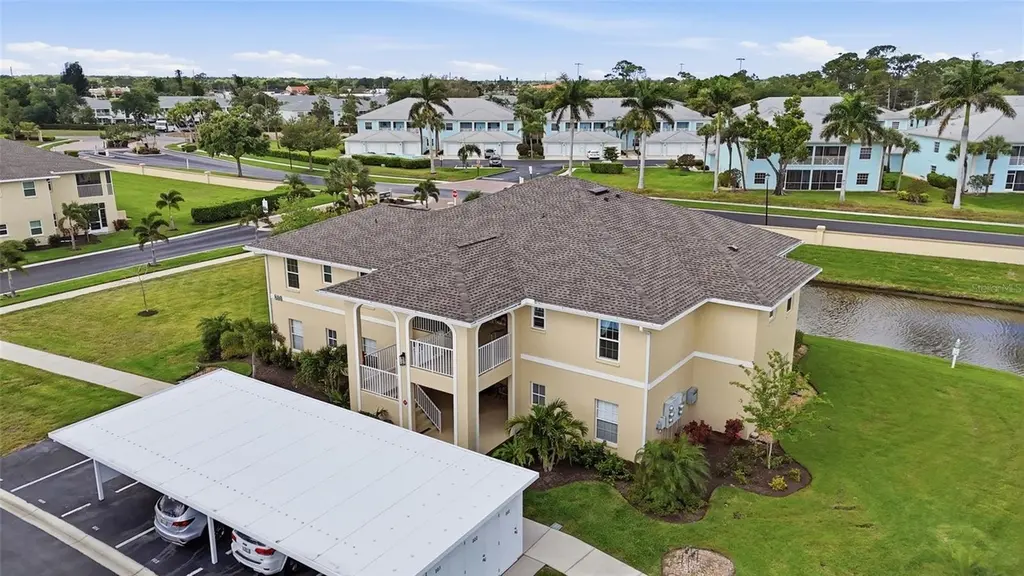
Welcome to your own slice of Florida living — a first floor 2-bedroom, 2-bath condo in the Sabal Trace community offering low-maintenance living with an open-concept living and dining area, a kitchen featuring stainless steel appliances, bright white cabinets and an appealing backsplash. The primary suite features high ceilings, a large walk in closet and balcony. Enjoy in-unit laundry and 1 covered parking spot. HOA dues cover exterior maintenance, landscaping, and access to community amenities. Centrally located in North Port, you’re just minutes from I-75 for quick trips to Sarasota and Port Charlotte, close to Myakka River State Park, Gulf Coast beaches, shopping, and dining. This home suits year-round living or a vacation property perfect for snow birds. Don’t miss this opportunity!
Key facts
- In-unit laundry
- First floor condo
- Open-concept living
Tags
Neighborhood map
What this means for you Summary
Snapshot
- This is a 2-bed/2.0-bath condo listed at $210k.
Deal economics
- At list price, monthly cash flow is $-136 ($-2k/yr) — negative.
- To cash-flow at today's rent, offer at most $186k (11.5% below list).
- To meet the 1% rule (rent ≥ 1% of price), the offer needs to be $209k (0.5% below list).
- Recommended offer: $186k (11.5% below list) — sets the bar for cash-flow.
- Cap rate 5.5% vs local median 3.8% in North Port — top-decile yield for the area; either an underpriced asset or a hidden risk that comps aren't pricing in. Stress-test before assuming the spread holds.
Location & tenants
- Location reads 75/100 on livability (#252 in FL, #3,975 nationally) — a middle-class / working-renter tenant base. Strengths: crime A+, housing A+, health & safety A+; Watch: amenities F, commute F.
- Sarasota (urban): math 63% / reading 63% proficiency, ranked #7 of 73 in FL (top 10%) — acceptable for families but not a draw, mixed tenant base, ~2y average lease.
- Zoned schools: Lamarque Elementary School (math 61% / reading 58%, grade B-, #690 of 2,144 statewide, top 34%, 1,073 students, 68% FRL); Heron Creek Middle School (math 54% / reading 52%, grade C+, #209 of 571 statewide, top 37%, 902 students, 72% FRL); North Port High School (math 44% / reading 57%, grade D+, #171 of 667 statewide, top 26%, 2,562 students, 54% FRL) — zoned schools average 65% FRL vs 42% district-wide (23 pts higher); higher-poverty schools than district average — tighter screening recommended.
- Market conditions: Rents flat; 857 active listings in the ZIP; 2 comparable units currently listed for rent nearby; 7,466 units permitted in Sarasota County in 2024 (2,138 in 5+ unit buildings).
- This rent runs 40% of the median local income ($63k/yr) — at the standard rent-burdened threshold; future hikes will face affordability resistance.
Forward outlook
- Local home prices are declining (-3.0%/yr); year-one equity from $1k of loan paydown is wiped out by about $6k of value loss. Plan a longer hold.
- Sarasota County population projected at +20% by 2050 — long-run rental-demand tailwind backs the buy-and-hold thesis.
Negotiation context
- It's been on market 73 days — a 6% lower offer ($197k) is reasonable based on typical stale-listing flexibility.
- 10 sale attempts since 9y ago with the ask held roughly flat each time — persistent listings suggest the price (not the market) is what's stuck; bring a comps-based counter.
Risks & watch-outs
- Watch-outs: HOA is 22% of rent.
- Climate carrying-cost: moderate flood risk; severe wind risk, 99% chance of damaging wind over 30y; extreme-heat days projected 7→28/yr by 2055 (HVAC capex compounding) — expect insurance premiums to compound above CPI over the hold.
Questions for the listing agent
- What do current leases actually rent for vs. the listed asking? Can we see a recent rent roll and the last 12 months of T-12 income?
- It's been on market 73 days. Have you received any prior offers? Is the seller open to a 11% concession, seller financing, or rate buy-down credit?
- What does the HOA fee cover, when was the last increase, and are there any pending special assessments or reserve-fund shortfalls?
- Any open or pending special assessments — roof, HVAC, plumbing, elevator, façade? What's the per-unit balance and payoff schedule, and is the seller paying it off at close or rolling it to the buyer?
- Why hasn't it sold? Are there any deal-killer items the seller is aware of (foundation, flood, title, zoning, code violations)?
- Is there a deadline driving the sale (1031 exchange, divorce, estate, relocation)? That informs how much negotiation room exists.
- Schools are B-rated — typically a magnet for longer-tenancy family renters. What's the average tenant stay here, and is there a school-zone premium baked into asking?
- The area grade is low — what's the realistic commute time and amenity access for the typical tenant pool here? Any planned neighborhood developments (good or bad) we should know about?
- What's the average days-on-market for RENTAL listings here right now (not sales)? A rising rental-DOM trend means longer vacancies and softer asking-rent achievability than the comps imply.
- What's the recent tenant-quality profile in this submarket — average credit score on applications, eviction rate, late-payment / NSF rate, and stable-employment percentage? A property-management company in the area should have these aggregated.
- How much new apartment / multifamily construction is in the pipeline within 1–3 miles? Heavy new supply (>2% of stock underway) typically softens rents 12–24 months out; light construction supports rent growth.
Investment metrics
- 1% rule
- 1.00% ✗
- Cap rate
- 5.51%
- Cash-on-cash
- -2.78%
- DSCR
- 0.88
- GRM
- 8.4
CMA / ARV
No comps found within radius.
Projected returns pro-forma
-3.0% appreciation · 0.26% rent growth · sell at horizon
- IRR
- -24.7%
- Equity multiple
- 0.18×
- Total profit
- $-48,085
- Equity at exit
- $31,312
- IRR
- -35.2%
- Equity multiple
- -0.26×
- Total profit
- $-73,871
- Equity at exit
- $18,157
Cash invested: $58,800 (down + closing). Projections, not guarantees.
Landlord ↔ Tenant lean methodology
- Overall (STATE)
- 87 Strongly Landlord-Friendly
- State Florida
- 87 Strongly Landlord-Friendly · R+3
- County
- — inherits STATE
- City
- — inherits STATE
ZIP-level market 34287
- Home prices YoY
- -20.1%
- Rents YoY
- 0.3%
- Active inventory
- 857
- Price-to-rent
- 8.4×
Monthly cashflow live
- Estimated rent
- $2,090 medium interval (Pro) →
- Mortgage (P&I)
- −$1,101
- Tax from tax record
- −$146 /mo · $1,756/yr
- Insurance
- −$88
- HOA
- −$452
- Vacancy / Maint / Mgmt
- −$439
- Net cashflow
- $-136
Break-even live
Sensitivity live
| Price | -10% $-18 | -5% $-77 | +0% $-136 | +5% $-196 | +10% $-255 |
|---|---|---|---|---|---|
| Rent | -10% $-301 | -5% $-219 | +0% $-136 | +5% $-54 | +10% $29 |
| Rate | -1.0pp $-31 | -0.5pp $-83 | base $-136 | +0.5pp $-191 | +1.0pp $-246 |
UW: 25.0% down · 7.5% · 30yr · 1.5% tax · 5.0% vac · 8.0% maint · 8.0% mgmt
Financing live
Cash to close
- Down payment
- $52,500
- Closing costs
- $6,300
- Reserves months
- —
- Total cash needed
- —
Loan-product check · same deal, 3 products live
Conventional
25% down · 7.5% · 30yr
- Down + closing
- —
- Monthly P&I
- —
- Monthly cashflow
- —
- DSCR
- —
- Eligible?
- —
Personal DTI + credit; lowest rate.
DSCR
20% down · 8.5% · 30yr
- Down + closing
- —
- Monthly P&I
- —
- Monthly cashflow
- —
- DSCR
- —
- Eligible?
- —
No personal income docs; deal must DSCR.
Hard money
10% down · 12.0% · 12mo
- Down + closing
- —
- Monthly P&I
- —
- Monthly cashflow
- —
- DSCR
- —
- Eligible?
- —
Short-term bridge; refi at stabilization.
Rent comps 2 comps
| Address | Beds | Baths | Sqft | Rent | $/sqft | DOM | Units | Dist |
|---|---|---|---|---|---|---|---|---|
| 12395 Chancellor Blvd Port Charlotte, FL | 2.0 | 1.0 | 1004 | $1,600 | $1.59 | 23d | 1 | 1.26mi |
| 170 Saluda Ter Port Charlotte, FL | 3.0 | 2.0 | 1680 | $3,100 | $1.85 | 23d | 1 | 1.29mi |
HOA detail condo
- Monthly dues
- $452 · $5,424/yr
- Likely covers
- landscapingexterior maint.
- Assessments
- None detected in remarks — confirm with the listing agent.
Listing history 49 events
-
2026-06-21days on market $210,000 Active 73 DOM
-
2026-06-18days on market $210,000 Active 70 DOM
-
2026-06-17days on market $210,000 Active 69 DOM
-
2026-06-16days on market $210,000 Active 68 DOM
-
2026-06-15days on market $210,000 Active 67 DOM
-
2026-06-13days on market $210,000 Active 65 DOM
-
2026-06-13days on market $210,000 Active 64 DOM
-
2026-06-10days on market $210,000 Active 62 DOM
-
2026-06-09days on market $210,000 Active 61 DOM
-
2026-06-08days on market $210,000 Active 60 DOM
-
2026-06-08days on market $210,000 Active 59 DOM
-
2026-06-05days on market $210,000 Active 56 DOM
-
2026-06-03days on market $210,000 Active 55 DOM
-
2026-06-02days on market $210,000 Active 54 DOM
-
2026-06-01days on market $210,000 Active 53 DOM
-
2026-05-31days on market $210,000 Active 52 DOM
-
2026-04-09$220,000 Active 816-char remark
Show marketing remark (816 chars)
Welcome to your own slice of Florida living — a first floor 2-bedroom, 2-bath condo in the Sabal Trace community offering low-maintenance living with an open-concept living and dining area, a kitchen featuring stainless steel appliances, bright white cabinets and an appealing backsplash. The primary suite features high ceilings, a large walk in closet and balcony. Enjoy in-unit laundry and 1 covered parking spot. HOA dues cover exterior maintenance, landscaping, and access to community amenities. Centrally located in North Port, you’re just minutes from I-75 for quick trips to Sarasota and Port Charlotte, close to Myakka River State Park, Gulf Coast beaches, shopping, and dining. This home suits year-round living or a vacation property perfect for snow birds. Don’t miss this opportunity!
-
2024-12-06historical
-
2024-11-25historical $1,900
-
2024-11-21$279,000 Active
-
2024-08-31historical
-
2024-08-20$1,900
-
2024-07-17price $289,000
-
2024-07-17price $282,000
-
2024-06-19price $272,000
-
2024-05-17price $285,000
-
2024-05-15price $269,500
-
2024-04-16price $279,000
-
2024-03-29price $287,000
-
2024-03-29status Active
-
2023-12-29price $299,000
-
2023-11-11price $289,000
-
2023-10-19$295,000 Active
-
2023-07-20soldstatus $210,000 Closed
-
2023-07-20soldstatus $210,000
-
2023-06-18status Pending
-
2023-04-11$240,000 Active
-
2022-11-11status Active
-
2022-06-01status Pending
-
2022-05-08price $270,000
-
2022-05-06status Active
-
2022-04-30status Pending
-
2022-04-28$250,000 Active
-
2017-11-13soldstatus $149,700 Sold
-
2017-11-13soldstatus $149,700
-
2017-10-08status Pending
-
2017-04-19$155,000 Active
-
2008-12-19soldstatus $117,000
-
2001-03-20soldstatus $111,100
ⓘ Source: listings_history table (triggers on properties + properties_extension) + one-shot
backfill from property_details.listing_events for pre-trigger history.
Tax reassessment forecast FL · Resets to sale price
- Current annual tax
- $1,756 · $146/mo
- Projected year-2 tax
- $1,756 · $146/mo
- Expected delta
- $0/yr ($0/mo · -0.0%)
ⓘ Screening estimate from a state-policy table — verify with the county assessor before closing.
Climate risk First Street
- Flood 5/10 Major FEMA zone X (unshaded) · 23% chance over 30 yrs
- Wildfire 1/10 Low
- Heat 10/10 Extreme 7 d/yr ≥107°F today · 28 d/yr by 30 yrs out
- Wind 10/10 Extreme 99% chance of damaging wind over 30 yrs
- Air quality 3/10 Moderate 2 unhealthy d/yr today · 3 by 30 yrs out
Nearby sold comps map
Loading sold comps map…
Walkable amenities ~0.75 mi
Loading nearby amenities…
Taxation est. · year 1
- Rental income
- $25,074
- − Mortgage interest
- −$11,763
- − Property taxes
- −$1,756
- − Insurance
- −$1,050
- − Repairs & maintenance
- −$2,006
- − Management
- −$2,006
- − HOA
- −$5,424
- − Depreciation
- −$6,109
- Taxable loss
- −$5,040
- Est. tax savings @ 24.0%
- +$1,210
- After-tax cash flow
- $-427/yr
For passive investors: Depreciation is non-cash, so a rental often shows a tax loss while cash-flowing — sheltering income. Rental losses are passive: they offset passive income freely, and up to $25,000/yr can offset ordinary (W-2) income if you actively participate and your MAGI is under $100k (phasing out to $0 by $150k); unused losses carry forward. On sale, claimed depreciation is recaptured at up to 25%, and gains may owe capital-gains tax (a 1031 exchange can defer both). Figures are a year-1 estimate at your 24.0% rate — not tax advice; consult a CPA.
Schools (NCES district)
- District
- Sarasota
- NCES district ID
- 1201680
- Math proficiency
- 63% ▼ -8.00%
- Reading proficiency
- 63% ▼ -3.00%
- Median HH income
- $51,167
- Composite
- 53.68/100
- National rank
- #1428
- State rank
- #7 of 73 in FL
Livability — North Port
- Score
- 75/100
- State rank
- #252
- US rank
- #3975
Category grades
Schools grade is shown separately in the Schools card above.
Census & demographics
- Census place
- North Port, FL
- County
- Sarasota County · 448,376 people
- City population
- 75,324
- Metro
- North Port-Sarasota-Bradenton, FL
- Population (ZIP)
- 25,929
- Household income
- $63,464
- Rent vs Own
- Severe rent burden
- 522.0
Population outlook (Sarasota County) Hauer SSP2
- Today (2025)
- 452,380 people
- By 2030
- 474,175 · +4.8%
- By 2040
- 511,577 · +13.1%
- By 2050
- 541,467 · +19.7%
- By 2075
- 604,947 · +33.7%
- By 2100
- 621,965 · +37.5%
Race, ethnicity, and origin ACS 2023
- Neighborhood character
- Predominantly White (77%)
- Race & ethnicity
- White 77% Hispanic / Latino 14% Two or more races 7% Asian 4% Black 3%
- Hispanic origin (detail)
- Mexican 2% Puerto Rican 3% Cuban 3% Dominican 1%
- Common ancestry
- Romanian 4% Scotch-Irish 3% Lithuanian 3%
- Foreign-born
- 16% · Canada, Philippines
- Languages at home
- 81% English-only · Spanish 8% Russian/Polish/Slavic 5% French/Haitian/Cajun 2%
Political lean MEDSL · Sarasota
- 2024 margin
- R (+18.2) · D 40.5% · R 58.7%
- 2008→2024 swing
- -18.1pp toward R · 2008: -0.1pp · 2024: -18.2pp
- All cycles
- 2024: R+18.2 2020: R+10.4 2016: R+11.6 2012: R+7.4 2008: R+0.1
Not yet ingested
- Civics
- —
Market trends
- HPI YoY
- ▼ -70.89%
- Current HPI
- 280.8484
- Rent YoY
- ▲ 0.26%
- Metro
- North Port-Sarasota-Bradenton, FL
- State GDP YoY
- ▲ 3.28%
- F500 in state
- 36
Industry mix (Fortune 500 HQ in FL)
| Industry | F500 HQs | Revenue |
|---|---|---|
| Industrial Technology | 2 | $29B |
|
||
| Insurance | 2 | $17B |
|
||
| Retail | 1 | $60B |
|
||
| Technology Distribution | 1 | $58B |
|
||
| Homebuilding | 1 | $35B |
|
||
| Technology Manufacturing | 1 | $35B |
|
||
Price history
+98.0% since first listed33 events — show timeline
- 2026-04-09 Listed $220,000 Stellar MLS as Distributed by MLS Grid
- 2024-12-06 Listing Removed — Stellar MLS as Distributed by MLS Grid
- 2024-11-25 Rental Removed $1,900 STELLARMLS
- 2024-11-21 Listed $279,000 Stellar MLS as Distributed by MLS Grid
- 2024-08-31 Listing Removed — Stellar MLS as Distributed by MLS Grid
- 2024-08-20 Listed for Rent $1,900 STELLARMLS
- 2024-07-17 Price Changed $289,000 Stellar MLS as Distributed by MLS Grid
- 2024-07-17 Price Changed $282,000 Stellar MLS as Distributed by MLS Grid
- 2024-06-19 Price Changed $272,000 Stellar MLS as Distributed by MLS Grid
- 2024-05-17 Price Changed $285,000 Stellar MLS as Distributed by MLS Grid
- 2024-05-15 Price Changed $269,500 Stellar MLS as Distributed by MLS Grid
- 2024-04-16 Price Changed $279,000 Stellar MLS as Distributed by MLS Grid
- 2024-03-29 Price Changed $287,000 Stellar MLS as Distributed by MLS Grid
- 2024-03-29 Relisted — Stellar MLS as Distributed by MLS Grid
- 2023-12-29 Price Changed $299,000 Stellar MLS as Distributed by MLS Grid
- 2023-11-11 Price Changed $289,000 Stellar MLS as Distributed by MLS Grid
- 2023-10-19 Listed $295,000 Stellar MLS as Distributed by MLS Grid
- 2023-07-20 Sold (Public Records) $210,000 Public Records
- 2023-07-20 Sold (MLS) $210,000 Stellar MLS as Distributed by MLS Grid
- 2023-06-18 Pending — Stellar MLS as Distributed by MLS Grid
- 2023-04-11 Listed $240,000 Stellar MLS as Distributed by MLS Grid
- 2022-11-11 Relisted — Stellar MLS as Distributed by MLS Grid
- 2022-06-01 Pending — Stellar MLS as Distributed by MLS Grid
- 2022-05-08 Price Changed $270,000 Stellar MLS as Distributed by MLS Grid
- 2022-05-06 Relisted — Stellar MLS as Distributed by MLS Grid
- 2022-04-30 Pending — Stellar MLS as Distributed by MLS Grid
- 2022-04-28 Listed $250,000 Stellar MLS as Distributed by MLS Grid
- 2017-11-13 Sold (Public Records) $149,700 Public Records
- 2017-11-13 Sold (MLS) $149,700 Stellar MLS as Distributed by MLS Grid
- 2017-10-08 Pending — Stellar MLS as Distributed by MLS Grid
- 2017-04-19 Listed $155,000 Stellar MLS as Distributed by MLS Grid
- 2008-12-19 Sold (Public Records) $117,000 Public Records
- 2001-03-20 Sold (Public Records) $111,100 Public Records
Property tax history
+3.6%/yrLatest (2025): $1,756 · +7.7% YoY. Source: county tax records.
Cash-flow waterfall
monthlySold comps — $/sqft
last 12 mo · ≤1 miLoading sold comps…