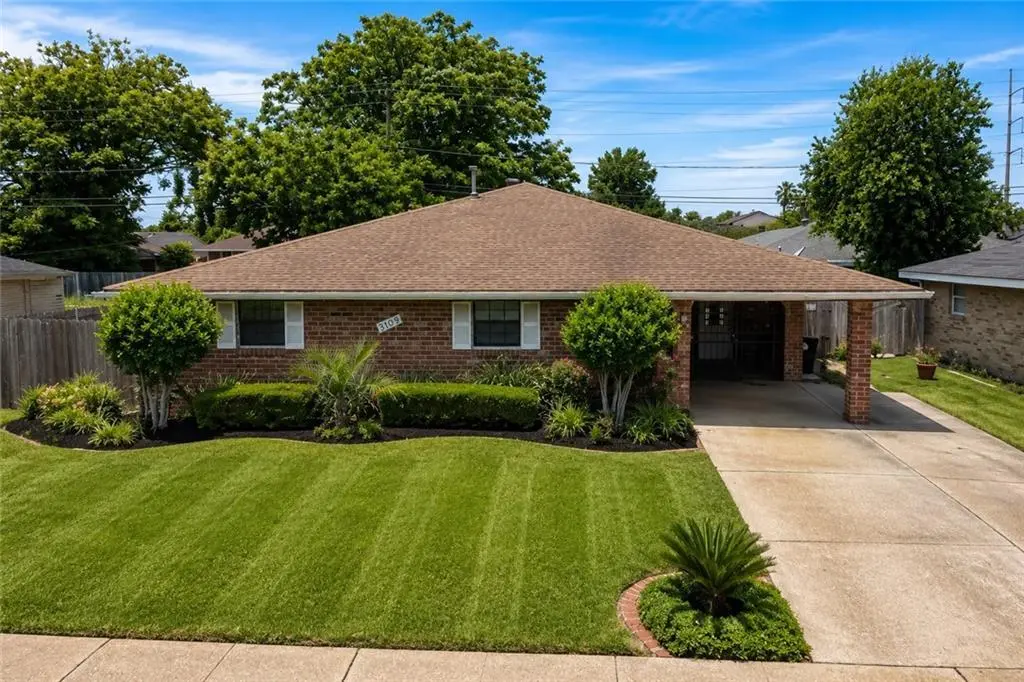
3319 Pittari Pl · New Orleans, LA
Flood risk 8/10 · Major
- FEMA flood zone
- X
- Chance of flooding over 30 yrs
- 0.6%
- Est. flood insurance / yr
- $507 – $1,088
Fire risk 1/10 · Minimal
- Est. fire insurance / yr
- $1,269 – $2,357
Heat risk 10/10 · Severe
- Hot days now (above 108°F)
- 7 days/yr
- Hot days in 30 yrs
- 22 days/yr
Wind risk 10/10 · Severe
- Chance of severe wind over 30 yrs
- 99.0%
Air-quality risk 2/10 · Minimal
- Unhealthy air days now
- 2 days/yr
- Unhealthy air days in 30 yrs
- 2 days/yr
Risk factors via First Street. Map © Google.
Why this score? — see what drove the B- grade
The composite is a weighted blend of 9 inputs, each scored 0–100. Each bar is that input's sub-score; the figure is the points it added to the 100-point composite (weight × sub-score).
- Cash flow +28.1/30.0
- ARV discount +13.6/15.0
- DSCR +10.0/10.0
- 1% rule +7.7/10.0
- Livability +4.0/5.0
- Condition / age +2.5/5.0
- Schools +1.6/10.0
- Rent growth +0.2/5.0
- Appreciation +0.0/10.0
$160,000
🖨 Deal sheet 📄 Offer letter ✓ Due diligence
Listing remarks MLS
IN NEED OF A LITTLE TLC!!! MOTIVATED SELLERS! <BR><BR> Spacious three-bedroom home offering approximately 2,000 square feet of living area with multiple additions and plenty of room to entertain. Wood burning fireplace for cozy gatherings. Also an additional bonus room.This property features a nice covered patio, backyard space, an enclosed front area along with additional walk in storage or flexible use, plus a spacious laundry room. <BR><BR> Conveniently located just minutes from downtown in an established community.<BR><BR> X Flood Zone<BR><BR>
Key facts
- Parking
- Built 1975
- Listed 44 days
Property features AI
Exterior
- Parking: Carport
- Utilities: Public water; Public sewer
- Home design: Single-story; Brick construction; Shingle roof; Slab foundation; Property in very good condition
- Construction: Built with brick exterior; Shingle roof; Slab foundation
- Exterior features: Brick and concrete patio/porch areas; Workshop on the property; City lot with rectangular shape
Interior
- Kitchen: Dishwasher; Oven; Range; Refrigerator
- Bedrooms: 5 total rooms (bedroom count not specified)
- Bathrooms: 1 full bathroom
- Heating & cooling: Central heating; Central air conditioning
- Interior features: Wood-burning fireplace
Neighborhood map
What this means for you Summary
Snapshot
- This is a 3-bed/1.5-bath single-family listed at $160k.
Deal economics
- At list price, monthly cash flow is $434 ($5k/yr) — positive.
- The deal already cash-flows at list — no discount required.
- Meets the 1% rule at list price ($2k rent vs $160k).
- Recommended offer: $155k (3.0% below list) — sets the bar for market timing.
- Cap rate 10.0% vs local median 4.4% in New Orleans — top-decile yield for the area; either an underpriced asset or a hidden risk that comps aren't pricing in. Stress-test before assuming the spread holds.
Location & tenants
- Location reads 81/100 on livability (#3 in LA, #1,383 nationally) — a professional / high-income tenant draw. Strengths: amenities A+, commute A+, health & safety A+; Watch: crime C-, employment D.
- Orleans Parish (urban): math 11% / reading 27% proficiency, ranked #69 of 98 in LA (top 70%) — low school quality limits family demand, transient renter base, plan for 1-2y turnover; 68% free/reduced lunch — lower-income household profile, screen leases tightly.
- Market conditions: Rents falling (-9.2%/yr); 274 active listings in the ZIP; 18 comparable units currently listed for rent nearby; rentals at typical pace (median 24d on market — plan ~3-4 weeks tenant-placement turnaround); 710 units permitted in Orleans Parish in 2024 (244 in 5+ unit buildings).
- This rent runs 39% of the median local income ($62k/yr) — at the standard rent-burdened threshold; future hikes will face affordability resistance.
Forward outlook
- Local home prices are declining (-3.0%/yr); year-one equity from $1k of loan paydown is wiped out by about $5k of value loss. Plan a longer hold.
- Orleans County population projected at +61% by 2050 — long-run rental-demand tailwind backs the buy-and-hold thesis.
Negotiation context
- It's been on market 44 days — a 3% lower offer ($155k) is reasonable based on typical stale-listing flexibility.
- 2 sale attempts; this cycle's ask has dropped $10k (6%) from the opening price — seller is motivated, your offer sets the floor, not the list.
Risks & watch-outs
- Watch-outs: flood insurance adds $66/mo.
- Climate carrying-cost: severe flood risk; severe wind risk, 99% chance of damaging wind over 30y; extreme-heat days projected 7→22/yr by 2055 (HVAC capex compounding) — expect insurance premiums to compound above CPI over the hold.
Questions for the listing agent
- It's been on market 44 days. Have you received any prior offers? Is the seller open to a 3% concession, seller financing, or rate buy-down credit?
- Built in 1975 — when were the roof, HVAC, electrical panel, plumbing, and water heater last replaced?
- What's the actual annual flood-insurance premium (NFIP or private), and is the property in a SFHA with mandatory coverage?
- Is there a deadline driving the sale (1031 exchange, divorce, estate, relocation)? That informs how much negotiation room exists.
- What's the average days-on-market for RENTAL listings here right now (not sales)? A rising rental-DOM trend means longer vacancies and softer asking-rent achievability than the comps imply.
- What's the recent tenant-quality profile in this submarket — average credit score on applications, eviction rate, late-payment / NSF rate, and stable-employment percentage? A property-management company in the area should have these aggregated.
- How much new for-sale + rental construction is in the pipeline within 1–3 miles? Heavy new supply typically softens prices + rents 12–24 months out; constrained supply supports both.
Investment metrics
- 1% rule
- 1.27% ✓
- Cap rate
- 10.05%
- Cash-on-cash
- 13.40%
- DSCR
- 1.60
- GRM
- 6.6
CMA / ARV
- ARV (median comp)
- $185,234
- List price
- $160,000
- Delta
- -13.62%
- Verdict
- UNDERPRICED
- Comps
- 20 within 1.0 mi
Show comp detail 12 sales within ~0.75 mi
| Address | Dist | Beds/Ba | Sqft | Sold | Price | $/sf | Match |
|---|---|---|---|---|---|---|---|
| 2954 Blair St | 0.22mi | 4/2.0 (+1) | 1,970 (+1%) | 12mo | $220,000 | $112 | 72 |
| 3200 Lancaster St | 0.12mi | 3/2.0 | 1,678 (-14%) | 5mo | $179,900 | $107 | 64 |
| 6616 Brunswick Ct | 0.36mi | 3/2.0 | 1,881 (-4%) | 16mo | $250,000 | $133 | 61 |
| 106 Larchmont Pl | 0.60mi | 3/2.0 | 2,048 (+5%) | 2mo | $205,000 | $100 | 60 |
| 3035 Sullen Pl Pl | 0.40mi | 3/2.0 | 1,688 (-14%) | 2mo | $175,000 | $104 | 55 |
| 6201 Oxford Pl | 0.53mi | 4/2.0 (+1) | 2,048 (+5%) | 7mo | $191,000 | $93 | 54 |
| 6133 Carlisle Ct | 0.69mi | 4/2.0 (+1) | 1,883 (-4%) | 2mo | $185,000 | $98 | 53 |
| 6227 Oxford Pl | 0.51mi | 4/2.5 (+1) | 2,019 (+3%) | 14mo | $290,000 | $144 | 51 |
| 6628 Peony St | 0.44mi | 4/2.0 (+1) | 1,700 (-13%) | 7mo | $194,500 | $114 | 45 |
| 5941 Dover Pl | 0.71mi | 3/2.0 | 1,846 (-6%) | 15mo | $210,000 | $114 | 43 |
| 104 Kingston Ct | 0.74mi | 3/2.0 | 1,752 (-10%) | 5mo | $285,000 | $163 | 42 |
| 205 Fairfax Pl | 0.68mi | 3/2.0 | 1,764 (-10%) | 12mo | $300,000 | $170 | 40 |
Match score weights: distance 35% · size 25% · config 20% · recency 20%. Top-matched comps best support the ARV.
Projected returns pro-forma
-3.0% appreciation · 0.0% rent growth · sell at horizon
- IRR
- -2.6%
- Equity multiple
- 0.91×
- Total profit
- $-4,173
- Equity at exit
- $23,857
- IRR
- 3.3%
- Equity multiple
- 1.21×
- Total profit
- $9,223
- Equity at exit
- $13,834
Cash invested: $44,800 (down + closing). Projections, not guarantees.
Landlord ↔ Tenant lean methodology
- Overall (STATE)
- 90 Strongly Landlord-Friendly
- State Louisiana
- 90 Strongly Landlord-Friendly · R+12
- County
- — inherits STATE
- City
- — inherits STATE
ZIP-level market 70131
- Home prices YoY
- -12.0%
- Rents YoY
- -9.2%
- Active inventory
- 274
- Price-to-rent
- 6.6×
Monthly cashflow live
- Estimated rent
- $2,033 high interval (Pro) →
- Mortgage (P&I)
- −$839
- Tax est. 1.5%
- −$200 /mo · $2,400/yr
- Insurance
- −$67
- Flood insurance flood zone
- −$66 /mo · $798/yr
- HOA
- −$0
- Vacancy / Maint / Mgmt
- −$427
- Net cashflow
- $434
Break-even live
UW: 25.0% down · 7.5% · 30yr · 1.5% tax · 5.0% vac · 8.0% maint · 8.0% mgmt
Financing live
Cash to close
- Down payment
- $40,000
- Closing costs
- $4,800
- Reserves months
- —
- Total cash needed
- —
Loan-product check · same deal, 3 products live
Conventional
25% down · 7.5% · 30yr
- Down + closing
- —
- Monthly P&I
- —
- Monthly cashflow
- —
- DSCR
- —
- Eligible?
- —
Personal DTI + credit; lowest rate.
DSCR
20% down · 8.5% · 30yr
- Down + closing
- —
- Monthly P&I
- —
- Monthly cashflow
- —
- DSCR
- —
- Eligible?
- —
No personal income docs; deal must DSCR.
Hard money
10% down · 12.0% · 12mo
- Down + closing
- —
- Monthly P&I
- —
- Monthly cashflow
- —
- DSCR
- —
- Eligible?
- —
Short-term bridge; refi at stabilization.
Rent comps 18 comps
| Address | Beds | Baths | Sqft | Rent | $/sqft | DOM | Units | Dist |
|---|---|---|---|---|---|---|---|---|
| 3200 Lancaster St New Orleans, LA | 4.0 | 2.0 | 1678 | $2,200 | $1.31 | 23d | 1 | 0.11mi |
| 3619 Pittari Pl New Orleans, LA | 4.0 | 2.0 | 2000 | $2,200 | $1.10 | 23d | 1 | 0.22mi |
| 3531 Adrian St New Orleans, LA | 3.0 | 2.0 | 1292 | $1,895 | $1.47 | 15d | 1 | 0.25mi |
| 4020 Sullen Pl New Orleans, LA | 4.0 | 2.5 | 1280 | $1,400 | $1.09 | 3d | 1 | 0.61mi |
| 6021 Brighton Pl New Orleans, LA | 4.0 | 3.0 | 1840 | $3,100 | $1.68 | 15d | 1 | 0.69mi |
| 6121 Stratford Pl New Orleans, LA | 3.0 | 2.0 | 1225 | $1,800 | $1.47 | 15d | 1 | 0.74mi |
| 6015 Carlisle Ct New Orleans, LA | 3.0 | 2.0 | 2300 | $1,800 | $0.78 | 15d | 1 | 0.78mi |
| 4254 Maple Leaf Dr New Orleans, LA | 1.0–3.0 | 1.0–2.5 | 1354 | $1,687 | $1.25 | 1d | 8 | 0.83mi |
| 3429 Bryson St New Orleans, LA | 3.0 | 2.0 | 1250 | $2,200 | $1.76 | 23d | 1 | 0.99mi |
| 5801 Albany Ct New Orleans, LA | 4.0 | 2.5 | 2160 | $2,000 | $0.93 | 23d | 1 | 1.02mi |
| 2741 Chelsea Dr New Orleans, LA | 4.0 | 2.5 | 2382 | $2,500 | $1.05 | 15d | 1 | 1.12mi |
| 4479 Woodland Dr Unit A New Orleans, LA | 2.0 | 2.5 | 1300 | $1,500 | $1.15 | 23d | 1 | 1.22mi |
| 5823 Tullis Dr New Orleans, LA | 3.0 | 1.5 | 1637 | $1,600 | $0.98 | 23d | 1 | 1.30mi |
| 3151 Plymouth Pl New Orleans, LA | 3.0 | 1.0 | 1470 | $1,700 | $1.16 | 23d | 1 | 1.30mi |
| 5797 Tullis Dr New Orleans, LA | 3.0 | 1.5 | 1240 | $1,600 | $1.29 | 23d | 1 | 1.32mi |
| 5000 Woodland Dr New Orleans, LA | 2.0 | 1.0–2.5 | 943 | $1,457 | $1.55 | 23d | 1 | 1.36mi |
| 3738 Somerset Dr New Orleans, LA | 4.0 | 2.0 | 2247 | $3,000 | $1.34 | 14d | 1 | 1.38mi |
| 3751 Herald St New Orleans, LA | 4.0 | 2.0 | 1624 | $2,150 | $1.32 | 23d | 1 | 1.43mi |
Listing history 16 events
-
2026-06-18days on market $160,000 Active 44 DOM
-
2026-06-17days on market $160,000 Active 43 DOM
-
2026-06-16days on market $160,000 Active 42 DOM
-
2026-06-15days on market $160,000 Active 41 DOM
-
2026-06-13pricedays on market $160,000 Active 39 DOM
-
2026-06-10days on market $170,000 Active 36 DOM
Show marketing remark (553 chars)
IN NEED OF A LITTLE TLC!!! MOTIVATED SELLERS! <BR><BR> Spacious three-bedroom home offering approximately 2,000 square feet of living area with multiple additions and plenty of room to entertain. Wood burning fireplace for cozy gatherings. Also an additional bonus room.This property features a nice covered patio, backyard space, an enclosed front area along with additional walk in storage or flexible use, plus a spacious laundry room. <BR><BR> Conveniently located just minutes from downtown in an established community.<BR><BR> X Flood Zone<BR><BR>
-
2026-06-09days on market $170,000 Active 35 DOM
-
2026-06-08days on market $170,000 Active 34 DOM
-
2026-06-07days on market $170,000 Active 33 DOM
-
2026-06-05days on market $170,000 Active 30 DOM
-
2026-06-03days on market $170,000 Active 29 DOM
-
2026-06-02days on market $170,000 Active 28 DOM
-
2026-06-01days on market $170,000 Active 27 DOM
-
2026-05-31days on market $170,000 Active 26 DOM
-
2026-05-05$170,000 Active 524-char remark
Show marketing remark (553 chars)
IN NEED OF A LITTLE TLC!!! MOTIVATED SELLERS! <BR><BR> Spacious three-bedroom home offering approximately 2,000 square feet of living area with multiple additions and plenty of room to entertain. Wood burning fireplace for cozy gatherings. Also an additional bonus room.This property features a nice covered patio, backyard space, an enclosed front area along with additional walk in storage or flexible use, plus a spacious laundry room. <BR><BR> Conveniently located just minutes from downtown in an established community.<BR><BR> X Flood Zone<BR><BR>
-
2026-05-05$170,000 Active 507-char remark
Show marketing remark (553 chars)
IN NEED OF A LITTLE TLC!!! MOTIVATED SELLERS! <BR><BR> Spacious three-bedroom home offering approximately 2,000 square feet of living area with multiple additions and plenty of room to entertain. Wood burning fireplace for cozy gatherings. Also an additional bonus room.This property features a nice covered patio, backyard space, an enclosed front area along with additional walk in storage or flexible use, plus a spacious laundry room. <BR><BR> Conveniently located just minutes from downtown in an established community.<BR><BR> X Flood Zone<BR><BR>
ⓘ Source: listings_history table (triggers on properties + properties_extension) + one-shot
backfill from property_details.listing_events for pre-trigger history.
Climate risk First Street
- Flood 8/10 Severe FEMA zone X · 60% chance over 30 yrs
- Wildfire 1/10 Low
- Heat 10/10 Extreme 7 d/yr ≥108°F today · 22 d/yr by 30 yrs out
- Wind 10/10 Extreme 99% chance of damaging wind over 30 yrs
- Air quality 2/10 Low 2 unhealthy d/yr today · 2 by 30 yrs out
Nearby sold comps map
Loading sold comps map…
Walkable amenities ~0.75 mi
Loading nearby amenities…
Taxation est. · year 1
- Rental income
- $24,398
- − Mortgage interest
- −$8,962
- − Property taxes
- −$2,400
- − Insurance
- −$1,598
- − Repairs & maintenance
- −$1,952
- − Management
- −$1,952
- − Depreciation
- −$4,655
- Taxable income
- $2,879
- Est. tax owed @ 24.0%
- −$691
- After-tax cash flow
- $4,517/yr
For passive investors: Depreciation is non-cash, so a rental often shows a tax loss while cash-flowing — sheltering income. Rental losses are passive: they offset passive income freely, and up to $25,000/yr can offset ordinary (W-2) income if you actively participate and your MAGI is under $100k (phasing out to $0 by $150k); unused losses carry forward. On sale, claimed depreciation is recaptured at up to 25%, and gains may owe capital-gains tax (a 1031 exchange can defer both). Figures are a year-1 estimate at your 24.0% rate — not tax advice; consult a CPA.
Schools (NCES district)
- District
- Orleans Parish
- NCES district ID
- 2201170
- Math proficiency
- 11% ▼ -52.00%
- Reading proficiency
- 27% ▼ -46.00%
- Median HH income
- $37,011
- Composite
- 15.78/100
- National rank
- #9271
- State rank
- #69 of 98 in LA
Livability — New Orleans
- Score
- 81/100
- State rank
- #3
- US rank
- #1383
Category grades
Schools grade is shown separately in the Schools card above.
Census & demographics
- Census place
- New Orleans, LA
- County
- Orleans Parish · 338,817 people
- City population
- 338,817
- Metro
- New Orleans-Metairie, LA
- Population (ZIP)
- 25,151
- Household income
- $62,389
- Rent vs Own
- Severe rent burden
- 707.0
Population outlook (Orleans County) Hauer SSP2
- Today (2025)
- 513,025 people
- By 2030
- 575,781 · +12.2%
- By 2040
- 700,174 · +36.5%
- By 2050
- 826,541 · +61.1%
- By 2075
- 1,123,374 · +119.0%
- By 2100
- 1,355,609 · +164.2%
Race, ethnicity, and origin ACS 2023
- Neighborhood character
- Diverse neighborhood (Simpson 0.57)
- Race & ethnicity
- Black 62% White 20% Hispanic / Latino 11% Two or more races 6% Asian 4%
- Hispanic origin (detail)
- Mexican 2% Dominican 2%
- Common ancestry
- Lithuanian 4% Hispanic 1%
- Foreign-born
- 8% · Canada, Vietnam, China
- Languages at home
- 86% English-only · Spanish 9% Vietnamese 2% French/Haitian/Cajun 1%
Political lean MEDSL · Orleans
- 2024 margin
- Solid D (+67.0) · D 82.2% · R 15.2% · Other 2.7%
- 2008→2024 swing
- +6.7pp toward D · 2008: 60.3pp · 2024: 67.0pp
- All cycles
- 2024: D+67.0 2020: D+68.2 2016: D+66.2 2012: D+62.5 2008: D+60.3
Not yet ingested
- Civics
- —
Market trends
- HPI YoY
- ▼ -28.08%
- Current HPI
- 206.7552
- Rent YoY
- ▼ -9.23%
- Metro
- New Orleans-Metairie, LA
- State GDP YoY
- ▲ 3.29%
- F500 in state
- 10
Industry mix (Fortune 500 HQ in LA)
| Industry | F500 HQs | Revenue |
|---|---|---|
| Telecommunications | 2 | $23B |
|
||
| Utilities | 1 | $12B |
|
||
| Wholesale / Distribution | 1 | $5B |
|
||
| Advertising | 1 | $2B |
|
||
Price history
-5.9% since first listed4 events — show timeline
- 2026-06-10 Price Changed $160,000 AcadianaMLS
- 2026-06-10 Price Changed $160,000 GSREIN
- 2026-05-05 Listed $170,000 GSREIN
- 2026-05-05 Listed $170,000 AcadianaMLS
Property tax history
-0.6%/yrLatest (2026): $299 · +0.0% YoY. Source: county tax records.
Cash-flow waterfall
monthlySold comps — $/sqft
last 12 mo · ≤1 miLoading sold comps…