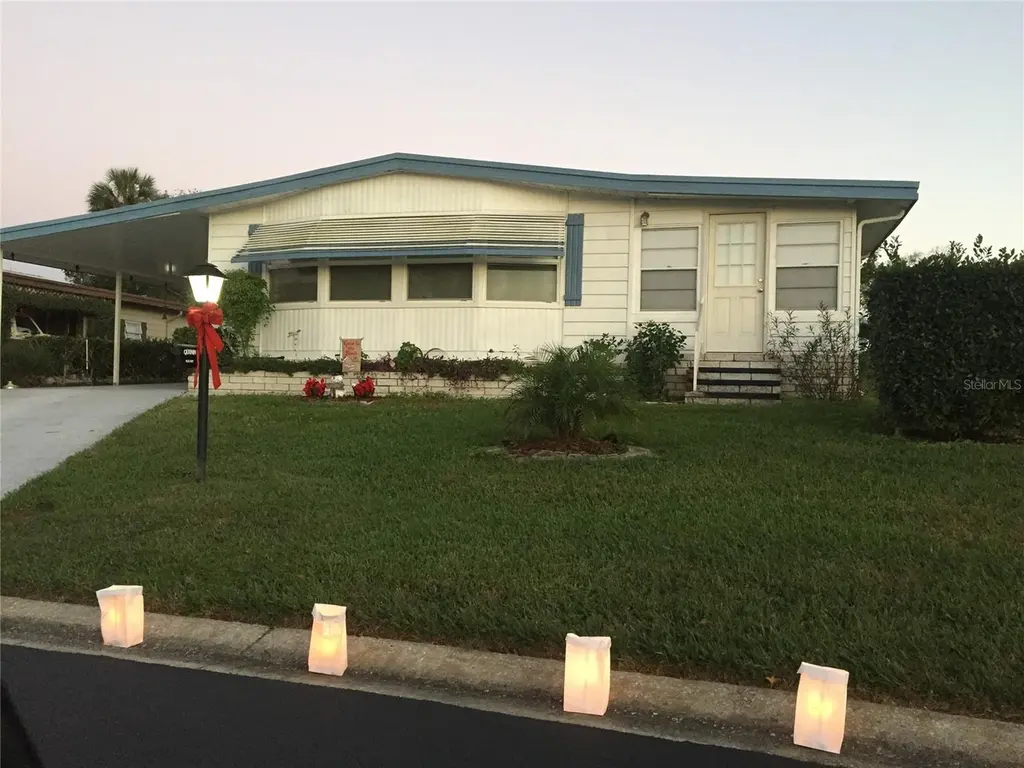
3438 Banberry Cir #1790 · Zellwood, FL
Flood risk 1/10 · Minimal
- FEMA flood zone
- X (unshaded)
- Chance of flooding over 30 yrs
- 0.0%
- Est. flood insurance / yr
- $507 – $1,088
Fire risk 4/10 · Minor
- Est. fire insurance / yr
- $947 – $1,759
Heat risk 8/10 · Major
- Hot days now (above 108°F)
- 7 days/yr
- Hot days in 30 yrs
- 21 days/yr
Wind risk 9/10 · Severe
- Chance of severe wind over 30 yrs
- 99.0%
Air-quality risk 1/10 · Minimal
- Unhealthy air days now
- 0 days/yr
- Unhealthy air days in 30 yrs
- 0 days/yr
Risk factors via First Street. Map © Google.
Why this score? — see what drove the D- grade
The composite is a weighted blend of 9 inputs, each scored 0–100. Each bar is that input's sub-score; the figure is the points it added to the 100-point composite (weight × sub-score).
- ARV discount +10.4/15.0
- Appreciation +6.3/10.0
- Cash flow +5.2/30.0
- Schools +4.1/10.0
- Livability +3.8/5.0
- Rent growth +2.5/5.0
- Condition / age +2.5/5.0
- 1% rule +1.5/10.0
- DSCR +0.0/10.0
$155,000
🖨 Deal sheet (PDF) 📄 Offer letter ✓ Due diligence
Listing remarks
Land Owned! Spacious 2-bedroom, 2-bath home on an elevated lot over looking golf course. with over 1500 sq. ft. of living space in a desirable 55+ community This well maintained home features generously sized rooms and plenty of natural light. Some furnishings can stay, making it easy to move right in. While comfortable as-is, it offers an excellent opportunity for updating to suit your style - and is priced to sell quickly! Enjoy resort-style living with access to golf, clubhouse, restaurant. Many activities and amenities, all in a beautifully landscaped neighborhood.
Key facts
- Natural light
- Elevated lot
- 6,027 sq ft lot
Tags
Property features AI
Finance
- Other: Partially furnished; Lease restrictions apply
- Financial info: Total monthly fees $238 (total annual fees $2,856)
- HOA & community: Has HOA (monthly fee $238); Association requires approval; Association amenities include clubhouse, fitness center, pool, tennis and pickleball courts, golf course access, spa/hot tub, sauna, recreation facilities, trails, cable TV, internet, gated entry, vehicle restrictions, and maintenance/management/trash services; Senior community; Community features include deed restrictions, community mailbox, street lights, and buyer approval required; Pets not allowed
Exterior
- Parking: Carport with 2 spaces
- Security: Gated community with 24-hour guard
- Utilities: Public water; Public sewer; Electricity available and connected; Cable available and connected; Fiber optics; High-speed internet / BB/HS Internet available; Phone available; Sprinkler meter; Underground utilities; Water connected; Sewer connected; Fire hydrant
- Home design: Manufactured home (Double wide); One story; North-facing
- Construction: Metal siding; Vinyl siding; Shingle roof; Crawlspace foundation; Completed condition
- Exterior features: Covered screened patio/porch; Awnings; Storage; Shed(s); Workshop
Interior
- Kitchen: Dishwasher; Microwave; Range; Range hood; Refrigerator; Exhaust fan; Electric water heater
- Bedrooms: 2 bedrooms
- Flooring: Carpet
- Bathrooms: 2 full bathrooms
- Heating & cooling: Electric heating; Central air conditioning
- Interior features: Ceiling fans; Eat-in kitchen; Living room/dining room combo; Thermostat; Walk-in closets; Skylights; Aluminum window frames; ENERGY STAR qualified windows; Insulated windows; Den/Library/Office
- Laundry & utility: Washer hookup; Electric dryer hookup; Washer and dryer included
Neighborhood map
What this means for you Summary
Snapshot
- This is a 2-bed/2.0-bath manufactured listed at $155k.
Deal economics
- At list price, monthly cash flow is $-351 ($-4k/yr) — negative.
- To cash-flow at today's rent, offer at most $93k (40.0% below list).
- To meet the 1% rule (rent ≥ 1% of price), the offer needs to be $101k (34.7% below list).
- Recommended offer: $93k (40.0% below list) — sets the bar for cash-flow.
Location & tenants
- Location reads 75/100 on livability (#248 in FL, #3,918 nationally) — a middle-class / working-renter tenant base. Strengths: crime A+, cost of living A+, housing A+; Watch: amenities F, commute D-, health & safety D-.
- Orange (suburban): math 46% / reading 51% proficiency, ranked #43 of 73 in FL (top 59%) — families likely to look elsewhere, expect single-tenant / working-renter base with shorter leases.
- Zoned schools: Zellwood Elementary (math 38% / reading 40%, grade F, #1,560 of 2,144 statewide, top 73%, 493 students, 55% FRL); Wolf Lake Middle (math 57% / reading 52%, grade B-, #183 of 571 statewide, top 34%, 1,194 students, 45% FRL); Apopka High (math 19% / reading 47%, grade F, #406 of 667 statewide, top 61%, 3,507 students, 42% FRL).
- Market conditions: 104 active listings in the ZIP; 8,053 units permitted in Orange County in 2024 (3,133 in 5+ unit buildings).
Forward outlook
- In year one you build about $5k of equity ($1k loan paydown + $4k appreciation (2.5% local appreciation)).
- Orange County population projected at +52% by 2050 — long-run rental-demand tailwind backs the buy-and-hold thesis.
- By year 7, paydown + projected appreciation supports a ~$31k cash-out refi (75% LTV) — recoverable capital for the next deal without selling this one.
Negotiation context
- Only 10 days on market — expect competitive offers; lowballing is unlikely to land.
- Current owner paid $58k; list at $155k implies a 167% gain — meaningful room to come down on a strong offer.
Risks & watch-outs
- Watch-outs: HOA is 24% of rent.
- Climate carrying-cost: severe wind risk, 99% chance of damaging wind over 30y; extreme-heat days projected 7→21/yr by 2055 (HVAC capex compounding) — expect insurance premiums to compound above CPI over the hold.
Questions for the listing agent
- What do current leases actually rent for vs. the listed asking? Can we see a recent rent roll and the last 12 months of T-12 income?
- What does the HOA fee cover, when was the last increase, and are there any pending special assessments or reserve-fund shortfalls?
- Is there a deadline driving the sale (1031 exchange, divorce, estate, relocation)? That informs how much negotiation room exists.
- Schools are D-rated, which usually means shorter tenancies and higher turnover. Who's the typical renter profile here, and what's been the actual vacancy rate?
- The area grade is low — what's the realistic commute time and amenity access for the typical tenant pool here? Any planned neighborhood developments (good or bad) we should know about?
- What's the average days-on-market for RENTAL listings here right now (not sales)? A rising rental-DOM trend means longer vacancies and softer asking-rent achievability than the comps imply.
- What's the recent tenant-quality profile in this submarket — average credit score on applications, eviction rate, late-payment / NSF rate, and stable-employment percentage? A property-management company in the area should have these aggregated.
- How much new for-sale + rental construction is in the pipeline within 1–3 miles? Heavy new supply typically softens prices + rents 12–24 months out; constrained supply supports both.
Investment metrics
- 1% rule
- 0.65% ✗
- Cap rate
- 3.58%
- Cash-on-cash
- -9.70%
- DSCR
- 0.57
- GRM
- 12.8
CMA / ARV
- ARV (on-the-fly)
- $165,723
- Comps found
- 4
Show comp detail 4 sales within ~0.75 mi
| Address | Dist | Beds/Ba | Sqft | Sold | Price | $/sf | Match |
|---|---|---|---|---|---|---|---|
| 3500 Blossom Cir #1497 | 0.13mi | 2/2.0 | 1,656 (+11%) | 2mo | $112,500 | $68 | 75 |
| 3644 Parway Rd #1149 | 0.49mi | 2/2.0 | 1,538 (+3%) | 1mo | $235,000 | $153 | 71 |
| 3749 Cohen Dr #720 | 0.38mi | 2/2.0 | 1,602 (+7%) | 13mo | $147,000 | $92 | 59 |
| 3768 Diamond Oak Way #626 | 0.41mi | 2/2.0 | 1,312 (-12%) | 9mo | $145,200 | $111 | 53 |
Match score weights: distance 35% · size 25% · config 20% · recency 20%. Top-matched comps best support the ARV.
Projected returns pro-forma
2.5% appreciation · 3.0% rent growth · sell at horizon
- IRR
- -3.2%
- Equity multiple
- 0.82×
- Total profit
- $-7,654
- Equity at exit
- $65,395
- IRR
- 1.5%
- Equity multiple
- 1.21×
- Total profit
- $9,313
- Equity at exit
- $97,558
Cash invested: $43,400 (down + closing). Projections, not guarantees.
Landlord ↔ Tenant lean methodology
- Overall (STATE)
- 87 Strongly Landlord-Friendly
- State Florida
- 87 Strongly Landlord-Friendly · R+3
- County
- — inherits STATE
- City
- — inherits STATE
ZIP-level market 32798
- Home prices YoY
- 1.0%
- Active inventory
- 104
- Price-to-rent
- 12.8×
Monthly cashflow live
- Estimated rent
- $1,012 medium interval (Pro) →
- Mortgage (P&I)
- −$813
- Tax from tax record
- −$35 /mo · $421/yr
- Insurance
- −$65
- HOA
- −$238
- Lot rent leased land?
- −$0
- Vacancy / Maint / Mgmt
- −$213
- Net cashflow
- $-351
Break-even live
Sensitivity live
| Price | -10% $-263 | -5% $-307 | +0% $-351 | +5% $-395 | +10% $-439 |
|---|---|---|---|---|---|
| Rent | -10% $-431 | -5% $-391 | +0% $-351 | +5% $-311 | +10% $-271 |
| Rate | -1.0pp $-273 | -0.5pp $-311 | base $-351 | +0.5pp $-391 | +1.0pp $-432 |
UW: 25.0% down · 7.5% · 30yr · 1.5% tax · 5.0% vac · 8.0% maint · 8.0% mgmt
Financing live
Cash to close
- Down payment
- $38,750
- Closing costs
- $4,650
- Reserves months
- —
- Total cash needed
- —
Loan-product check · same deal, 3 products live
Conventional
25% down · 7.5% · 30yr
- Down + closing
- —
- Monthly P&I
- —
- Monthly cashflow
- —
- DSCR
- —
- Eligible?
- —
Personal DTI + credit; lowest rate.
DSCR
20% down · 8.5% · 30yr
- Down + closing
- —
- Monthly P&I
- —
- Monthly cashflow
- —
- DSCR
- —
- Eligible?
- —
No personal income docs; deal must DSCR.
Hard money
10% down · 12.0% · 12mo
- Down + closing
- —
- Monthly P&I
- —
- Monthly cashflow
- —
- DSCR
- —
- Eligible?
- —
Short-term bridge; refi at stabilization.
HOA detail
- Monthly dues
- $238 · $2,856/yr
Listing history 8 events
-
2026-06-22days on market $155,000 Active 10 DOM
-
2026-06-21days on market $155,000 Active 9 DOM
-
2026-06-18days on market $155,000 Active 6 DOM
-
2026-06-17days on market $155,000 Active 5 DOM
-
2026-06-16days on market $155,000 Active 4 DOM
-
2026-06-15days on market $155,000 Active 3 DOM
-
2026-06-13remarks 575-char remark
-
2026-06-13$155,000 Active 1 DOM
ⓘ Source: listings_history table (triggers on properties + properties_extension) + one-shot
backfill from property_details.listing_events for pre-trigger history.
Tax reassessment forecast FL · Resets to sale price
- Current annual tax
- $421 · $35/mo
- Projected year-2 tax
- $1,286 · $107/mo
- Expected delta
- +$866/yr (+$72/mo · 205.6%)
ⓘ Screening estimate from a state-policy table — verify with the county assessor before closing.
Climate risk First Street
- Flood 1/10 Low FEMA zone X (unshaded) · 0% chance over 30 yrs
- Wildfire 4/10 Moderate
- Heat 8/10 Severe 7 d/yr ≥108°F today · 21 d/yr by 30 yrs out
- Wind 9/10 Extreme 99% chance of damaging wind over 30 yrs
- Air quality 1/10 Low 0 unhealthy d/yr today · 0 by 30 yrs out
Nearby sold comps map
Loading sold comps map…
Walkable amenities ~0.75 mi
Loading nearby amenities…
Taxation est. · year 1
- Rental income
- $12,146
- − Mortgage interest
- −$8,682
- − Property taxes
- −$421
- − Insurance
- −$775
- − Repairs & maintenance
- −$972
- − Management
- −$972
- − HOA
- −$2,856
- − Depreciation
- −$4,509
- Taxable loss
- −$7,041
- Est. tax savings @ 24.0%
- +$1,690
- After-tax cash flow
- $-2,521/yr
For passive investors: Depreciation is non-cash, so a rental often shows a tax loss while cash-flowing — sheltering income. Rental losses are passive: they offset passive income freely, and up to $25,000/yr can offset ordinary (W-2) income if you actively participate and your MAGI is under $100k (phasing out to $0 by $150k); unused losses carry forward. On sale, claimed depreciation is recaptured at up to 25%, and gains may owe capital-gains tax (a 1031 exchange can defer both). Figures are a year-1 estimate at your 24.0% rate — not tax advice; consult a CPA.
Schools (NCES district)
- District
- Orange
- NCES district ID
- 1201440
- Math proficiency
- 46% ▼ -9.00%
- Reading proficiency
- 51% ▼ -2.00%
- Median HH income
- $49,350
- Composite
- 41.47/100
- National rank
- #3461
- State rank
- #43 of 73 in FL
Livability — Zellwood
- Score
- 75/100
- State rank
- #248
- US rank
- #3918
Category grades
Schools grade is shown separately in the Schools card above.
Census & demographics
- Census place
- Zellwood, FL
- City population
- 2,159
- Population (ZIP)
- 2,159
Population outlook (Orange County) Hauer SSP2
- Today (2025)
- 1,618,226 people
- By 2030
- 1,787,404 · +10.5%
- By 2040
- 2,125,621 · +31.4%
- By 2050
- 2,454,016 · +51.6%
- By 2075
- 3,173,711 · +96.1%
- By 2100
- 3,607,781 · +122.9%
Race, ethnicity, and origin ACS 2023
- Neighborhood character
- Predominantly White (86%)
- Race & ethnicity
- White 86% Hispanic / Latino 10% Two or more races 8%
- Hispanic origin (detail)
- Puerto Rican 10%
- Common ancestry
- Iranian 5% Lithuanian 5% Romanian 2%
- Foreign-born
- 5%
- Languages at home
- 89% English-only · Spanish 9% German/W. Germanic 3%
Political lean MEDSL · Orange
- 2024 margin
- D (+13.6) · D 56.1% · R 42.5% · Other 1.3%
- 2008→2024 swing
- -5.0pp toward R · 2008: 18.6pp · 2024: 13.6pp
- All cycles
- 2024: D+13.6 2020: D+23.1 2016: D+24.6 2012: D+18.2 2008: D+18.6
Not yet ingested
- Civics
- —
Market trends
- HPI YoY
- ▲ 2.50%
- Current HPI
- 254.7681
- Rent YoY
- —
- Metro
- —
- State GDP YoY
- ▲ 3.28%
- F500 in state
- 36
Industry mix (Fortune 500 HQ in FL)
| Industry | F500 HQs | Revenue |
|---|---|---|
| Industrial Technology | 2 | $29B |
|
||
| Insurance | 2 | $17B |
|
||
| Retail | 1 | $60B |
|
||
| Technology Distribution | 1 | $58B |
|
||
| Homebuilding | 1 | $35B |
|
||
| Technology Manufacturing | 1 | $35B |
|
||
Price history
+158.3% since first listed3 events — show timeline
- 2026-06-12 Listed $155,000 Stellar MLS as Distributed by MLS Grid
- 2015-03-04 Sold (Public Records) $58,000 Public Records
- 1985-04-01 Sold (Public Records) $60,000 Public Records
Property tax history
+1.3%/yrLatest (2025): $421 · +2.2% YoY. Source: county tax records.
Cash-flow waterfall
monthlySold comps — $/sqft
last 12 mo · ≤1 miLoading sold comps…