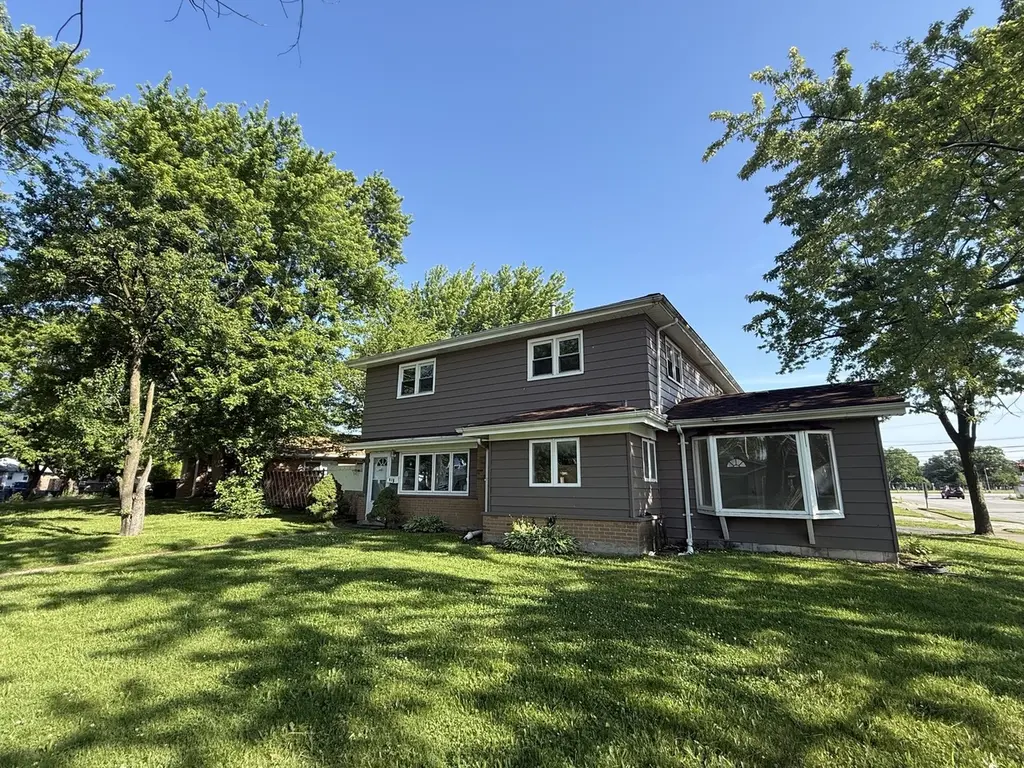
916 Williams St · Calumet City, IL
Flood risk 1/10 · Minimal
- FEMA flood zone
- X (unshaded)
- Chance of flooding over 30 yrs
- 0.0%
- Est. flood insurance / yr
- $473 – $860
Fire risk 1/10 · Minimal
- Est. fire insurance / yr
- $804 – $1,492
Heat risk 3/10 · Minor
- Hot days now (above 102°F)
- 7 days/yr
- Hot days in 30 yrs
- 15 days/yr
Wind risk 2/10 · Minimal
- Chance of severe wind over 30 yrs
- —
Air-quality risk 4/10 · Minor
- Unhealthy air days now
- 5 days/yr
- Unhealthy air days in 30 yrs
- 6 days/yr
Risk factors via First Street. Map © Google.
Why this score? — see what drove the B+ grade
The composite is a weighted blend of 9 inputs, each scored 0–100. Each bar is that input's sub-score; the figure is the points it added to the 100-point composite (weight × sub-score).
- Cash flow +30.0/30.0
- ARV discount +15.0/15.0
- 1% rule +10.0/10.0
- DSCR +10.0/10.0
- Rent growth +4.0/5.0
- Livability +3.6/5.0
- Condition / age +2.5/5.0
- Schools +1.0/10.0
- Appreciation +0.0/10.0
$150,000
🖨 Deal sheet (PDF) 📄 Offer letter ✓ Due diligence
Listing remarks
Spacious and versatile 6-bedroom, 2.5-bath home offering over 2,500 square feet of living space in the heart of Calumet City. This two-story residence features a functional layout with generously sized bedrooms on both levels, providing flexibility for large households, multigenerational living, or work-from-home needs. The home includes a bright living area, dedicated dining space, main-level laundry hook up, central air conditioning, and a detached 2-car garage. Situated on a well-sized corner lot, the property offers ample outdoor space for entertaining and everyday enjoyment. Conveniently located near schools, parks, shopping, dining, and major transportation routes. Whether you're look
Key facts
- 6,298 sq ft lot
- 2 garage spots
- Built 1963
Property features AI
Finance
- Other: Fee simple ownership
- HOA & community: No master association fee required
Exterior
- Parking: Detached garage with 2 garage spaces (2 total parking spaces)
- Utilities: Water from Lake Michigan and public supply; Public sewer and storm sewer; Electric service with fuses
- Home design: Detached single-family home; Two-story
- Construction: Aluminum siding and brick exterior; Built approximately 61–70 years ago; Originally built before 1978
- Exterior features: Lot dimensions approximately 50 x 125; Lot is less than 0.25 acre; Property currently leased
Interior
- Kitchen: Kitchen on main level
- Bedrooms: Six bedrooms (Master bedroom on second level; additional bedrooms on second and main levels)
- Bathrooms: Two full bathrooms and one half bathroom
- Heating & cooling: Natural gas heating; Central air conditioning
- Interior features: Nine total rooms; School bus service available
- Laundry & utility: Main-level laundry room (6 x 6)
Neighborhood map
What this means for you Summary
Snapshot
- This is a 4-bed/2.5-bath single-family listed at $150k.
Deal economics
- At list price, monthly cash flow is $803 ($10k/yr) — positive.
- The deal already cash-flows at list — no discount required.
- Meets the 1% rule at list price ($2k rent vs $150k).
- Recommended offer: $148k (1.5% below list) — sets the bar for market timing.
- Cap rate 12.7% vs local median 8.3% in Calumet City — top-decile yield for the area; either an underpriced asset or a hidden risk that comps aren't pricing in. Stress-test before assuming the spread holds.
Location & tenants
- Location reads 71/100 on livability (#330 in IL) — a middle-class / working-renter tenant base. Strengths: commute A+, cost of living A+, housing A+; Watch: employment C-, crime D-, amenities F.
- Thornton Fractional Twp Hsd 215 (suburban): math 9% / reading 13% proficiency, ranked #563 of 620 in IL (top 91%) — low school quality limits family demand, transient renter base, plan for 1-2y turnover.
- Zoned schools: Hoover Elem School (556 students, 0% FRL); Schrum Memorial School (math 24% / reading 24%, grade F, #332 of 665 statewide, top 55%, 277 students, 0% FRL); Thornton Fractnl No High School (math 6% / reading 10%, grade F, #587 of 693 statewide, top 85%, 1,383 students, 0% FRL).
- Market conditions: Rents rising fast (+6.2%/yr); 196 active listings in the ZIP; 6,272 units permitted in Cook County in 2024 (4,658 in 5+ unit buildings).
- At $2,328/mo this rent would consume 50% of the median local household income ($55k/yr) (locally 2415% of renters already pay >50% of income on rent) — very limited rent-growth headroom before tenants either downsize or default.
Forward outlook
- Local home prices are declining (-3.0%/yr); year-one equity from $1k of loan paydown is wiped out by about $4k of value loss. Plan a longer hold.
- At projected returns (-3.0% appreciation + 6.2% rent growth), your $42k cash investment doubles in ~5 years — after that, you're playing with house money.
Negotiation context
- It's been on market 15 days — a 2% lower offer ($148k) is reasonable based on typical stale-listing flexibility.
- 18 sale attempts since 8y ago with the ask held roughly flat each time — persistent listings suggest the price (not the market) is what's stuck; bring a comps-based counter.
- Current owner paid $105k; 43% above their basis — modest negotiation headroom, anchor on the comps not their cost.
Questions for the listing agent
- Built in 1963 — when were the roof, HVAC, electrical panel, plumbing, and water heater last replaced?
- Is there a deadline driving the sale (1031 exchange, divorce, estate, relocation)? That informs how much negotiation room exists.
- Schools are F-rated, which usually means shorter tenancies and higher turnover. Who's the typical renter profile here, and what's been the actual vacancy rate?
- Crime grade is D in this area — have there been break-ins, vandalism, or insurance claims at this property in the last 3 years? What carrier currently insures it and at what premium?
- What's the average days-on-market for RENTAL listings here right now (not sales)? A rising rental-DOM trend means longer vacancies and softer asking-rent achievability than the comps imply.
- What's the recent tenant-quality profile in this submarket — average credit score on applications, eviction rate, late-payment / NSF rate, and stable-employment percentage? A property-management company in the area should have these aggregated.
- How much new for-sale + rental construction is in the pipeline within 1–3 miles? Heavy new supply typically softens prices + rents 12–24 months out; constrained supply supports both.
Investment metrics
- 1% rule
- 1.55% ✓
- Cap rate
- 12.71%
- Cash-on-cash
- 22.93%
- DSCR
- 2.02
- GRM
- 5.4
CMA / ARV
- ARV (on-the-fly)
- $223,168
- Comps found
- 1
Show comp detail 1 sale within ~0.75 mi
| Address | Dist | Beds/Ba | Sqft | Sold | Price | $/sf | Match |
|---|---|---|---|---|---|---|---|
| 956 Greenbay Ave | 0.54mi | 4/1.0 | 2,164 (-15%) | 10mo | $190,000 | $88 | 36 |
Match score weights: distance 35% · size 25% · config 20% · recency 20%. Top-matched comps best support the ARV.
Projected returns pro-forma
-3.0% appreciation · 6.17% rent growth · sell at horizon
- IRR
- 19.4%
- Equity multiple
- 1.82×
- Total profit
- $34,510
- Equity at exit
- $22,365
- IRR
- 29.8%
- Equity multiple
- 4.09×
- Total profit
- $129,574
- Equity at exit
- $12,969
Cash invested: $42,000 (down + closing). Projections, not guarantees.
Landlord ↔ Tenant lean methodology
- Overall (STATE)
- 43 Moderately Tenant-Leaning
- State Illinois
- 43 Moderately Tenant-Leaning · D+7
- County
- — inherits STATE
- City
- — inherits STATE
ZIP-level market 60409
- Home prices YoY
- -27.6%
- Rents YoY
- 6.2%
- Active inventory
- 196
- Price-to-rent
- 5.4×
Monthly cashflow live
- Estimated rent
- $2,328 medium interval (Pro) →
- Mortgage (P&I)
- −$787
- Tax est. 1.5%
- −$188 /mo · $2,250/yr
- Insurance
- −$62
- HOA
- −$0
- Vacancy / Maint / Mgmt
- −$489
- Net cashflow
- $803
Break-even live
Sensitivity live
| Price | -10% $906 | -5% $854 | +0% $803 | +5% $751 | +10% $699 |
|---|---|---|---|---|---|
| Rent | -10% $619 | -5% $711 | +0% $803 | +5% $895 | +10% $987 |
| Rate | -1.0pp $878 | -0.5pp $841 | base $803 | +0.5pp $764 | +1.0pp $724 |
UW: 25.0% down · 7.5% · 30yr · 1.5% tax · 5.0% vac · 8.0% maint · 8.0% mgmt
Financing live
Cash to close
- Down payment
- $37,500
- Closing costs
- $4,500
- Reserves months
- —
- Total cash needed
- —
Loan-product check · same deal, 3 products live
Conventional
25% down · 7.5% · 30yr
- Down + closing
- —
- Monthly P&I
- —
- Monthly cashflow
- —
- DSCR
- —
- Eligible?
- —
Personal DTI + credit; lowest rate.
DSCR
20% down · 8.5% · 30yr
- Down + closing
- —
- Monthly P&I
- —
- Monthly cashflow
- —
- DSCR
- —
- Eligible?
- —
No personal income docs; deal must DSCR.
Hard money
10% down · 12.0% · 12mo
- Down + closing
- —
- Monthly P&I
- —
- Monthly cashflow
- —
- DSCR
- —
- Eligible?
- —
Short-term bridge; refi at stabilization.
Listing history 50 events
-
2026-06-21days on market $150,000 Active 15 DOM
-
2026-06-18days on market $150,000 Active 12 DOM
-
2026-06-17days on market $150,000 Active 11 DOM
-
2026-06-16days on market $150,000 Active 10 DOM
-
2026-06-15days on market $150,000 Active 9 DOM
-
2026-06-13days on market $150,000 Active 7 DOM
-
2026-06-09days on market $150,000 Active 3 DOM
-
2026-06-08days on market $150,000 Active 2 DOM
-
2026-06-07remarks 699-char remark
-
2026-06-07days on market $150,000 Active 1 DOM
-
2026-06-04days on market $150,000 Active 97 DOM
-
2026-06-03days on market $150,000 Active 96 DOM
-
2026-06-02days on market $150,000 Active 95 DOM
-
2026-06-01days on market $150,000 Active 94 DOM
-
2026-05-31days on market $150,000 Active 93 DOM
-
2026-02-27historical
-
2026-02-27$150,000 Active
-
2025-07-18Active
-
2025-07-17historical
-
2025-01-10Active
-
2025-01-10Active
-
2025-01-10historical
-
2020-10-09status Contingent
-
2020-10-09status Reactivated
-
2020-10-09status Pending
-
2020-10-08historical
-
2020-10-07status Reactivated
-
2020-10-02status Contingent
-
2020-09-08price
-
2020-09-08status Reactivated
-
2020-08-18status Pending
-
2020-08-03price
-
2020-08-03status Reactivated
-
2020-07-31historical
-
2020-07-27price
-
2020-07-14price
-
2020-07-09price
-
2020-06-16price
-
2020-05-18New
-
2020-05-18historical
-
2020-05-12price
-
2020-04-01price
-
2020-03-23New
-
2019-04-11status Pending
-
2019-04-08status Contingent (Do Not Show)
-
2019-04-04historical
-
2019-04-03New
-
2019-04-01status Reactivated
-
2019-03-23status Contingent (Do Not Show)
-
2019-03-18status Reactivated
ⓘ Source: listings_history table (triggers on properties + properties_extension) + one-shot
backfill from property_details.listing_events for pre-trigger history.
Climate risk First Street
- Flood 1/10 Low FEMA zone X (unshaded) · 0% chance over 30 yrs
- Wildfire 1/10 Low
- Heat 3/10 Moderate 7 d/yr ≥102°F today · 15 d/yr by 30 yrs out
- Wind 2/10 Low
- Air quality 4/10 Moderate 5 unhealthy d/yr today · 6 by 30 yrs out
Nearby sold comps map
Loading sold comps map…
Walkable amenities ~0.75 mi
Loading nearby amenities…
Taxation est. · year 1
- Rental income
- $27,938
- − Mortgage interest
- −$8,402
- − Property taxes
- −$2,250
- − Insurance
- −$750
- − Repairs & maintenance
- −$2,235
- − Management
- −$2,235
- − Depreciation
- −$4,364
- Taxable income
- $7,702
- Est. tax owed @ 24.0%
- −$1,848
- After-tax cash flow
- $7,783/yr
For passive investors: Depreciation is non-cash, so a rental often shows a tax loss while cash-flowing — sheltering income. Rental losses are passive: they offset passive income freely, and up to $25,000/yr can offset ordinary (W-2) income if you actively participate and your MAGI is under $100k (phasing out to $0 by $150k); unused losses carry forward. On sale, claimed depreciation is recaptured at up to 25%, and gains may owe capital-gains tax (a 1031 exchange can defer both). Figures are a year-1 estimate at your 24.0% rate — not tax advice; consult a CPA.
Schools (NCES district)
- District
- Thornton Fractional Twp Hsd 215
- NCES district ID
- 1738940
- Math proficiency
- 9% ▼ -3.00%
- Reading proficiency
- 13% ▼ -3.00%
- Median HH income
- $48,207
- Composite
- 10.27/100
- National rank
- #9793
- State rank
- #563 of 620 in IL
Livability — Calumet City
- Score
- 71/100
- State rank
- #330
- US rank
- #6552
Category grades
Schools grade is shown separately in the Schools card above.
Census & demographics
- Census place
- Calumet City, IL
- County
- Cook County · 4,486,803 people
- City population
- 35,100
- Metro
- Chicago-Naperville-Elgin, IL-IN-WI
- Population (ZIP)
- 35,100
- Household income
- $55,369
- Rent vs Own
- Severe rent burden
- 2415.0
Population outlook (Cook County) Hauer SSP2
- Today (2025)
- 5,347,519 people
- By 2030
- 5,357,703 · +0.2%
- By 2040
- 5,324,924 · -0.4%
- By 2050
- 5,230,762 · -2.2%
- By 2075
- 4,785,735 · -10.5%
- By 2100
- 4,188,836 · -21.7%
Race, ethnicity, and origin ACS 2023
- Neighborhood character
- Predominantly Black (74%)
- Race & ethnicity
- Black 74% Hispanic / Latino 15% White 7% Two or more races 4%
- Hispanic origin (detail)
- Mexican 14%
- Common ancestry
- Romanian 2%
- Foreign-born
- 9% · Canada
- Languages at home
- 83% English-only · Spanish 14%
Political lean MEDSL · Cook
- 2024 margin
- Solid D (+42.0) · D 70.4% · R 28.4% · Other 1.2%
- 2008→2024 swing
- -11.4pp toward R · 2008: 53.4pp · 2024: 42.0pp
- All cycles
- 2024: D+42.0 2020: D+50.3 2016: D+53.0 2012: D+49.4 2008: D+53.4
Not yet ingested
- Civics
- —
Market trends
- HPI YoY
- ▼ -75.01%
- Current HPI
- 197.2137
- Rent YoY
- ▲ 6.17%
- Metro
- Chicago-Naperville-Elgin, IL-IN-WI
- State GDP YoY
- ▲ 1.59%
- F500 in state
- 60
Industry mix (Fortune 500 HQ in IL)
| Industry | F500 HQs | Revenue |
|---|---|---|
| Insurance | 4 | $201B |
|
||
| Consumer Goods | 4 | $87B |
|
||
| Industrial Machinery | 3 | $64B |
|
||
| Healthcare | 2 | $55B |
|
||
| Retail / Pharmacy | 1 | $148B |
|
||
| Agriculture / Food | 1 | $86B |
|
||
Price history
+42.9% since first listed49 events — show timeline
- 2026-02-27 Listed $150,000 MRED as Distributed by MLS Grid
- 2026-02-27 Listing Removed — MRED as Distributed by MLS Grid
- 2025-07-18 Listed — MRED as Distributed by MLS Grid
- 2025-07-17 Listing Removed — MRED as Distributed by MLS Grid
- 2025-01-10 Listing Removed — MRED as Distributed by MLS Grid
- 2025-01-10 Listed — MRED as Distributed by MLS Grid
- 2025-01-10 Listed — MRED as Distributed by MLS Grid
- 2020-10-09 Pending — MRED as Distributed by MLS Grid
- 2020-10-09 Relisted — MRED as Distributed by MLS Grid
- 2020-10-09 Pending — MRED as Distributed by MLS Grid
- 2020-10-08 Listing Removed — MRED as Distributed by MLS Grid
- 2020-10-07 Relisted — MRED as Distributed by MLS Grid
- 2020-10-02 Pending — MRED as Distributed by MLS Grid
- 2020-09-08 Price Changed — MRED as Distributed by MLS Grid
- 2020-09-08 Relisted — MRED as Distributed by MLS Grid
- 2020-08-18 Pending — MRED as Distributed by MLS Grid
- 2020-08-03 Price Changed — MRED as Distributed by MLS Grid
- 2020-08-03 Relisted — MRED as Distributed by MLS Grid
- 2020-07-31 Listing Removed — MRED as Distributed by MLS Grid
- 2020-07-27 Price Changed — MRED as Distributed by MLS Grid
- 2020-07-14 Price Changed — MRED as Distributed by MLS Grid
- 2020-07-09 Price Changed — MRED as Distributed by MLS Grid
- 2020-06-16 Price Changed — MRED as Distributed by MLS Grid
- 2020-05-18 Listing Removed — MRED as Distributed by MLS Grid
- 2020-05-18 Listed — MRED as Distributed by MLS Grid
- 2020-05-12 Price Changed — MRED as Distributed by MLS Grid
- 2020-04-01 Price Changed — MRED as Distributed by MLS Grid
- 2020-03-23 Listed — MRED as Distributed by MLS Grid
- 2019-04-11 Pending — MRED as Distributed by MLS Grid
- 2019-04-08 Pending — MRED as Distributed by MLS Grid
- 2019-04-04 Listing Removed — MRED as Distributed by MLS Grid
- 2019-04-03 Listed — MRED as Distributed by MLS Grid
- 2019-04-01 Relisted — MRED as Distributed by MLS Grid
- 2019-03-23 Pending — MRED as Distributed by MLS Grid
- 2019-03-18 Relisted — MRED as Distributed by MLS Grid
- 2019-03-18 Pending — MRED as Distributed by MLS Grid
- 2019-03-04 Listed — MRED as Distributed by MLS Grid
- 2019-02-27 Listing Removed — MRED as Distributed by MLS Grid
- 2019-02-15 Price Changed — MRED as Distributed by MLS Grid
- 2019-02-14 Relisted — MRED as Distributed by MLS Grid
- 2018-12-12 Contingent — MRED as Distributed by MLS Grid
- 2018-12-10 Listing Removed — MRED as Distributed by MLS Grid
- 2018-12-05 Price Changed — MRED as Distributed by MLS Grid
- 2018-12-04 Relisted — MRED as Distributed by MLS Grid
- 2018-11-26 Listing Removed — MRED as Distributed by MLS Grid
- 2018-11-09 Relisted — MRED as Distributed by MLS Grid
- 2018-10-08 Pending — MRED as Distributed by MLS Grid
- 2018-08-28 Listed — MRED as Distributed by MLS Grid
- 2003-12-09 Sold (Public Records) $105,000 Public Records
Property tax history
+6.1%/yrLatest (2023): $11,179 · +10.2% YoY. Source: county tax records.
Cash-flow waterfall
monthlySold comps — $/sqft
last 12 mo · ≤1 miLoading sold comps…