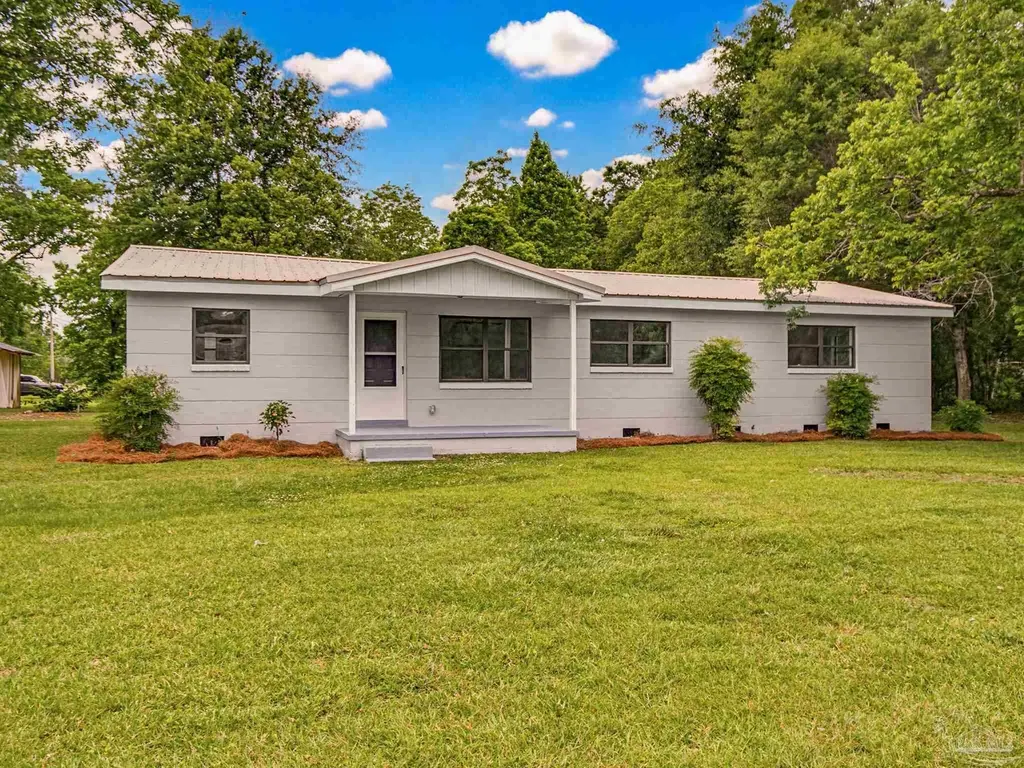
125 Madrid Rd · Gonzalez, FL
Flood risk 1/10 · Minimal
- FEMA flood zone
- X (unshaded)
- Chance of flooding over 30 yrs
- 0.0%
- Est. flood insurance / yr
- $507 – $1,088
Fire risk 3/10 · Minor
- Est. fire insurance / yr
- $947 – $1,759
Heat risk 9/10 · Severe
- Hot days now (above 105°F)
- 7 days/yr
- Hot days in 30 yrs
- 22 days/yr
Wind risk 9/10 · Severe
- Chance of severe wind over 30 yrs
- 99.0%
Air-quality risk 1/10 · Minimal
- Unhealthy air days now
- 0 days/yr
- Unhealthy air days in 30 yrs
- 0 days/yr
Risk factors via First Street. Map © Google.
Why this score? — see what drove the D grade
The composite is a weighted blend of 9 inputs, each scored 0–100. Each bar is that input's sub-score; the figure is the points it added to the 100-point composite (weight × sub-score).
- Cash flow +18.2/30.0
- DSCR +5.7/10.0
- 1% rule +3.9/10.0
- ARV discount +3.6/15.0
- Schools +3.6/10.0
- Livability +3.6/5.0
- Rent growth +2.5/5.0
- Condition / age +2.5/5.0
- Appreciation +0.0/10.0
$239,000
🖨 Deal sheet (PDF) 📄 Offer letter ✓ Due diligence
Listing remarks MLS
This home sits on almost 3 quarters of an acre. Features 1368 sqft of living space, 3 spacious bedrooms, 1 full bathroom and a large living area. A short stroll down the street in this quiet neighborhood is a huge open field and playground.
Key facts
- Spacious yard
- Quartz countertops
- Metal roof
Tags
Property features AI
Finance
- Other: Lot size approximately 0.7 acres; Directions: Take Hwy 29 N, left on Muscogee, right onto Madrid; house will be on the left.
- HOA & community: No association
Exterior
- Parking: Driveway with open parking
- Utilities: Copper wiring for electric; Septic tank; Paved road access (county maintained)
- Home design: Single-story (one level); Detached property; Resale condition; Homestead-eligible
- Construction: Block construction; Off-grade foundation; Metal roof; Building area approx. 1,368 total
- Exterior features: Corner lot; Yard building (outbuilding)
Interior
- Kitchen: Remodeled kitchen with island (updated within 1 year; all new); Dishwasher; ENERGY STAR qualified dishwasher and appliances
- Bedrooms: Primary bedroom on the first floor (approx. 14.5' x 11'); Second bedroom on the first floor (approx. 12.5' x 11')
- Bathrooms: Two full bathrooms; Remodeled bathrooms (updated within 1 year; all new)
- Interior features: Ceiling fan(s); Living/dining combo
- Laundry & utility: Electric water heater; ENERGY STAR qualified water heater
Neighborhood map
What this means for you Summary
Snapshot
- This is a 4-bed/1.0-bath single-family listed at $239k.
Deal economics
- At list price, monthly cash flow is $214 ($3k/yr) — positive.
- The deal already cash-flows at list — no discount required.
- To meet the 1% rule (rent ≥ 1% of price), the offer needs to be $214k (10.6% below list).
- Recommended offer: $214k (10.6% below list) — sets the bar for 1% rule.
- Cap rate 7.4% vs local median 4.2% in Gonzalez — top-decile yield for the area; either an underpriced asset or a hidden risk that comps aren't pricing in. Stress-test before assuming the spread holds.
Location & tenants
- Location reads 71/100 on livability (#385 in FL) — a middle-class / working-renter tenant base. Strengths: cost of living A+, housing A+, employment A; Watch: amenities F, commute F, health & safety F.
- Escambia (suburban): math 40% / reading 45% proficiency, ranked #56 of 73 in FL (top 77%) — families likely to look elsewhere, expect single-tenant / working-renter base with shorter leases.
- Zoned schools: Jim Allen Elementary School (math 54% / reading 53%, grade C, #949 of 2,144 statewide, top 45%, 677 students, 61% FRL); Ransom Middle School (math 54% / reading 52%, grade C+, #209 of 571 statewide, top 37%, 1,224 students, 49% FRL); J. M. Tate Senior High School (math 42% / reading 52%, grade D-, #207 of 667 statewide, top 32%, 2,110 students, 44% FRL).
- Market conditions: 511 active listings in the ZIP; solid renter incomes; 1,479 units permitted in Escambia County in 2024 (0 in 5+ unit buildings).
Forward outlook
- Local home prices are declining (-3.0%/yr); year-one equity from $2k of loan paydown is wiped out by about $7k of value loss. Plan a longer hold.
- Escambia County population projected at +13% by 2050 — modest demand growth; plan on rents tracking national, not racing it.
Negotiation context
- It's been on market 38 days — a 3% lower offer ($232k) is reasonable based on typical stale-listing flexibility.
- 2 sale attempts since 7y ago with the ask held roughly flat each time — persistent listings suggest the price (not the market) is what's stuck; bring a comps-based counter.
- Current owner paid $68k; list at $239k implies a 251% gain — meaningful room to come down on a strong offer.
Risks & watch-outs
- Climate carrying-cost: severe wind risk, 99% chance of damaging wind over 30y; extreme-heat days projected 7→22/yr by 2055 (HVAC capex compounding) — expect insurance premiums to compound above CPI over the hold.
Questions for the listing agent
- It's been on market 38 days. Have you received any prior offers? Is the seller open to a 11% concession, seller financing, or rate buy-down credit?
- Built in 1961 — when were the roof, HVAC, electrical panel, plumbing, and water heater last replaced?
- Is there a deadline driving the sale (1031 exchange, divorce, estate, relocation)? That informs how much negotiation room exists.
- The area grade is low — what's the realistic commute time and amenity access for the typical tenant pool here? Any planned neighborhood developments (good or bad) we should know about?
- What's the average days-on-market for RENTAL listings here right now (not sales)? A rising rental-DOM trend means longer vacancies and softer asking-rent achievability than the comps imply.
- What's the recent tenant-quality profile in this submarket — average credit score on applications, eviction rate, late-payment / NSF rate, and stable-employment percentage? A property-management company in the area should have these aggregated.
- How much new for-sale + rental construction is in the pipeline within 1–3 miles? Heavy new supply typically softens prices + rents 12–24 months out; constrained supply supports both.
Investment metrics
- 1% rule
- 0.89% ✗
- Cap rate
- 7.37%
- Cash-on-cash
- 3.83%
- DSCR
- 1.17
- GRM
- 9.3
CMA / ARV
- ARV (median comp)
- $219,841
- List price
- $239,000
- Delta
- 8.72%
- Verdict
- FAIR
- Comps
- 20 within 1.0 mi
Show comp detail 7 sales within ~0.75 mi
| Address | Dist | Beds/Ba | Sqft | Sold | Price | $/sf | Match |
|---|---|---|---|---|---|---|---|
| 147 San Carlos Dr | 0.16mi | 3/2.0 (-1) | 1,431 (+5%) | 13mo | $220,000 | $154 | 65 |
| 1120 Muscogee Rd | 0.30mi | 3/2.0 (-1) | 1,449 (+6%) | 3mo | $240,000 | $166 | 64 |
| 173 Navarro Rd | 0.49mi | 4/1.5 | 1,404 (+3%) | 13mo | $280,500 | $200 | 60 |
| 1037 Isabella Rd | 0.19mi | 3/2.0 (-1) | 1,215 (-11%) | 9mo | $280,000 | $230 | 56 |
| 1121 Muscogee Rd | 0.34mi | 3/1.0 (-1) | 1,276 (-7%) | 23mo | $205,000 | $161 | 49 |
| 143 Santa Rosa Rd | 0.27mi | 3/1.5 (-1) | 1,176 (-14%) | 12mo | $140,000 | $119 | 47 |
| 200 San Carlos Rd | 0.44mi | 3/2.0 (-1) | 1,526 (+12%) | 22mo | $275,000 | $180 | 33 |
Match score weights: distance 35% · size 25% · config 20% · recency 20%. Top-matched comps best support the ARV.
Projected returns pro-forma
-3.0% appreciation · 3.0% rent growth · sell at horizon
- IRR
- -10.3%
- Equity multiple
- 0.62×
- Total profit
- $-25,199
- Equity at exit
- $35,636
- IRR
- -1.0%
- Equity multiple
- 0.93×
- Total profit
- $-4,734
- Equity at exit
- $20,664
Cash invested: $66,920 (down + closing). Projections, not guarantees.
Landlord ↔ Tenant lean methodology
- Overall (STATE)
- 87 Strongly Landlord-Friendly
- State Florida
- 87 Strongly Landlord-Friendly · R+3
- County
- — inherits STATE
- City
- — inherits STATE
ZIP-level market 32533
- Home prices YoY
- -14.6%
- Active inventory
- 511
- Price-to-rent
- 9.3×
Monthly cashflow live
- Estimated rent
- $2,138 medium interval (Pro) →
- Mortgage (P&I)
- −$1,253
- Tax from tax record
- −$122 /mo · $1,467/yr
- Insurance
- −$100
- HOA
- −$0
- Vacancy / Maint / Mgmt
- −$449
- Net cashflow
- $214
Break-even live
Sensitivity live
| Price | -10% $349 | -5% $281 | +0% $214 | +5% $146 | +10% $78 |
|---|---|---|---|---|---|
| Rent | -10% $45 | -5% $129 | +0% $214 | +5% $298 | +10% $382 |
| Rate | -1.0pp $334 | -0.5pp $274 | base $214 | +0.5pp $152 | +1.0pp $89 |
UW: 25.0% down · 7.5% · 30yr · 1.5% tax · 5.0% vac · 8.0% maint · 8.0% mgmt
Financing live
Cash to close
- Down payment
- $59,750
- Closing costs
- $7,170
- Reserves months
- —
- Total cash needed
- —
Loan-product check · same deal, 3 products live
Conventional
25% down · 7.5% · 30yr
- Down + closing
- —
- Monthly P&I
- —
- Monthly cashflow
- —
- DSCR
- —
- Eligible?
- —
Personal DTI + credit; lowest rate.
DSCR
20% down · 8.5% · 30yr
- Down + closing
- —
- Monthly P&I
- —
- Monthly cashflow
- —
- DSCR
- —
- Eligible?
- —
No personal income docs; deal must DSCR.
Hard money
10% down · 12.0% · 12mo
- Down + closing
- —
- Monthly P&I
- —
- Monthly cashflow
- —
- DSCR
- —
- Eligible?
- —
Short-term bridge; refi at stabilization.
Listing history 19 events
-
2026-06-21days on market $239,000 Active 38 DOM
-
2026-06-18days on market $239,000 Active 35 DOM
-
2026-06-17days on market $239,000 Active 34 DOM
-
2026-06-16days on market $239,000 Active 33 DOM
-
2026-06-15days on market $239,000 Active 32 DOM
-
2026-06-14days on market $239,000 Active 30 DOM
-
2026-06-10days on market $239,000 Active 27 DOM
-
2026-06-09days on market $239,000 Active 26 DOM
-
2026-06-08days on market $239,000 Active 25 DOM
-
2026-06-07days on market $239,000 Active 24 DOM
-
2026-06-03days on market $239,000 Active 20 DOM
-
2026-06-02days on market $239,000 Active 19 DOM
-
2026-06-01days on market $239,000 Active 18 DOM
-
2026-05-31days on market $239,000 Active 17 DOM
-
2026-05-31days on market $239,000 Active 16 DOM
-
2026-05-14$239,000 Active 565-char remark
-
2019-10-21soldstatus $68,000
-
2019-10-18soldstatus $68,000 242-char remark
Show marketing remark (242 chars)
This home sits on almost 3 quarters of an acre. Features 1368 sqft of living space, 3 spacious bedrooms, 1 full bathroom and a large living area. A short stroll down the street in this quiet neighborhood is a huge open field and playground.
-
2019-07-21$76,000 242-char remark
Show marketing remark (242 chars)
This home sits on almost 3 quarters of an acre. Features 1368 sqft of living space, 3 spacious bedrooms, 1 full bathroom and a large living area. A short stroll down the street in this quiet neighborhood is a huge open field and playground.
ⓘ Source: listings_history table (triggers on properties + properties_extension) + one-shot
backfill from property_details.listing_events for pre-trigger history.
Tax reassessment forecast FL · Resets to sale price
- Current annual tax
- $1,467 · $122/mo
- Projected year-2 tax
- $1,984 · $165/mo
- Expected delta
- +$517/yr (+$43/mo · 35.2%)
ⓘ Screening estimate from a state-policy table — verify with the county assessor before closing.
Climate risk First Street
- Flood 1/10 Low FEMA zone X (unshaded) · 0% chance over 30 yrs
- Wildfire 3/10 Moderate
- Heat 9/10 Extreme 7 d/yr ≥105°F today · 22 d/yr by 30 yrs out
- Wind 9/10 Extreme 99% chance of damaging wind over 30 yrs
- Air quality 1/10 Low 0 unhealthy d/yr today · 0 by 30 yrs out
Nearby sold comps map
Loading sold comps map…
Walkable amenities ~0.75 mi
Loading nearby amenities…
Taxation est. · year 1
- Rental income
- $25,653
- − Mortgage interest
- −$13,388
- − Property taxes
- −$1,467
- − Insurance
- −$1,195
- − Repairs & maintenance
- −$2,052
- − Management
- −$2,052
- − Depreciation
- −$6,953
- Taxable loss
- −$1,454
- Est. tax savings @ 24.0%
- +$349
- After-tax cash flow
- $2,912/yr
For passive investors: Depreciation is non-cash, so a rental often shows a tax loss while cash-flowing — sheltering income. Rental losses are passive: they offset passive income freely, and up to $25,000/yr can offset ordinary (W-2) income if you actively participate and your MAGI is under $100k (phasing out to $0 by $150k); unused losses carry forward. On sale, claimed depreciation is recaptured at up to 25%, and gains may owe capital-gains tax (a 1031 exchange can defer both). Figures are a year-1 estimate at your 24.0% rate — not tax advice; consult a CPA.
Schools (NCES district)
- District
- Escambia
- NCES district ID
- 1200510
- Math proficiency
- 40% ▼ -9.00%
- Reading proficiency
- 45% ▼ -4.00%
- Median HH income
- $44,649
- Composite
- 36.04/100
- National rank
- #4773
- State rank
- #56 of 73 in FL
Livability — Gonzalez
- Score
- 71/100
- State rank
- #385
- US rank
- #6813
Category grades
Schools grade is shown separately in the Schools card above.
Census & demographics
- County
- Escambia County · 301,722 people
- Metro
- Pensacola-Ferry Pass-Brent, FL
- Population (ZIP)
- 31,860
- Household income
- $86,087
- Rent vs Own
- Severe rent burden
- 389.0
Population outlook (Escambia County) Hauer SSP2
- Today (2025)
- 334,637 people
- By 2030
- 345,779 · +3.3%
- By 2040
- 364,828 · +9.0%
- By 2050
- 378,514 · +13.1%
- By 2075
- 403,220 · +20.5%
- By 2100
- 386,125 · +15.4%
Race, ethnicity, and origin ACS 2023
- Neighborhood character
- Predominantly White (74%)
- Race & ethnicity
- White 74% Black 12% Two or more races 8% Hispanic / Latino 4% Asian 3%
- Common ancestry
- Italian 2% Serbian 2% Lithuanian 2%
- Foreign-born
- 3% · Canada, Guatemala, China
- Languages at home
- 96% English-only · Spanish 2% Vietnamese 1%
Political lean MEDSL · Escambia
- 2024 margin
- R (+19.5) · D 39.7% · R 59.2% · Other 1.1%
- 2008→2024 swing
- -0.2pp no change · 2008: -19.3pp · 2024: -19.5pp
- All cycles
- 2024: R+19.5 2020: R+15.1 2016: R+20.6 2012: R+20.6 2008: R+19.3
Not yet ingested
- Civics
- —
Market trends
- HPI YoY
- ▼ -44.13%
- Current HPI
- 259.2605
- Rent YoY
- —
- Metro
- Pensacola-Ferry Pass-Brent, FL
- State GDP YoY
- ▲ 3.28%
- F500 in state
- 36
Industry mix (Fortune 500 HQ in FL)
| Industry | F500 HQs | Revenue |
|---|---|---|
| Industrial Technology | 2 | $29B |
|
||
| Insurance | 2 | $17B |
|
||
| Retail | 1 | $60B |
|
||
| Technology Distribution | 1 | $58B |
|
||
| Homebuilding | 1 | $35B |
|
||
| Technology Manufacturing | 1 | $35B |
|
||
Price history
+214.5% since first listed4 events — show timeline
- 2026-05-14 Listed $239,000 PARMLS
- 2019-10-21 Sold (Public Records) $68,000 Public Records
- 2019-10-18 Sold (MLS) $68,000 PARMLS
- 2019-07-21 Listed $76,000 PARMLS
Property tax history
+10.3%/yrLatest (2025): $1,467 · +10.8% YoY. Source: county tax records.
Cash-flow waterfall
monthlySold comps — $/sqft
last 12 mo · ≤1 miLoading sold comps…