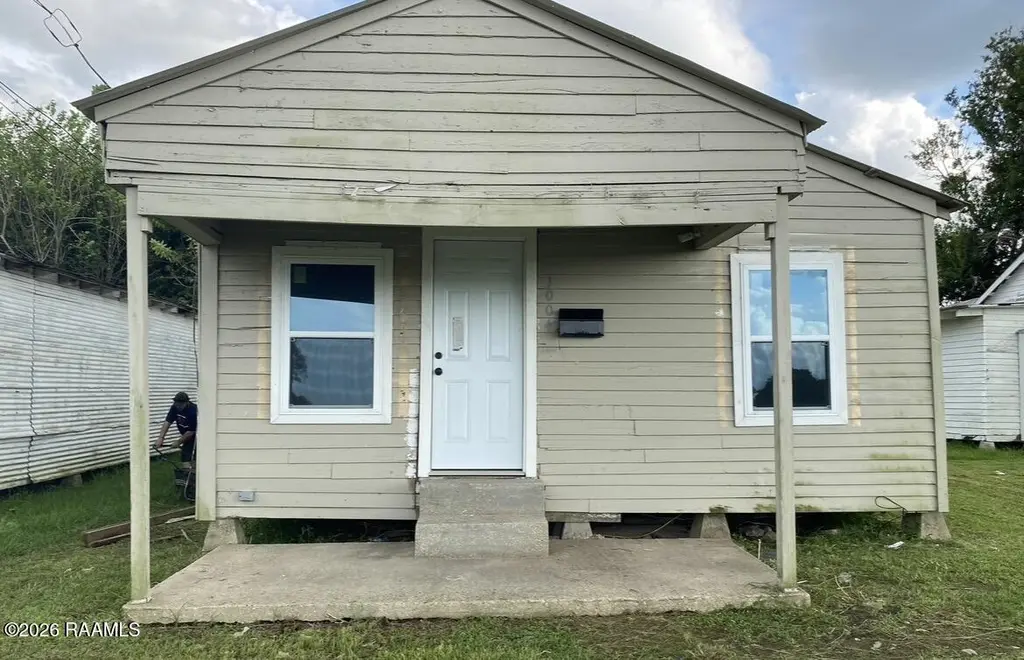
1004 E Jefferson Davis · Rayne, LA
Flood risk 1/10 · Minimal
- FEMA flood zone
- X (unshaded)
- Chance of flooding over 30 yrs
- 0.0%
- Est. flood insurance / yr
- $507 – $1,088
Fire risk 2/10 · Minimal
- Est. fire insurance / yr
- $1,269 – $2,357
Heat risk 9/10 · Severe
- Hot days now (above 109°F)
- 7 days/yr
- Hot days in 30 yrs
- 20 days/yr
Wind risk 9/10 · Severe
- Chance of severe wind over 30 yrs
- 99.0%
Air-quality risk 1/10 · Minimal
- Unhealthy air days now
- 0 days/yr
- Unhealthy air days in 30 yrs
- 0 days/yr
Risk factors via First Street. Map © Google.
Why this score? — see what drove the B- grade
The composite is a weighted blend of 9 inputs, each scored 0–100. Each bar is that input's sub-score; the figure is the points it added to the 100-point composite (weight × sub-score).
- Cash flow +30.0/30.0
- 1% rule +10.0/10.0
- DSCR +10.0/10.0
- ARV discount +7.5/15.0
- Livability +3.8/5.0
- Schools +3.2/10.0
- Rent growth +2.5/5.0
- Condition / age +2.2/5.0
- Appreciation +0.0/10.0
$50,000
🖨 Deal sheet (PDF) 📄 Offer letter ✓ Due diligence
Key facts
- 0.45 acre lot
- Parking
- Listed 50 days
Property features AI
Exterior
- Parking: Assigned parking; Open parking
- Utilities: Public/communal sewer; City electricity
- Home design: Single family residence
- Construction: Metal roof; Wood siding and block construction
- Exterior features: Front porch; Highway frontage
Interior
- Kitchen: Electric stove
- Bedrooms: Two bedrooms
- Flooring: Tile flooring; Vinyl tile flooring
- Bathrooms: One full bathroom
- Heating & cooling: Electric heating; Natural gas heating; Window unit cooling
- Interior features: Includes family room and kitchen; Bedroom 1; Bedroom 2; Bathroom 1
- Laundry & utility: Gas dryer hookup
Neighborhood map
What this means for you Summary
Snapshot
- This is a 3-bed/1.0-bath single-family listed at $50k. Condition is rated fair.
Deal economics
- At list price, monthly cash flow is $563 ($7k/yr) — positive.
- The deal already cash-flows at list — no discount required.
- Meets the 1% rule at list price ($1k rent vs $50k).
- Recommended offer: $48k (3.0% below list) — sets the bar for market timing.
- Cap rate 19.8% vs local median 4.7% in Rayne — top-decile yield for the area; either an underpriced asset or a hidden risk that comps aren't pricing in. Stress-test before assuming the spread holds.
Location & tenants
- Location reads 75/100 on livability (#18 in LA, #3,895 nationally) — a middle-class / working-renter tenant base. Strengths: crime A+, cost of living A+, housing A+; Watch: amenities F, commute F, employment F.
- Acadia Parish (rural): math 32% / reading 44% proficiency, ranked #28 of 98 in LA (top 29%) — families likely to look elsewhere, expect single-tenant / working-renter base with shorter leases; 62% free/reduced lunch — lower-income household profile, screen leases tightly.
- Market conditions: 96 active listings in the ZIP; 2 comparable units currently listed for rent nearby; 137 units permitted in Acadia Parish in 2024 (0 in 5+ unit buildings).
Forward outlook
- Local home prices are declining (-3.0%/yr); year-one equity from $346 of loan paydown is wiped out by about $2k of value loss. Plan a longer hold.
- At projected returns (-3.0% appreciation + 3.0% rent growth), your $14k cash investment doubles in ~3 years — after that, you're playing with house money.
Negotiation context
- It's been on market 50 days — a 3% lower offer ($48k) is reasonable based on typical stale-listing flexibility.
Risks & watch-outs
- Climate carrying-cost: severe wind risk, 99% chance of damaging wind over 30y; extreme-heat days projected 7→20/yr by 2055 (HVAC capex compounding) — expect insurance premiums to compound above CPI over the hold.
Questions for the listing agent
- It's been on market 50 days. Have you received any prior offers? Is the seller open to a 3% concession, seller financing, or rate buy-down credit?
- Have any recent inspections been done? Can we get a copy of the seller's disclosures and any deferred-maintenance estimates?
- Is there a deadline driving the sale (1031 exchange, divorce, estate, relocation)? That informs how much negotiation room exists.
- Schools are B-rated — typically a magnet for longer-tenancy family renters. What's the average tenant stay here, and is there a school-zone premium baked into asking?
- What's the average days-on-market for RENTAL listings here right now (not sales)? A rising rental-DOM trend means longer vacancies and softer asking-rent achievability than the comps imply.
- What's the recent tenant-quality profile in this submarket — average credit score on applications, eviction rate, late-payment / NSF rate, and stable-employment percentage? A property-management company in the area should have these aggregated.
- How much new for-sale + rental construction is in the pipeline within 1–3 miles? Heavy new supply typically softens prices + rents 12–24 months out; constrained supply supports both.
Investment metrics
- 1% rule
- 2.30% ✓
- Cap rate
- 19.81%
- Cash-on-cash
- 48.26%
- DSCR
- 3.15
- GRM
- 3.6
CMA / ARV
- ARV (on-the-fly)
- $139,200
- Comps found
- 12
Show comp detail 12 sales within ~0.75 mi
| Address | Dist | Beds/Ba | Sqft | Sold | Price | $/sf | Match |
|---|---|---|---|---|---|---|---|
| 108 Marjorie St | 0.25mi | 3/2.0 | 1,276 (+6%) | 2mo | $178,000 | $139 | 72 |
| 600 N Chevis St | 0.26mi | 3/1.0 | 1,120 (-7%) | 8mo | $19,000 | $17 | 70 |
| 420 Elizabeth Dr | 0.22mi | 2/1.0 (-1) | 1,200 (0%) | 18mo | $115,000 | $96 | 70 |
| 410 Karen Dr | 0.19mi | 2/2.0 (-1) | 1,202 (+0%) | 14mo | $40,000 | $33 | 70 |
| 208 N Cunningham St | 0.47mi | 2/1.0 (-1) | 1,103 (-8%) | 4mo | $115,000 | $104 | 57 |
| 911 E Harrop St | 0.28mi | 3/2.0 | 1,344 (+12%) | 9mo | $165,000 | $123 | 55 |
| 205 N Cunningham St | 0.53mi | 3/2.0 | 1,280 (+7%) | 7mo | $175,000 | $137 | 54 |
| 511 E Harrop St | 0.39mi | 2/1.0 (-1) | 1,100 (-8%) | 13mo | $90,000 | $82 | 52 |
| 309 E Edwards St | 0.54mi | 3/2.0 | 1,280 (+7%) | 11mo | $179,000 | $140 | 50 |
| 307 E Edwards St | 0.55mi | 3/2.0 | 1,280 (+7%) | 15mo | $175,000 | $137 | 47 |
| 401 Kathy Dr | 0.24mi | 2/2.0 (-1) | 1,304 (+9%) | 23mo | $151,000 | $116 | 46 |
| 1705 Electa St | 0.40mi | 2/1.5 (-1) | 1,075 (-10%) | 23mo | $115,000 | $107 | 38 |
Match score weights: distance 35% · size 25% · config 20% · recency 20%. Top-matched comps best support the ARV.
Projected returns pro-forma
-3.0% appreciation · 3.0% rent growth · sell at horizon
- IRR
- 45.8%
- Equity multiple
- 2.98×
- Total profit
- $27,775
- Equity at exit
- $7,455
- IRR
- 51.6%
- Equity multiple
- 6.03×
- Total profit
- $70,431
- Equity at exit
- $4,323
Cash invested: $14,000 (down + closing). Projections, not guarantees.
Landlord ↔ Tenant lean methodology
- Overall (STATE)
- 90 Strongly Landlord-Friendly
- State Louisiana
- 90 Strongly Landlord-Friendly · R+12
- County
- — inherits STATE
- City
- — inherits STATE
ZIP-level market 70578
- Active inventory
- 96
- Price-to-rent
- 3.6×
Monthly cashflow live
- Estimated rent
- $1,150 medium interval (Pro) →
- Mortgage (P&I)
- −$262
- Tax est. 1.5%
- −$62 /mo · $750/yr
- Insurance
- −$21
- HOA
- −$0
- Vacancy / Maint / Mgmt
- −$242
- Net cashflow
- $563
Break-even live
Sensitivity live
| Price | -10% $598 | -5% $580 | +0% $563 | +5% $546 | +10% $528 |
|---|---|---|---|---|---|
| Rent | -10% $472 | -5% $518 | +0% $563 | +5% $608 | +10% $654 |
| Rate | -1.0pp $588 | -0.5pp $576 | base $563 | +0.5pp $550 | +1.0pp $537 |
UW: 25.0% down · 7.5% · 30yr · 1.5% tax · 5.0% vac · 8.0% maint · 8.0% mgmt
Financing live
Cash to close
- Down payment
- $12,500
- Closing costs
- $1,500
- Reserves months
- —
- Total cash needed
- —
Loan-product check · same deal, 3 products live
Conventional
25% down · 7.5% · 30yr
- Down + closing
- —
- Monthly P&I
- —
- Monthly cashflow
- —
- DSCR
- —
- Eligible?
- —
Personal DTI + credit; lowest rate.
DSCR
20% down · 8.5% · 30yr
- Down + closing
- —
- Monthly P&I
- —
- Monthly cashflow
- —
- DSCR
- —
- Eligible?
- —
No personal income docs; deal must DSCR.
Hard money
10% down · 12.0% · 12mo
- Down + closing
- —
- Monthly P&I
- —
- Monthly cashflow
- —
- DSCR
- —
- Eligible?
- —
Short-term bridge; refi at stabilization.
Rent comps 2 comps
| Address | Beds | Baths | Sqft | Rent | $/sqft | DOM | Units | Dist |
|---|---|---|---|---|---|---|---|---|
| 422 Ann Dr Rayne, LA | 3.0 | 1.0 | 1100 | $995 | $0.90 | 21d | 1 | 0.16mi |
| 214 E D St Rayne, LA | 2.0 | 2.0 | 1434 | $1,575 | $1.10 | 14d | 1 | 0.41mi |
Listing history 18 events
-
2026-06-21days on market $50,000 Active 50 DOM
-
2026-06-18days on market $50,000 Active 48 DOM
-
2026-06-17days on market $50,000 Active 47 DOM
-
2026-06-16days on market $50,000 Active 46 DOM
-
2026-06-15days on market $50,000 Active 45 DOM
-
2026-06-13days on market $50,000 Active 43 DOM
-
2026-06-12days on market $50,000 Active 42 DOM
-
2026-06-09days on market $50,000 Active 39 DOM
-
2026-06-08pricedays on market $50,000 Active 38 DOM
-
2026-06-07days on market $65,000 Active 37 DOM
-
2026-06-07days on market $65,000 Active 36 DOM
-
2026-06-04days on market $65,000 Active 33 DOM
-
2026-06-02days on market $65,000 Active 32 DOM
-
2026-06-01days on market $65,000 Active 31 DOM
-
2026-05-31days on market $65,000 Active 30 DOM
-
2026-05-31days on market $65,000 Active 29 DOM
-
2026-05-01price $65,000
-
2026-05-01$50,000 Active
ⓘ Source: listings_history table (triggers on properties + properties_extension) + one-shot
backfill from property_details.listing_events for pre-trigger history.
Climate risk First Street
- Flood 1/10 Low FEMA zone X (unshaded) · 0% chance over 30 yrs
- Wildfire 2/10 Low
- Heat 9/10 Extreme 7 d/yr ≥109°F today · 20 d/yr by 30 yrs out
- Wind 9/10 Extreme 99% chance of damaging wind over 30 yrs
- Air quality 1/10 Low 0 unhealthy d/yr today · 0 by 30 yrs out
Nearby sold comps map
Loading sold comps map…
Walkable amenities ~0.75 mi
Loading nearby amenities…
Taxation est. · year 1
- Rental income
- $13,801
- − Mortgage interest
- −$2,801
- − Property taxes
- −$750
- − Insurance
- −$250
- − Repairs & maintenance
- −$1,104
- − Management
- −$1,104
- − Depreciation
- −$1,455
- Taxable income
- $6,337
- Est. tax owed @ 24.0%
- −$1,521
- After-tax cash flow
- $5,235/yr
For passive investors: Depreciation is non-cash, so a rental often shows a tax loss while cash-flowing — sheltering income. Rental losses are passive: they offset passive income freely, and up to $25,000/yr can offset ordinary (W-2) income if you actively participate and your MAGI is under $100k (phasing out to $0 by $150k); unused losses carry forward. On sale, claimed depreciation is recaptured at up to 25%, and gains may owe capital-gains tax (a 1031 exchange can defer both). Figures are a year-1 estimate at your 24.0% rate — not tax advice; consult a CPA.
Condition & rehab AI · 9 photos
The home requires significant repairs and updates to improve its condition and value. The exterior and foundation show major wear, and the interior needs new flooring, paint, and appliances. A new roof and HVAC system would also greatly enhance its value.
Repairs flagged
- Major Siding — Significant wear and tear
- Major Foundation — Visible wear on the foundation
- Major Roof — No visible damage, but satellite image suggests a flat roof
- Minor Flooring — Worn but not damaged
- Minor Paint — Chipped in some areas
- Major Bathroom Fixtures — Outdated and in need of replacement
- Major Kitchen Appliances — Outdated and in need of replacement
- Major HVAC System — No visible system, but satellite image suggests a condenser unit
Value-add opportunities
- Both New siding and foundation repair — Improves both resale and rental value
- Both New roof inspection and repair — Improves both resale and rental value
- Both New flooring — Improves both resale and rental value
- Both Paint job — Improves both resale and rental value
- Both New bathroom fixtures — Improves both resale and rental value
- Both New kitchen appliances — Improves both resale and rental value
- Both HVAC system replacement — Improves both resale and rental value
Renovation cost estimate screening
| Repair item | Severity | Est. cost |
|---|---|---|
| Siding · Significant wear and tear | Major | $15,000–50,000 |
| Foundation · Visible wear on the foundation | Major | $15,000–50,000 |
| Roof · No visible damage, but satellite image suggests a flat roof | Major | $15,000–50,000 |
| Flooring · Worn but not damaged | Minor | $500–3,000 |
| Paint · Chipped in some areas | Minor | $500–3,000 |
| Bathroom Fixtures · Outdated and in need of replacement | Major | $15,000–50,000 |
| Kitchen Appliances · Outdated and in need of replacement | Major | $15,000–50,000 |
| HVAC System · No visible system, but satellite image suggests a condenser unit | Major | $15,000–50,000 |
| Total estimated repair cost · 8 items | $91,000–306,000 |
Value-add ROI direction
- Both New siding and foundation repair — Improves both resale and rental value ↑
- Both New roof inspection and repair — Improves both resale and rental value ↑
- Both New flooring — Improves both resale and rental value ↑
- Both Paint job — Improves both resale and rental value ↑
- Both New bathroom fixtures — Improves both resale and rental value ↑
- Both New kitchen appliances — Improves both resale and rental value ↑
- Both HVAC system replacement — Improves both resale and rental value ↑
ⓘ Cost ranges are severity-bucket heuristics (US national rule-of-thumb). Get contractor quotes + a written scope before underwriting a rehab budget.
Schools (NCES district)
- District
- Acadia Parish
- NCES district ID
- 2200030
- Math proficiency
- 32% ▼ -39.00%
- Reading proficiency
- 44% ▼ -32.00%
- Median HH income
- $38,012
- Composite
- 31.65/100
- National rank
- #5929
- State rank
- #28 of 98 in LA
Livability — Rayne
- Score
- 75/100
- State rank
- #18
- US rank
- #3895
Category grades
Schools grade is shown separately in the Schools card above.
Census & demographics
- Census place
- Rayne, LA
- City population
- 16,279
- Population (ZIP)
- 16,279
Population outlook (Acadia County) Hauer SSP2
- Today (2025)
- 63,846 people
- By 2030
- 64,141 · +0.5%
- By 2040
- 63,922 · +0.1%
- By 2050
- 62,263 · -2.5%
- By 2075
- 56,507 · -11.5%
- By 2100
- 46,316 · -27.5%
Race, ethnicity, and origin ACS 2023
- Neighborhood character
- Predominantly White (71%)
- Race & ethnicity
- White 71% Black 21% Two or more races 5% Hispanic / Latino 3%
- Common ancestry
- Lithuanian 15%
- Foreign-born
- 0%
- Languages at home
- 91% English-only · French/Haitian/Cajun 8% Spanish 1%
Political lean MEDSL · Acadia
- 2024 margin
- Solid R (+64.0) · D 17.6% · R 81.5%
- 2008→2024 swing
- -18.3pp toward R · 2008: -45.7pp · 2024: -64.0pp
- All cycles
- 2024: R+64.0 2020: R+60.3 2016: R+56.7 2012: R+49.8 2008: R+45.7
Not yet ingested
- Civics
- —
Market trends
- HPI YoY
- ▼ -77.19%
- Current HPI
- 118.9619
- Rent YoY
- —
- Metro
- —
- State GDP YoY
- ▲ 3.29%
- F500 in state
- 10
Industry mix (Fortune 500 HQ in LA)
| Industry | F500 HQs | Revenue |
|---|---|---|
| Telecommunications | 2 | $23B |
|
||
| Utilities | 1 | $12B |
|
||
| Wholesale / Distribution | 1 | $5B |
|
||
| Advertising | 1 | $2B |
|
||
Price history
+30.0% since first listed2 events — show timeline
- 2026-05-01 Price Changed $65,000 AcadianaMLS
- 2026-05-01 Listed $50,000 AcadianaMLS
Cash-flow waterfall
monthlySold comps — $/sqft
last 12 mo · ≤1 miLoading sold comps…