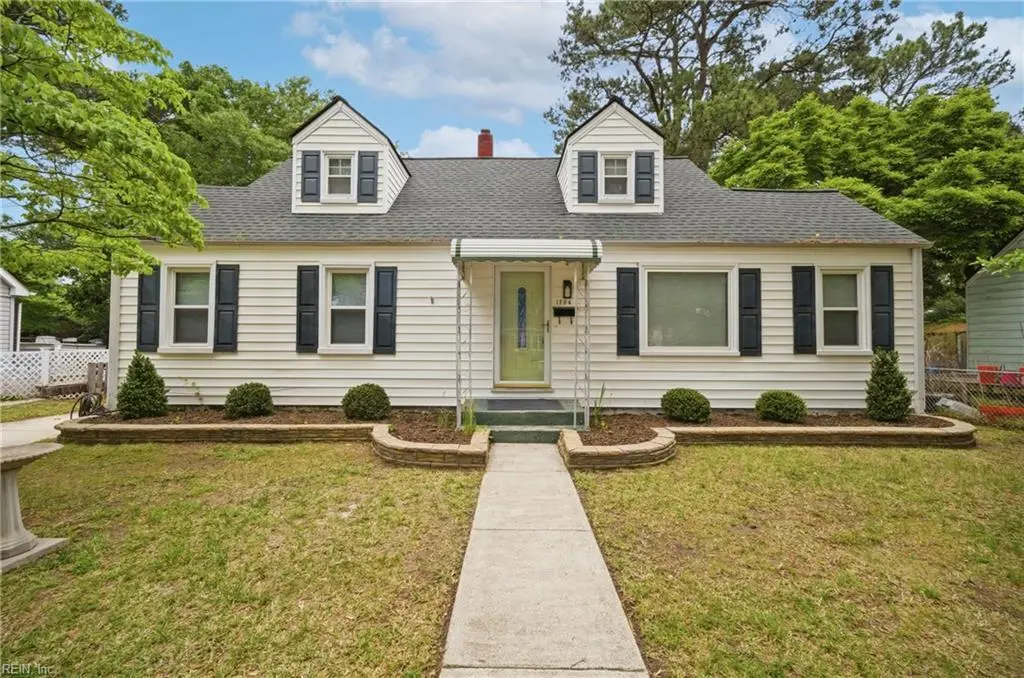
1704 Tarrall Ave · Norfolk, VA
Flood risk 4/10 · Minor
- FEMA flood zone
- X (unshaded)
- Chance of flooding over 30 yrs
- 0.13%
- Est. flood insurance / yr
- $507 – $1,088
Fire risk 1/10 · Minimal
- Est. fire insurance / yr
- $666 – $1,236
Heat risk 9/10 · Severe
- Hot days now (above 105°F)
- 7 days/yr
- Hot days in 30 yrs
- 16 days/yr
Wind risk 8/10 · Major
- Chance of severe wind over 30 yrs
- 80.0%
Air-quality risk 3/10 · Minor
- Unhealthy air days now
- 2 days/yr
- Unhealthy air days in 30 yrs
- 5 days/yr
Risk factors via First Street. Map © Google.
Why this score? — see what drove the D grade
The composite is a weighted blend of 9 inputs, each scored 0–100. Each bar is that input's sub-score; the figure is the points it added to the 100-point composite (weight × sub-score).
- Cash flow +10.0/30.0
- ARV discount +8.6/15.0
- Rent growth +5.0/5.0
- Livability +4.2/5.0
- Schools +3.5/10.0
- Appreciation +2.9/10.0
- DSCR +2.8/10.0
- Condition / age +2.5/5.0
- 1% rule +2.4/10.0
$299,000
🖨 Deal sheet 📄 Offer letter ✓ Due diligence
Listing remarks
This 4-bedroom, 1.5-bath home in the heart of Norfolk! This well-maintained property offers spacious living, a functional layout, and a detached standalone garage for parking, storage, or workshop use. Updated kitchen and bathrooms. New Paint and Carpet. It is located near shopping, dining, bases, and major interstates. A fantastic opportunity for first-time homeowners seeking space, convenience, and value in a central location! Move-in ready!!
Key facts
- Near dining
- Near shopping
- Updated bathrooms
Tags
Property features AI
Finance
- HOA & community: No HOA or association fees
Exterior
- Parking: Detached garage (oversized, 1-car) with approximately 320 sq ft; 2 parking spaces; Driveway parking spaces
- Utilities: City/County water; City/County sewer; Electric water heater; Electric power
- Home design: Detached single-family home; Cape Cod style; 2 stories; Two living levels; Crawl space foundation
- Construction: Asphalt shingle roof
- Exterior features: Vinyl siding; Wood fence enclosing the back yard (full fenced); City view; Attic (walk-in)
Interior
- Kitchen: Electric range; Microwave; Dishwasher; Refrigerator; Garbage disposal
- Bedrooms: First-floor master bedroom; Additional bedroom(s) on first floor
- Flooring: Carpet; Ceramic; Wood
- Bathrooms: One full bathroom; One half bathroom; Full bathroom on first floor
- Heating & cooling: Natural gas heating; Central air conditioning; Window/wall air conditioning
- Interior features: Ceiling fan; Walk-in attic
- Laundry & utility: Washer hookup; Dryer hookup; Utility room; Workshop
Neighborhood map
What this means for you Summary
Snapshot
- This is a 3-bed/1.5-bath single-family listed at $299k.
Deal economics
- At list price, monthly cash flow is $-181 ($-2k/yr) — negative.
- To cash-flow at today's rent, offer at most $267k (10.7% below list).
- To meet the 1% rule (rent ≥ 1% of price), the offer needs to be $223k (25.5% below list).
- Recommended offer: $223k (25.5% below list) — sets the bar for 1% rule.
- Cap rate 5.6% vs local median 4.0% in Norfolk — top-decile yield for the area; either an underpriced asset or a hidden risk that comps aren't pricing in. Stress-test before assuming the spread holds.
Location & tenants
- Location reads 83/100 on livability (#43 in VA, #1,026 nationally) — a professional / high-income tenant draw. Strengths: amenities A+, commute A+, health & safety A+; Watch: employment C-, crime F.
- Norfolk City Public School District (urban): math 27% / reading 56% proficiency, ranked #118 of 131 in VA (top 90%) — families likely to look elsewhere, expect single-tenant / working-renter base with shorter leases.
- Zoned schools: Willard Elementary (math 27% / reading 52%, grade F, #900 of 1,108 statewide, top 83%, 506 students, 98% FRL); Matthew Fontaine Maury High (math 46% / reading 90%, grade B, #180 of 319 statewide, top 57%, 1,697 students, 96% FRL) — zoned schools average 97% FRL vs 59% district-wide (38 pts higher); higher-poverty schools than district average — tighter screening recommended.
- Zoned-school proficiency averages 54% at this address vs 42% district-wide (+12 pts) — the actual schools serving this property are materially stronger than the Norfolk City Public School District average implies; a family-tenant draw the district grade alone would hide.
- Market conditions: Rents rising fast (+14.0%/yr); 77 active listings in the ZIP; 39 comparable units currently listed for rent nearby; rentals at typical pace (median 24d on market — plan ~3-4 weeks tenant-placement turnaround); 41% of comp listings sitting > 30 days — soft ceiling on asking rent; 438 units permitted in Norfolk city in 2024 (273 in 5+ unit buildings).
- This rent runs 37% of the median local income ($73k/yr) — at the standard rent-burdened threshold; future hikes will face affordability resistance.
Forward outlook
- Local home prices are declining (-3.0%/yr); year-one equity from $2k of loan paydown is wiped out by about $9k of value loss. Plan a longer hold.
Negotiation context
- It's been on market 17 days — a 2% lower offer ($295k) is reasonable based on typical stale-listing flexibility.
- 4 sale attempts since 2y ago with the ask held roughly flat each time — persistent listings suggest the price (not the market) is what's stuck; bring a comps-based counter.
- Current owner paid $206k; 45% above their basis — modest negotiation headroom, anchor on the comps not their cost.
Risks & watch-outs
- Watch-outs: built in 1940 — expect roof / HVAC / electrical / plumbing capex.
- Climate carrying-cost: severe wind risk, 80% chance of damaging wind over 30y; extreme-heat days projected 7→16/yr by 2055 (HVAC capex compounding) — expect insurance premiums to compound above CPI over the hold.
Questions for the listing agent
- What do current leases actually rent for vs. the listed asking? Can we see a recent rent roll and the last 12 months of T-12 income?
- Built in 1940 — when were the roof, HVAC, electrical panel, plumbing, and water heater last replaced?
- Is there a deadline driving the sale (1031 exchange, divorce, estate, relocation)? That informs how much negotiation room exists.
- Schools are A-rated — typically a magnet for longer-tenancy family renters. What's the average tenant stay here, and is there a school-zone premium baked into asking?
- Crime grade is F in this area — have there been break-ins, vandalism, or insurance claims at this property in the last 3 years? What carrier currently insures it and at what premium?
- The area grade is low — what's the realistic commute time and amenity access for the typical tenant pool here? Any planned neighborhood developments (good or bad) we should know about?
- What's the average days-on-market for RENTAL listings here right now (not sales)? A rising rental-DOM trend means longer vacancies and softer asking-rent achievability than the comps imply.
- What's the recent tenant-quality profile in this submarket — average credit score on applications, eviction rate, late-payment / NSF rate, and stable-employment percentage? A property-management company in the area should have these aggregated.
- How much new for-sale + rental construction is in the pipeline within 1–3 miles? Heavy new supply typically softens prices + rents 12–24 months out; constrained supply supports both.
Investment metrics
- 1% rule
- 0.74% ✗
- Cap rate
- 5.57%
- Cash-on-cash
- -2.60%
- DSCR
- 0.88
- GRM
- 11.2
CMA / ARV
- ARV (median comp)
- $306,793
- List price
- $299,000
- Delta
- -2.54%
- Verdict
- FAIR
- Comps
- 20 within 1.0 mi
Show comp detail 12 sales within ~0.75 mi
| Address | Dist | Beds/Ba | Sqft | Sold | Price | $/sf | Match |
|---|---|---|---|---|---|---|---|
| 3500 White Chapel Rd | 0.16mi | 3/2.0 | 1,617 (+3%) | 2mo | $280,000 | $173 | 83 |
| 1700 Tarrall Ave | 0.02mi | 4/1.0 (+1) | 1,444 (-8%) | 2mo | $250,000 | $173 | 77 |
| 3503 White Chapel Rd | 0.14mi | 4/2.0 (+1) | 1,696 (+8%) | 1mo | $260,000 | $153 | 72 |
| 2202 Silbert Rd | 0.42mi | 3/2.0 | 1,500 (-4%) | 2mo | $318,000 | $212 | 70 |
| 2504 Cromwell Dr | 0.49mi | 4/2.0 (+1) | 1,589 (+2%) | 1mo | $310,000 | $195 | 67 |
| 5612 Lakewood Dr | 0.54mi | 3/2.0 | 1,514 (-3%) | 2mo | $470,000 | $310 | 66 |
| 2207 Cromwell Dr | 0.35mi | 3/2.0 | 1,727 (+10%) | 1mo | $325,000 | $188 | 64 |
| 3416 Lens Ave | 0.60mi | 3/2.0 | 1,504 (-4%) | 3mo | $165,000 | $110 | 61 |
| 535 Kenosha Ave | 0.71mi | 4/2.0 (+1) | 1,585 (+1%) | 1mo | $215,000 | $136 | 57 |
| 2107 Willow Wood Dr | 0.31mi | 4/1.5 (+1) | 1,363 (-13%) | 3mo | $318,000 | $233 | 56 |
| 3022 Lorraine Ave | 0.73mi | 4/2.0 (+1) | 1,667 (+7%) | 1mo | $425,000 | $255 | 47 |
| 6336 Sangamon Ave | 0.72mi | 4/2.0 (+1) | 1,400 (-10%) | 3mo | $322,000 | $230 | 40 |
Match score weights: distance 35% · size 25% · config 20% · recency 20%. Top-matched comps best support the ARV.
Projected returns pro-forma
-3.0% appreciation · 8.0% rent growth · sell at horizon
- IRR
- -15.5%
- Equity multiple
- 0.42×
- Total profit
- $-48,262
- Equity at exit
- $44,582
- IRR
- -0.5%
- Equity multiple
- 0.96×
- Total profit
- $-3,493
- Equity at exit
- $25,852
Cash invested: $83,720 (down + closing). Projections, not guarantees.
Landlord ↔ Tenant lean methodology
- Overall (STATE)
- 55 Moderately Landlord-Leaning
- State Virginia
- 55 Moderately Landlord-Leaning · D+2
- County
- — inherits STATE
- City
- — inherits STATE
ZIP-level market 23509
- Home prices YoY
- -1.3%
- Rents YoY
- 14.0%
- Active inventory
- 77
- Price-to-rent
- 11.2×
Monthly cashflow live
- Estimated rent
- $2,227 high interval (Pro) →
- Mortgage (P&I)
- −$1,568
- Tax from tax record
- −$248 /mo · $2,974/yr
- Insurance
- −$125
- HOA
- −$0
- Vacancy / Maint / Mgmt
- −$468
- Net cashflow
- $-181
Break-even live
UW: 25.0% down · 7.5% · 30yr · 1.5% tax · 5.0% vac · 8.0% maint · 8.0% mgmt
Financing live
Cash to close
- Down payment
- $74,750
- Closing costs
- $8,970
- Reserves months
- —
- Total cash needed
- —
Loan-product check · same deal, 3 products live
Conventional
25% down · 7.5% · 30yr
- Down + closing
- —
- Monthly P&I
- —
- Monthly cashflow
- —
- DSCR
- —
- Eligible?
- —
Personal DTI + credit; lowest rate.
DSCR
20% down · 8.5% · 30yr
- Down + closing
- —
- Monthly P&I
- —
- Monthly cashflow
- —
- DSCR
- —
- Eligible?
- —
No personal income docs; deal must DSCR.
Hard money
10% down · 12.0% · 12mo
- Down + closing
- —
- Monthly P&I
- —
- Monthly cashflow
- —
- DSCR
- —
- Eligible?
- —
Short-term bridge; refi at stabilization.
Rent comps 39 comps
| Address | Beds | Baths | Sqft | Rent | $/sqft | DOM | Units | Dist |
|---|---|---|---|---|---|---|---|---|
| 3414 Tidewater Dr Norfolk, VA | 4.0 | 2.5 | 2200 | $3,000 | $1.36 | 43d | 1 | 0.26mi |
| 3521 Brest Ave Norfolk, VA | 3.0 | 2.0 | 1234 | $2,300 | $1.86 | 43d | 1 | 0.45mi |
| 3301 Vimy Ridge Ave Norfolk, VA | 4.0 | 2.0 | 1300 | $2,150 | $1.65 | 4d | 1 | 0.46mi |
| 1751 Fontainebleau Cres Norfolk, VA | 3.0 | 2.0 | 1231 | $2,350 | $1.91 | 43d | 1 | 0.48mi |
| 2201 Pershing Ave Norfolk, VA | 3.0 | 2.5 | 1455 | $2,250 | $1.55 | 4d | 1 | 0.52mi |
| 6115 Tidewater Dr Norfolk, VA | 1.0–2.0 | 1.0–2.0 | 956 | $2,274 | $2.38 | 2d | 8 | 0.53mi |
| 1801 Lasalle Ave Norfolk, VA | 3.0 | 1.0 | 1102 | $1,880 | $1.71 | 44d | 1 | 0.53mi |
| 1714 Bellevue Ave Norfolk, VA | 3.0 | 1.5 | 1500 | $1,799 | $1.20 | 43d | 1 | 0.65mi |
| 3801 Chatham Cir Unit 2 Norfolk, VA | 2.0 | 1.0 | 1100 | $1,350 | $1.23 | 7d | 1 | 0.78mi |
| 1801 Saint Denis Ave Unit 3 Norfolk, VA | 4.0 | 2.0 | 1500 | $2,400 | $1.60 | 23d | 1 | 0.79mi |
| 1439 Moultrie Ave #3 Norfolk, VA | 2.0 | 1.0 | 1300 | $1,900 | $1.46 | 7d | 1 | 0.79mi |
| 4010 Holly Ave Unit 2 Norfolk, VA | 3.0 | 1.0 | 1400 | $1,700 | $1.21 | 43d | 1 | 0.80mi |
| 230 E 40th St Norfolk, VA | 2.0 | 2.0 | 1200 | $1,710 | $1.43 | 43d | 1 | 0.90mi |
| 2914 Peronne Ave Norfolk, VA | 4.0 | 2.0 | 1764 | $2,495 | $1.41 | 23d | 1 | 0.92mi |
| 3504 Chesapeake Blvd Norfolk, VA | 3.0 | 2.0 | 1624 | $1,995 | $1.23 | 43d | 1 | 0.94mi |
| 3504 Chesapeake Blvd Norfolk, VA | 3.0 | 2.0 | 1624 | $1,995 | $1.23 | 23d | 1 | 0.94mi |
| 3640 Robin Hood Rd Norfolk, VA | 4.0 | 2.5 | 1400 | $2,999 | $2.14 | 17d | 1 | 1.00mi |
| 2729 Somme Ave Norfolk, VA | 3.0 | 2.5 | 1524 | $2,295 | $1.51 | 14d | 1 | 1.03mi |
| 3653 Nottaway St Norfolk, VA | 3.0 | 1.5 | 1564 | $2,200 | $1.41 | 17d | 1 | 1.04mi |
| 3819 Pamlico Cir Norfolk, VA | 3.0 | 1.0 | 1250 | $2,000 | $1.60 | 12d | 1 | 1.06mi |
| 2815 Keller Ave Norfolk, VA | 3.0 | 2.0 | 1210 | $2,250 | $1.86 | 4d | 1 | 1.10mi |
| 3805 Granby St Unit D Norfolk, VA | 3.0 | 2.5 | 1911 | $2,500 | $1.31 | 23d | 1 | 1.12mi |
| 210 Pennsylvania Ave #1 Norfolk, VA | 2.0 | 1.0 | 1300 | $1,795 | $1.38 | 43d | 1 | 1.14mi |
| 2605 Bapaume Ave Norfolk, VA | 3.0 | 2.0 | 2004 | $2,295 | $1.15 | 43d | 1 | 1.22mi |
| 407 Pennsylvania Ave Norfolk, VA | 4.0 | 2.5 | 2200 | $3,200 | $1.45 | 43d | 1 | 1.24mi |
| 2660 Chesapeake Blvd Norfolk, VA | 3.0 | 2.0 | 1375 | $2,100 | $1.53 | 17d | 1 | 1.27mi |
| 3477 E Bonner Dr Norfolk, VA | 3.0 | 1.0 | 1304 | $2,000 | $1.53 | 23d | 1 | 1.29mi |
| 2529 Tidewater Dr Norfolk, VA | 3.0 | 2.5 | 2025 | $2,370 | $1.17 | 23d | 1 | 1.31mi |
| 305 W 36th St Norfolk, VA | 2.0 | 1.0 | 1271 | $1,495 | $1.18 | 4d | 1 | 1.33mi |
| 837 Tifton St Norfolk, VA | 3.0 | 2.0 | 1072 | $2,300 | $2.15 | 23d | 1 | 1.42mi |
| 527 Maryland Ave Norfolk, VA | 3.0 | 1.0 | 1200 | $2,000 | $1.67 | 43d | 1 | 1.43mi |
| 881 Rugby St Norfolk, VA | 3.0 | 2.0 | 1600 | $2,650 | $1.66 | 23d | 1 | 1.43mi |
| 907 Rugby St Norfolk, VA | 3.0 | 2.0 | 1515 | $2,200 | $1.45 | 43d | 1 | 1.44mi |
| 4511 Newport Ave Unit 4511 -A Norfolk, VA | 4.0 | 3.0 | 2068 | $2,600 | $1.26 | 43d | 1 | 1.44mi |
| 2531 Vincent Ave Norfolk, VA | 3.0 | 2.0 | 1600 | $2,195 | $1.37 | 43d | 1 | 1.45mi |
| 4563 Shoshone Ct Norfolk, VA | 3.0 | 2.0 | 1600 | $2,500 | $1.56 | 43d | 1 | 1.49mi |
| 325 W 31st St Unit 6 Norfolk, VA | 3.0 | 1.0 | 1400 | $1,750 | $1.25 | 23d | 1 | 1.49mi |
| 4804 Gosnold Ave Norfolk, VA | 2.0 | 1.0 | 1100 | $1,330 | $1.21 | 19d | 1 | 1.50mi |
| 4804 Gosnold Ave Unit 2 Norfolk, VA | 2.0 | 1.0 | 1100 | $1,330 | $1.21 | 21d | 1 | 1.50mi |
Listing history 11 events
-
2026-06-02status $299,000 Under Contract 17 DOM
-
2026-06-01days on market $299,000 Active Under Contract 17 DOM
-
2026-05-31days on market $299,000 Active Under Contract 16 DOM
-
2026-05-14$299,000 Active 448-char remark
-
2026-03-23soldstatus $206,000
-
2026-03-20soldstatus $206,000
-
2026-03-18$206,000
-
2025-02-14historical
-
2024-12-23$230,000 Active
-
2010-01-28soldstatus $151,900
-
1957-04-08soldstatus $11,500
ⓘ Source: listings_history table (triggers on properties + properties_extension) + one-shot
backfill from property_details.listing_events for pre-trigger history.
Tax reassessment forecast VA · Resets to sale price
- Current annual tax
- $2,974 · $248/mo
- Projected year-2 tax
- $2,974 · $248/mo
- Expected delta
- $0/yr ($0/mo · 0.0%)
ⓘ Screening estimate from a state-policy table — verify with the county assessor before closing.
Climate risk First Street
- Flood 4/10 Moderate FEMA zone X (unshaded) · 13% chance over 30 yrs
- Wildfire 1/10 Low
- Heat 9/10 Extreme 7 d/yr ≥105°F today · 16 d/yr by 30 yrs out
- Wind 8/10 Severe 80% chance of damaging wind over 30 yrs
- Air quality 3/10 Moderate 2 unhealthy d/yr today · 5 by 30 yrs out
Nearby sold comps map
Loading sold comps map…
Walkable amenities ~0.75 mi
Loading nearby amenities…
Taxation est. · year 1
- Rental income
- $26,723
- − Mortgage interest
- −$16,749
- − Property taxes
- −$2,974
- − Insurance
- −$1,495
- − Repairs & maintenance
- −$2,138
- − Management
- −$2,138
- − Depreciation
- −$8,698
- Taxable loss
- −$7,468
- Est. tax savings @ 24.0%
- +$1,792
- After-tax cash flow
- $-381/yr
For passive investors: Depreciation is non-cash, so a rental often shows a tax loss while cash-flowing — sheltering income. Rental losses are passive: they offset passive income freely, and up to $25,000/yr can offset ordinary (W-2) income if you actively participate and your MAGI is under $100k (phasing out to $0 by $150k); unused losses carry forward. On sale, claimed depreciation is recaptured at up to 25%, and gains may owe capital-gains tax (a 1031 exchange can defer both). Figures are a year-1 estimate at your 24.0% rate — not tax advice; consult a CPA.
Schools (NCES district)
- District
- Norfolk City Public School District
- NCES district ID
- 5102670
- Math proficiency
- 27% ▼ -44.00%
- Reading proficiency
- 56% ▼ -10.00%
- Median HH income
- $44,358
- Composite
- 35.08/100
- National rank
- #5026
- State rank
- #118 of 131 in VA
Livability — Norfolk
- Score
- 83/100
- State rank
- #43
- US rank
- #1026
Category grades
Schools grade is shown separately in the Schools card above.
Census & demographics
- Census place
- Norfolk, VA
- County
- Norfolk City · 214,042 people
- City population
- 214,042
- Metro
- Virginia Beach-Norfolk-Newport News, VA-NC
- Population (ZIP)
- 13,105
- Household income
- $72,816
- Rent vs Own
- Severe rent burden
- 575.0
Population outlook (Norfolk County) Hauer SSP2
- Today (2025)
- 249,032 people
- By 2030
- 252,347 · +1.3%
- By 2040
- 253,644 · +1.9%
- By 2050
- 251,913 · +1.2%
- By 2075
- 245,281 · -1.5%
- By 2100
- 219,548 · -11.8%
Race, ethnicity, and origin ACS 2023
- Neighborhood character
- Diverse neighborhood (Simpson 0.64)
- Race & ethnicity
- White 44% Black 39% Hispanic / Latino 9% Two or more races 8% Asian 2%
- Hispanic origin (detail)
- Mexican 2% Puerto Rican 2%
- Common ancestry
- Italian 4% Serbian 2% Romanian 1%
- Foreign-born
- 6% · Canada, China
- Languages at home
- 91% English-only · Spanish 5% Other Asian/Pacific 1%
Political lean MEDSL · Norfolk
- 2024 margin
- Solid D (+41.5) · D 70.0% · R 28.5% · Other 1.6%
- 2008→2024 swing
- -1.4pp toward R · 2008: 43.0pp · 2024: 41.5pp
- All cycles
- 2024: D+41.5 2020: D+45.6 2016: D+42.0 2012: D+44.0 2008: D+43.0
Not yet ingested
- Civics
- —
Market trends
- HPI YoY
- ▼ -4.16%
- Current HPI
- 321.56
- Rent YoY
- ▲ 13.99%
- Metro
- Virginia Beach-Norfolk-Newport News, VA-NC
- State GDP YoY
- ▲ 2.40%
- F500 in state
- 50
Industry mix (Fortune 500 HQ in VA)
| Industry | F500 HQs | Revenue |
|---|---|---|
| Aerospace / Defense | 4 | $236B |
|
||
| Technology / Defense | 3 | $32B |
|
||
| Financial Services | 2 | $176B |
|
||
| Utilities | 2 | $27B |
|
||
| Insurance | 2 | $25B |
|
||
| Technology | 2 | $15B |
|
||
Price history
+2500.0% since first listed12 events — show timeline
- 2026-06-01 Pending — REINMLS
- 2026-05-22 Contingent — REINMLS
- 2026-05-21 Relisted — REINMLS
- 2026-05-19 Contingent — REINMLS
- 2026-05-14 Listed $299,000 REINMLS
- 2026-03-23 Sold (Public Records) $206,000 Public Records
- 2026-03-20 Sold (MLS) $206,000 REINMLS
- 2026-03-18 Listed $206,000 REINMLS
- 2025-02-14 Listing Removed — REINMLS
- 2024-12-23 Listed $230,000 REINMLS
- 2010-01-28 Sold (Public Records) $151,900 Public Records
- 1957-04-08 Sold (Public Records) $11,500 Public Records
Property tax history
+3.5%/yrLatest (2025): $2,974 · +2.4% YoY. Source: county tax records.
Cash-flow waterfall
monthlySold comps — $/sqft
last 12 mo · ≤1 miLoading sold comps…