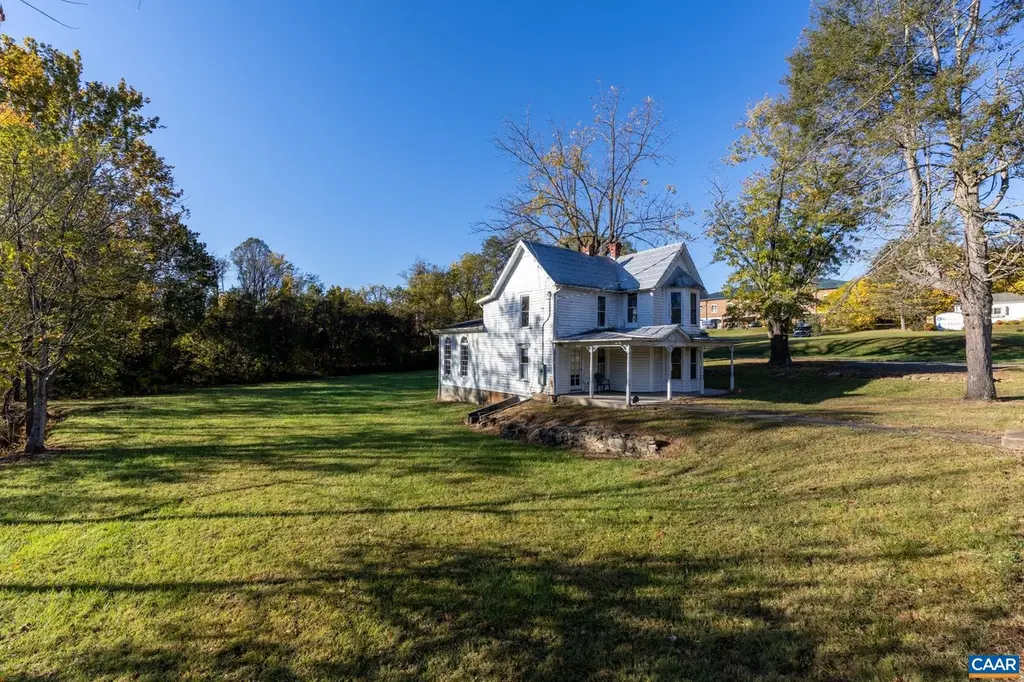
276 Main St · Stanardsville, VA
Flood risk 9/10 · Severe
- FEMA flood zone
- X (unshaded)
- Chance of flooding over 30 yrs
- 0.99%
- Est. flood insurance / yr
- $507 – $1,088
Fire risk 5/10 · Moderate
- Est. fire insurance / yr
- $666 – $1,236
Heat risk 6/10 · Moderate
- Hot days now (above 103°F)
- 7 days/yr
- Hot days in 30 yrs
- 17 days/yr
Wind risk 2/10 · Minimal
- Chance of severe wind over 30 yrs
- 3.0%
Air-quality risk 1/10 · Minimal
- Unhealthy air days now
- 0 days/yr
- Unhealthy air days in 30 yrs
- 0 days/yr
Risk factors via First Street. Map © Google.
Why this score? — see what drove the C+ grade
The composite is a weighted blend of 9 inputs, each scored 0–100. Each bar is that input's sub-score; the figure is the points it added to the 100-point composite (weight × sub-score).
- Cash flow +23.6/30.0
- ARV discount +15.0/15.0
- DSCR +7.6/10.0
- 1% rule +5.1/10.0
- Schools +4.5/10.0
- Livability +3.5/5.0
- Rent growth +2.5/5.0
- Condition / age +2.5/5.0
- Appreciation +0.0/10.0
$267,000
🖨 Deal sheet 📄 Offer letter ✓ Due diligence
Listing remarks MLS
Historic Main Street Opportunity in Stanardsville! This iconic Main Street property is a true piece of Stanardsville history, nestled at the heart of Town Hill. Zoned Residential/Commercial, it offers limitless potential—whether you envision a home, a business, a restaurant, a tap house, or a brewery, the possibilities are endless. The structure boasts solid bones and some mechanical upgrades, ready for your vision to bring it into the next chapter of Stanardsville’s story.
Key facts
- Mechanical upgrades
- 0.94 acre lot
- Built 1900
Tags
Neighborhood map
What this means for you Summary
Snapshot
- This is a 3-bed/1.0-bath single-family listed at $267k.
Deal economics
- At list price, monthly cash flow is $438 ($5k/yr) — positive.
- The deal already cash-flows at list — no discount required.
- Meets the 1% rule at list price ($3k rent vs $267k).
- Recommended offer: $235k (12.0% below list) — sets the bar for market timing.
- Cap rate 8.6% vs local median 4.8% in Stanardsville — top-decile yield for the area; either an underpriced asset or a hidden risk that comps aren't pricing in. Stress-test before assuming the spread holds.
Location & tenants
- Location reads 69/100 on livability (#243 in VA) — a middle-class / working-renter tenant base. Strengths: health & safety A+, schools A-, cost of living A-; Watch: employment D+, amenities F, commute F.
- Greene County Public School District (town): math 40% / reading 64% proficiency, ranked #88 of 131 in VA (top 67%) — acceptable for families but not a draw, mixed tenant base, ~2y average lease.
- Market conditions: 83 active listings in the ZIP; 1 comparable units currently listed for rent nearby; 204 units permitted in Greene County in 2024 (34 in 5+ unit buildings).
Forward outlook
- Local home prices are declining (-3.0%/yr); year-one equity from $2k of loan paydown is wiped out by about $8k of value loss. Plan a longer hold.
- Greene County population projected at +6% by 2050 — modest demand growth; plan on rents tracking national, not racing it.
Negotiation context
- It's been on market 181 days — a 12% lower offer ($235k) is reasonable based on typical stale-listing flexibility.
Risks & watch-outs
- Watch-outs: flood insurance adds $66/mo; built in 1900 — expect roof / HVAC / electrical / plumbing capex.
- Climate carrying-cost: severe flood risk; moderate wildfire risk; extreme-heat days projected 7→17/yr by 2055 (HVAC capex compounding) — expect insurance premiums to compound above CPI over the hold.
Questions for the listing agent
- It's been on market 181 days. Have you received any prior offers? Is the seller open to a 12% concession, seller financing, or rate buy-down credit?
- Built in 1900 — when were the roof, HVAC, electrical panel, plumbing, and water heater last replaced?
- What's the actual annual flood-insurance premium (NFIP or private), and is the property in a SFHA with mandatory coverage?
- Why hasn't it sold? Are there any deal-killer items the seller is aware of (foundation, flood, title, zoning, code violations)?
- Is there a deadline driving the sale (1031 exchange, divorce, estate, relocation)? That informs how much negotiation room exists.
- Schools are A-rated — typically a magnet for longer-tenancy family renters. What's the average tenant stay here, and is there a school-zone premium baked into asking?
- What's the average days-on-market for RENTAL listings here right now (not sales)? A rising rental-DOM trend means longer vacancies and softer asking-rent achievability than the comps imply.
- What's the recent tenant-quality profile in this submarket — average credit score on applications, eviction rate, late-payment / NSF rate, and stable-employment percentage? A property-management company in the area should have these aggregated.
- How much new for-sale + rental construction is in the pipeline within 1–3 miles? Heavy new supply typically softens prices + rents 12–24 months out; constrained supply supports both.
Investment metrics
- 1% rule
- 1.01% ✓
- Cap rate
- 8.56%
- Cash-on-cash
- 8.09%
- DSCR
- 1.36
- GRM
- 8.3
CMA / ARV
- ARV (median comp)
- $355,285
- List price
- $267,000
- Delta
- -24.85%
- Verdict
- UNDERPRICED
- Comps
- 20 within 1.0 mi
Projected returns pro-forma
-3.0% appreciation · 3.0% rent growth · sell at horizon
- IRR
- -5.5%
- Equity multiple
- 0.79×
- Total profit
- $-15,434
- Equity at exit
- $39,811
- IRR
- 4.1%
- Equity multiple
- 1.30×
- Total profit
- $22,249
- Equity at exit
- $23,085
Cash invested: $74,760 (down + closing). Projections, not guarantees.
Landlord ↔ Tenant lean methodology
- Overall (STATE)
- 55 Moderately Landlord-Leaning
- State Virginia
- 55 Moderately Landlord-Leaning · D+2
- County
- — inherits STATE
- City
- — inherits STATE
ZIP-level market 22973
- Home prices YoY
- -25.3%
- Active inventory
- 83
- Price-to-rent
- 8.3×
Monthly cashflow live
- Estimated rent
- $2,695 medium interval (Pro) →
- Mortgage (P&I)
- −$1,400
- Tax from tax record
- −$113 /mo · $1,360/yr
- Insurance
- −$111
- Flood insurance flood zone
- −$66 /mo · $798/yr
- HOA
- −$0
- Vacancy / Maint / Mgmt
- −$566
- Net cashflow
- $438
Break-even live
UW: 25.0% down · 7.5% · 30yr · 1.5% tax · 5.0% vac · 8.0% maint · 8.0% mgmt
Financing live
Cash to close
- Down payment
- $66,750
- Closing costs
- $8,010
- Reserves months
- —
- Total cash needed
- —
Loan-product check · same deal, 3 products live
Conventional
25% down · 7.5% · 30yr
- Down + closing
- —
- Monthly P&I
- —
- Monthly cashflow
- —
- DSCR
- —
- Eligible?
- —
Personal DTI + credit; lowest rate.
DSCR
20% down · 8.5% · 30yr
- Down + closing
- —
- Monthly P&I
- —
- Monthly cashflow
- —
- DSCR
- —
- Eligible?
- —
No personal income docs; deal must DSCR.
Hard money
10% down · 12.0% · 12mo
- Down + closing
- —
- Monthly P&I
- —
- Monthly cashflow
- —
- DSCR
- —
- Eligible?
- —
Short-term bridge; refi at stabilization.
Rent comps 1 comps
| Address | Beds | Baths | Sqft | Rent | $/sqft | DOM | Units | Dist |
|---|---|---|---|---|---|---|---|---|
| 477 Westwood Rd Stanardsville, VA | 2.0 | 2.0 | 1450 | $2,695 | $1.86 | 5d | 1 | 1.47mi |
Listing history 1 events
-
2025-11-24$267,000 Active 490-char remark
Show marketing remark (490 chars)
Historic Main Street Opportunity in Stanardsville! This iconic Main Street property is a true piece of Stanardsville history, nestled at the heart of Town Hill. Zoned Residential/Commercial, it offers limitless potential—whether you envision a home, a business, a restaurant, a tap house, or a brewery, the possibilities are endless. The structure boasts solid bones and some mechanical upgrades, ready for your vision to bring it into the next chapter of Stanardsville’s story.
ⓘ Source: listings_history table (triggers on properties + properties_extension) + one-shot
backfill from property_details.listing_events for pre-trigger history.
Tax reassessment forecast VA · Resets to sale price
- Current annual tax
- $1,360 · $113/mo
- Projected year-2 tax
- $2,189 · $182/mo
- Expected delta
- +$829/yr (+$69/mo · 61.0%)
ⓘ Screening estimate from a state-policy table — verify with the county assessor before closing.
Climate risk First Street
- Flood 9/10 Extreme FEMA zone X (unshaded) · 99% chance over 30 yrs
- Wildfire 5/10 Major
- Heat 6/10 Major 7 d/yr ≥103°F today · 17 d/yr by 30 yrs out
- Wind 2/10 Low 3% chance of damaging wind over 30 yrs
- Air quality 1/10 Low 0 unhealthy d/yr today · 0 by 30 yrs out
Nearby sold comps map
Loading sold comps map…
Walkable amenities ~0.75 mi
Loading nearby amenities…
Taxation est. · year 1
- Rental income
- $32,340
- − Mortgage interest
- −$14,956
- − Property taxes
- −$1,360
- − Insurance
- −$2,132
- − Repairs & maintenance
- −$2,587
- − Management
- −$2,587
- − Depreciation
- −$7,767
- Taxable income
- $950
- Est. tax owed @ 24.0%
- −$228
- After-tax cash flow
- $5,026/yr
For passive investors: Depreciation is non-cash, so a rental often shows a tax loss while cash-flowing — sheltering income. Rental losses are passive: they offset passive income freely, and up to $25,000/yr can offset ordinary (W-2) income if you actively participate and your MAGI is under $100k (phasing out to $0 by $150k); unused losses carry forward. On sale, claimed depreciation is recaptured at up to 25%, and gains may owe capital-gains tax (a 1031 exchange can defer both). Figures are a year-1 estimate at your 24.0% rate — not tax advice; consult a CPA.
Schools (NCES district)
- District
- Greene County Public School District
- NCES district ID
- 5101710
- Math proficiency
- 40% ▼ -37.00%
- Reading proficiency
- 64% ▼ -7.00%
- Median HH income
- $59,129
- Composite
- 45.22/100
- National rank
- #2668
- State rank
- #88 of 131 in VA
Livability — Stanardsville
- Score
- 69/100
- State rank
- #243
- US rank
- #8223
Category grades
Schools grade is shown separately in the Schools card above.
Census & demographics
- Census place
- Stanardsville, VA
- Population (ZIP)
- 5,980
Population outlook (Greene County) Hauer SSP2
- Today (2025)
- 20,465 people
- By 2030
- 20,958 · +2.4%
- By 2040
- 21,619 · +5.6%
- By 2050
- 21,699 · +6.0%
- By 2075
- 21,656 · +5.8%
- By 2100
- 20,156 · -1.5%
Race, ethnicity, and origin ACS 2023
- Neighborhood character
- Predominantly White (82%)
- Race & ethnicity
- White 82% Two or more races 9% Black 6% Hispanic / Latino 4% Asian 2%
- Common ancestry
- Italian 3% Romanian 2% Serbian 2%
- Foreign-born
- 3% · Canada, China
- Languages at home
- 96% English-only · Spanish 2% German/W. Germanic 1%
Political lean MEDSL · Greene
- 2024 margin
- Strong R (+24.7) · D 37.0% · R 61.7% · Other 1.2%
- 2008→2024 swing
- -2.9pp toward R · 2008: -21.9pp · 2024: -24.7pp
- All cycles
- 2024: R+24.7 2020: R+23.9 2016: R+31.8 2012: R+25.3 2008: R+21.9
Not yet ingested
- Civics
- —
Market trends
- HPI YoY
- ▼ -61.51%
- Current HPI
- 181.8265
- Rent YoY
- —
- Metro
- —
- State GDP YoY
- ▲ 2.40%
- F500 in state
- 50
Industry mix (Fortune 500 HQ in VA)
| Industry | F500 HQs | Revenue |
|---|---|---|
| Aerospace / Defense | 4 | $236B |
|
||
| Technology / Defense | 3 | $32B |
|
||
| Financial Services | 2 | $176B |
|
||
| Utilities | 2 | $27B |
|
||
| Insurance | 2 | $25B |
|
||
| Technology | 2 | $15B |
|
||
Price history
1 event — show timeline
- 2025-11-24 Listed $267,000 CAAR
Property tax history
+2.7%/yrLatest (2025): $1,360 · -7.7% YoY. Source: county tax records.
Cash-flow waterfall
monthlySold comps — $/sqft
last 12 mo · ≤1 miLoading sold comps…