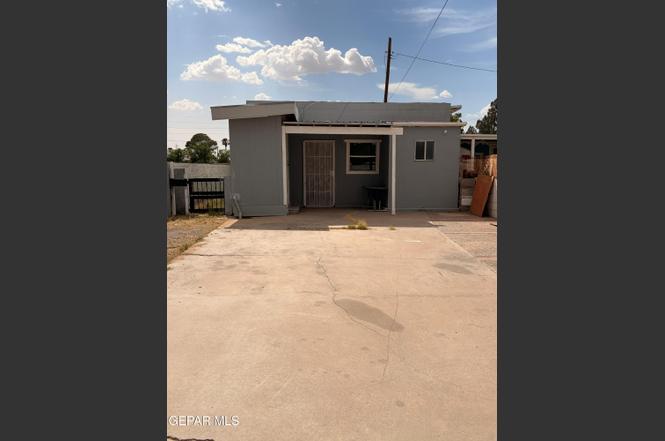
155 S Harris St · El Paso, TX
Flood risk 5/10 · Moderate
- FEMA flood zone
- X (unshaded)
- Chance of flooding over 30 yrs
- 0.24%
- Est. flood insurance / yr
- $507 – $1,088
Fire risk 1/10 · Minimal
- Est. fire insurance / yr
- $1,222 – $2,270
Heat risk 6/10 · Moderate
- Hot days now (above 102°F)
- 7 days/yr
- Hot days in 30 yrs
- 25 days/yr
Wind risk 1/10 · Minimal
- Chance of severe wind over 30 yrs
- —
Air-quality risk 3/10 · Minor
- Unhealthy air days now
- 2 days/yr
- Unhealthy air days in 30 yrs
- 3 days/yr
Risk factors via First Street. Map © Google.
Why this score? — see what drove the B- grade
The composite is a weighted blend of 9 inputs, each scored 0–100. Each bar is that input's sub-score; the figure is the points it added to the 100-point composite (weight × sub-score).
- Cash flow +27.1/30.0
- DSCR +9.4/10.0
- 1% rule +8.9/10.0
- ARV discount +7.5/15.0
- Rent growth +5.0/5.0
- Livability +4.0/5.0
- Schools +2.6/10.0
- Condition / age +2.5/5.0
- Appreciation +0.0/10.0
$78,000
🖨 Deal sheet 📄 Offer letter ✓ Due diligence
Listing remarks
Investor special! This 2 bedroom, 2 full bath home offers approximately 900 sqft of living space. Conveniently located in the heart of Ysleta and within walking distance to the popular Speaking Rock Casino and the Ysleta International Bridge. Don't miss this affordable opportunity in a high-demand area with strong rental potential. Schedule your showing today!
Key facts
- 2,562 sq ft lot
- Garage
- Built 1942
Property features AI
Finance
- Other: Lot size approximately 0.06 acres
- Financial info: Fixer upper condition
- HOA & community: No HOA fees included
Exterior
- Parking: No parking
- Utilities: No utility details provided
- Home design: Single family residence
- Construction: Block construction; Building area approximately 875 total
- Exterior features: See remarks for exterior details; Front yard fencing
Interior
- Kitchen: See remarks for appliances and kitchen details
- Bedrooms: No bedroom count provided
- Flooring: See remarks for flooring
- Bathrooms: 2 full bathrooms
- Heating & cooling: Heating: see remarks; Has cooling
- Interior features: See remarks for interior details
- Laundry & utility: No laundry or utility details provided
Neighborhood map
What this means for you Summary
Snapshot
- This is a 2-bed/1.0-bath single-family listed at $78k.
Deal economics
- At list price, monthly cash flow is $220 ($3k/yr) — positive.
- The deal already cash-flows at list — no discount required.
- Meets the 1% rule at list price ($1k rent vs $78k).
Location & tenants
- Location reads 81/100 on livability (#23 in TX, #1,375 nationally) — a professional / high-income tenant draw. Strengths: commute A+, cost of living A+, housing A+; Watch: employment D+.
- Ysleta ISD (urban): math 27% / reading 35% proficiency, ranked #626 of 826 in TX (top 76%) — families likely to look elsewhere, expect single-tenant / working-renter base with shorter leases; 68% free/reduced lunch — lower-income household profile, screen leases tightly.
- Zoned schools: Ysleta El (math 25% / reading 30%, grade F, #2,768 of 4,322 statewide, top 65%, 355 students, 91% FRL); Ysleta Middle (math 14% / reading 16%, grade F, #1,569 of 1,662 statewide, top 95%, 779 students, 90% FRL); Ysleta H S (math 43% / reading 37%, grade F, #809 of 1,632 statewide, top 50%, 1,342 students, 90% FRL) — zoned schools average 90% FRL vs 68% district-wide (22 pts higher); higher-poverty schools than district average — tighter screening recommended.
- Market conditions: Rents rising fast (+11.8%/yr); 103 active listings in the ZIP; 11 comparable units currently listed for rent nearby; rentals at typical pace (median 24d on market — plan ~3-4 weeks tenant-placement turnaround); 45% of comp listings sitting > 30 days — soft ceiling on asking rent; lower-income renter base — watch delinquency; 2,196 units permitted in El Paso County in 2024 (143 in 5+ unit buildings).
- This rent runs 31% of the median local income ($42k/yr) — at the standard rent-burdened threshold; future hikes will face affordability resistance.
Forward outlook
- Local home prices are declining (-3.0%/yr); year-one equity from $539 of loan paydown is wiped out by about $2k of value loss. Plan a longer hold.
- El Paso County population projected at +10% by 2050 — modest demand growth; plan on rents tracking national, not racing it.
- At projected returns (-3.0% appreciation + 8.0% rent growth), your $22k cash investment doubles in ~7 years — after that, you're playing with house money.
Negotiation context
- Only 1 days on market — expect competitive offers; lowballing is unlikely to land.
- 2 sale attempts with the ask held roughly flat each time — persistent listings suggest the price (not the market) is what's stuck; bring a comps-based counter.
Risks & watch-outs
- Watch-outs: property tax is 3.0% of price; built in 1942 — expect roof / HVAC / electrical / plumbing capex.
- Climate carrying-cost: moderate flood risk; extreme-heat days projected 7→25/yr by 2055 (HVAC capex compounding) — expect insurance premiums to compound above CPI over the hold.
Questions for the listing agent
- Built in 1942 — when were the roof, HVAC, electrical panel, plumbing, and water heater last replaced?
- Property tax is high relative to price — has the assessment been appealed recently, and will the sale trigger a re-assessment?
- Is there a deadline driving the sale (1031 exchange, divorce, estate, relocation)? That informs how much negotiation room exists.
- Schools are B-rated — typically a magnet for longer-tenancy family renters. What's the average tenant stay here, and is there a school-zone premium baked into asking?
- What's the average days-on-market for RENTAL listings here right now (not sales)? A rising rental-DOM trend means longer vacancies and softer asking-rent achievability than the comps imply.
- What's the recent tenant-quality profile in this submarket — average credit score on applications, eviction rate, late-payment / NSF rate, and stable-employment percentage? A property-management company in the area should have these aggregated.
- How much new for-sale + rental construction is in the pipeline within 1–3 miles? Heavy new supply typically softens prices + rents 12–24 months out; constrained supply supports both.
Investment metrics
- 1% rule
- 1.39% ✓
- Cap rate
- 9.67%
- Cash-on-cash
- 12.07%
- DSCR
- 1.54
- GRM
- 6.0
CMA / ARV
No comps found within radius.
Projected returns pro-forma
-3.0% appreciation · 8.0% rent growth · sell at horizon
- IRR
- 7.9%
- Equity multiple
- 1.33×
- Total profit
- $7,173
- Equity at exit
- $11,630
- IRR
- 21.5%
- Equity multiple
- 3.32×
- Total profit
- $50,724
- Equity at exit
- $6,744
Cash invested: $21,840 (down + closing). Projections, not guarantees.
Landlord ↔ Tenant lean methodology
- Overall (STATE)
- 87 Strongly Landlord-Friendly
- State Texas
- 87 Strongly Landlord-Friendly · R+5
- County
- — inherits STATE
- City
- — inherits STATE
ZIP-level market 79907
- Home prices YoY
- -9.8%
- Rents YoY
- 11.8%
- Active inventory
- 103
- Price-to-rent
- 6.0×
Monthly cashflow live
- Estimated rent
- $1,087 high interval (Pro) →
- Mortgage (P&I)
- −$409
- Tax from tax record
- −$198 /mo · $2,371/yr
- Insurance
- −$32
- HOA
- −$0
- Vacancy / Maint / Mgmt
- −$228
- Net cashflow
- $220
Break-even live
UW: 25.0% down · 7.5% · 30yr · 1.5% tax · 5.0% vac · 8.0% maint · 8.0% mgmt
Financing live
Cash to close
- Down payment
- $19,500
- Closing costs
- $2,340
- Reserves months
- —
- Total cash needed
- —
Loan-product check · same deal, 3 products live
Conventional
25% down · 7.5% · 30yr
- Down + closing
- —
- Monthly P&I
- —
- Monthly cashflow
- —
- DSCR
- —
- Eligible?
- —
Personal DTI + credit; lowest rate.
DSCR
20% down · 8.5% · 30yr
- Down + closing
- —
- Monthly P&I
- —
- Monthly cashflow
- —
- DSCR
- —
- Eligible?
- —
No personal income docs; deal must DSCR.
Hard money
10% down · 12.0% · 12mo
- Down + closing
- —
- Monthly P&I
- —
- Monthly cashflow
- —
- DSCR
- —
- Eligible?
- —
Short-term bridge; refi at stabilization.
Rent comps 11 comps
| Address | Beds | Baths | Sqft | Rent | $/sqft | DOM | Units | Dist |
|---|---|---|---|---|---|---|---|---|
| 9207 Santa Rosalia Ct Unit A El Paso, TX | 2.0 | 1.0 | 1000 | $1,200 | $1.20 | 21d | 1 | 0.52mi |
| 9228 San Lorenzo Ave Unit B El Paso, TX | 2.0 | 1.0 | 980 | $1,200 | $1.22 | 14d | 1 | 0.67mi |
| 8715 Independence Dr Unit 7 El Paso, TX | 3.0 | 2.0 | 972 | $1,050 | $1.08 | 24d | 1 | 0.74mi |
| 8715 Independence Dr Unit 05 El Paso, TX | 2.0 | 1.0 | 600 | $800 | $1.33 | 44d | 1 | 0.74mi |
| 8506 Winchester Rd El Paso, TX | 2.0 | 1.0 | 980 | $825 | $0.84 | 44d | 1 | 1.14mi |
| 8507 Alameda Ave Unit 3 El Paso, TX | 2.0 | 1.0 | 729 | $800 | $1.10 | 44d | 1 | 1.22mi |
| 8507 Alameda Ave Unit 8 El Paso, TX | 1.0 | 1.0 | 680 | $700 | $1.03 | 12d | 1 | 1.26mi |
| 8685 N Loop Dr Unit B-4 El Paso, TX | 2.0 | 1.0 | 910 | $945 | $1.04 | 24d | 1 | 1.34mi |
| 8685 N Loop Dr Unit H-2 El Paso, TX | 2.0 | 1.0 | 910 | $995 | $1.09 | 44d | 1 | 1.34mi |
| 9101 Tenango Dr El Paso, TX | 3.0 | 2.0 | 1000 | $1,500 | $1.50 | 44d | 1 | 1.38mi |
| 9010 Betel Dr El Paso, TX | 2.0 | 1.0 | 822 | $1,225 | $1.49 | 3d | 4 | 1.43mi |
Listing history 2 events
-
2026-06-18remarks 363-char remark
-
2026-06-18$78,000 Pending 1 DOM
ⓘ Source: listings_history table (triggers on properties + properties_extension) + one-shot
backfill from property_details.listing_events for pre-trigger history.
Tax reassessment forecast TX · Resets to sale price
- Current annual tax
- $2,371 · $198/mo
- Projected year-2 tax
- $2,371 · $198/mo
- Expected delta
- $0/yr ($0/mo · 0.0%)
ⓘ Screening estimate from a state-policy table — verify with the county assessor before closing.
Climate risk First Street
- Flood 5/10 Major FEMA zone X (unshaded) · 24% chance over 30 yrs
- Wildfire 1/10 Low
- Heat 6/10 Major 7 d/yr ≥102°F today · 25 d/yr by 30 yrs out
- Wind 1/10 Low
- Air quality 3/10 Moderate 2 unhealthy d/yr today · 3 by 30 yrs out
Nearby sold comps map
Loading sold comps map…
Walkable amenities ~0.75 mi
Loading nearby amenities…
Taxation est. · year 1
- Rental income
- $13,045
- − Mortgage interest
- −$4,369
- − Property taxes
- −$2,371
- − Insurance
- −$390
- − Repairs & maintenance
- −$1,044
- − Management
- −$1,044
- − Depreciation
- −$2,269
- Taxable income
- $1,558
- Est. tax owed @ 24.0%
- −$374
- After-tax cash flow
- $2,262/yr
For passive investors: Depreciation is non-cash, so a rental often shows a tax loss while cash-flowing — sheltering income. Rental losses are passive: they offset passive income freely, and up to $25,000/yr can offset ordinary (W-2) income if you actively participate and your MAGI is under $100k (phasing out to $0 by $150k); unused losses carry forward. On sale, claimed depreciation is recaptured at up to 25%, and gains may owe capital-gains tax (a 1031 exchange can defer both). Figures are a year-1 estimate at your 24.0% rate — not tax advice; consult a CPA.
Schools (NCES district)
- District
- Ysleta ISD
- NCES district ID
- 4846680
- Math proficiency
- 27% ▼ -31.00%
- Reading proficiency
- 35% ▼ -11.00%
- Median HH income
- $35,826
- Composite
- 25.65/100
- National rank
- #7400
- State rank
- #626 of 826 in TX
Livability — El Paso
- Score
- 81/100
- State rank
- #23
- US rank
- #1375
Category grades
Schools grade is shown separately in the Schools card above.
Census & demographics
- Census place
- El Paso, TX
- County
- El Paso County · 761,266 people
- City population
- 630,223
- Metro
- El Paso, TX
- Population (ZIP)
- 46,365
- Household income
- $41,617
- Rent vs Own
- Severe rent burden
- 1390.0
Population outlook (El Paso County) Hauer SSP2
- Today (2025)
- 897,899 people
- By 2030
- 922,694 · +2.8%
- By 2040
- 960,492 · +7.0%
- By 2050
- 982,919 · +9.5%
- By 2075
- 997,266 · +11.1%
- By 2100
- 900,630 · +0.3%
Race, ethnicity, and origin ACS 2023
- Neighborhood character
- Predominantly Hispanic (94%)
- Race & ethnicity
- Hispanic / Latino 94% Two or more races 42% White 4% Native American 1% Black 1%
- Hispanic origin (detail)
- Mexican 90%
- Foreign-born
- 28% · Canada
- Languages at home
- 21% English-only · Spanish 78%
Political lean MEDSL · El Paso
- 2024 margin
- D (+15.1) · D 57.0% · R 41.8% · Other 1.2%
- 2008→2024 swing
- -17.4pp toward R · 2008: 32.5pp · 2024: 15.1pp
- All cycles
- 2024: D+15.1 2020: D+35.1 2016: D+43.2 2012: D+32.6 2008: D+32.5
Not yet ingested
- Civics
- —
Market trends
- HPI YoY
- ▼ -27.34%
- Current HPI
- 251.9374
- Rent YoY
- ▲ 11.79%
- Metro
- El Paso, TX
- State GDP YoY
- ▲ 3.95%
- F500 in state
- 110
Industry mix (Fortune 500 HQ in TX)
| Industry | F500 HQs | Revenue |
|---|---|---|
| Energy | 16 | $1,198B |
|
||
| Technology | 5 | $198B |
|
||
| Engineering / Construction | 4 | $72B |
|
||
| Energy Services | 3 | $60B |
|
||
| Utilities | 3 | $41B |
|
||
| Healthcare | 2 | $330B |
|
||
Price history
-11.4% since first listed5 events — show timeline
- 2026-06-18 Pending — GEPARMLS
- 2026-06-16 Listed $78,000 GEPARMLS
- 2025-11-26 Pending — GEPARMLS
- 2025-11-23 Contingent — GEPARMLS
- 2025-10-14 Listed $88,000 GEPARMLS
Property tax history
+9.7%/yrLatest (2025): $2,371 · +2.2% YoY. Source: county tax records.
Cash-flow waterfall
monthlySold comps — $/sqft
last 12 mo · ≤1 miLoading sold comps…