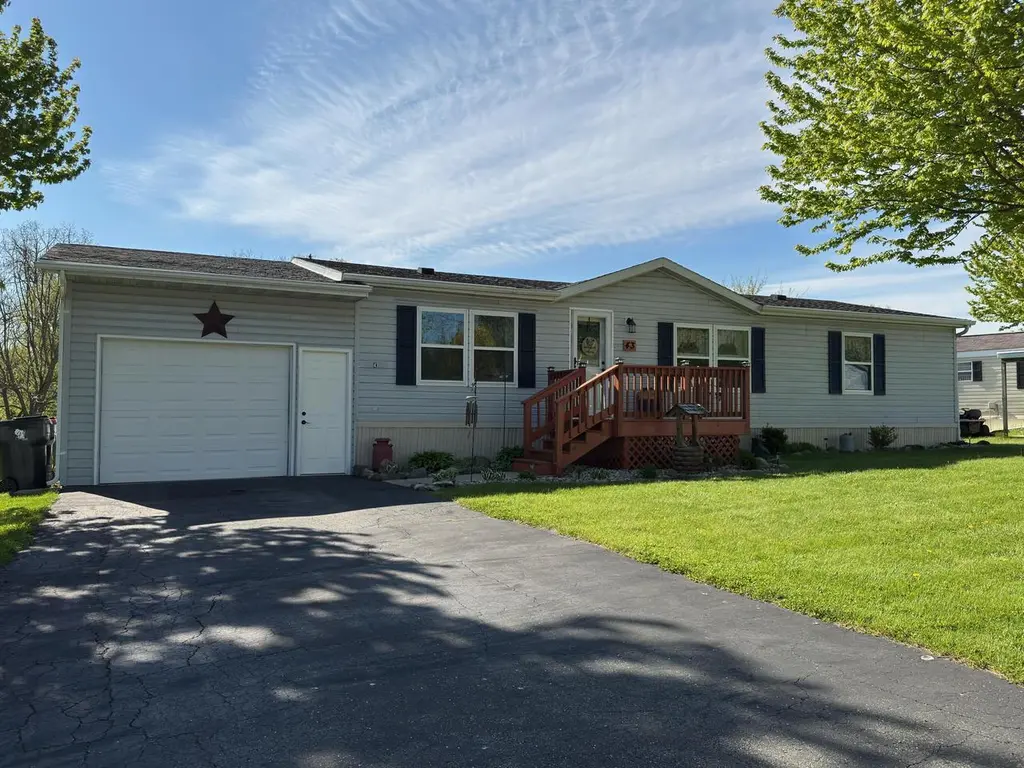
105 Aztanlan St #43 · Johnson Creek, WI
Flood risk No data
- FEMA flood zone
- —
- Chance of flooding over 30 yrs
- —
- Est. flood insurance / yr
- —
Fire risk No data
- Est. fire insurance / yr
- —
Heat risk No data
- Hot days now (above threshold)
- —
- Hot days in 30 yrs
- —
Wind risk No data
- Chance of severe wind over 30 yrs
- —
Air-quality risk No data
- Unhealthy air days now
- —
- Unhealthy air days in 30 yrs
- —
Risk factors via First Street. Map © Google.
Why this score? — see what drove the B- grade
The composite is a weighted blend of 9 inputs, each scored 0–100. Each bar is that input's sub-score; the figure is the points it added to the 100-point composite (weight × sub-score).
- Cash flow +30.0/30.0
- DSCR +10.0/10.0
- 1% rule +8.6/10.0
- ARV discount +7.5/15.0
- Livability +4.0/5.0
- Condition / age +3.8/5.0
- Schools +3.2/10.0
- Rent growth +2.5/5.0
- Appreciation +0.0/10.0
$125,000
🖨 Deal sheet 📄 Offer letter ✓ Due diligence
Listing remarks
Personal property sale only -- no real estate included. Monthly lot base rent is $693 per seller. Welcome home to this beautifully updated 3-bedroom, 2-bath split-ranch style manufactured home located in Back Acres. Inside you'll find a custom kitchen featuring updated cabinetry, custom countertops, dining area, and a spacious living room. The primary suite offers a walk-in closet and private bath with a low-step shower. Two additional bedrooms each feature walk-in closets and share a second full bath with tub/shower. Outside, enjoy a well-maintained yard with mature perennials, large wooden deck, attached 1-car garage, and storage shed. Relax in the backyard overlooking Johnson Creek. Buye
Key facts
- Custom kitchen
- Walk-in closet
- Private bath
Tags
Property features AI
Finance
- Other: Includes refrigerator, stove, washer, dryer, owned water softener, outdoor shed, and mini blinds; Excludes personal property, freezer in garage, and window curtains
Exterior
- Parking: Attached 1-car garage with opener
- Utilities: Water/waste: Other (see remarks)
- Home design: Single-family, 1-story home; Located in the Back Acres Park subdivision; Zoned residential; Less than 1/2 acre
- Construction: Vinyl siding
- Exterior features: Deck; Vinyl exterior; Outdoor shed; Waterfront on Johnson Creek with creek frontage and water view
Interior
- Kitchen: Refrigerator; Range/Stove; Pantry
- Bedrooms: Master bedroom (Main level) — 14 x 13; Bedroom 2 (Main level) — 12 x 10; Bedroom 3 (Main level) — 13 x 10
- Bathrooms: Two full bathrooms; Master bath with dual entry and walk-in shower
- Heating & cooling: Forced air heating; Natural gas fuel
- Interior features: Owned water softener; Pantry; Skylights; Walk-in closets; No basement (slab)
- Laundry & utility: Washer and dryer included
Neighborhood map
What this means for you Summary
Snapshot
- This is a 3-bed/2.0-bath single-family listed at $125k. Condition is rated good.
Deal economics
- At list price, monthly cash flow is $479 ($6k/yr) — positive.
- The deal already cash-flows at list — no discount required.
- Meets the 1% rule at list price ($2k rent vs $125k).
- Recommended offer: $121k (3.0% below list) — sets the bar for market timing.
Location & tenants
- Location reads 81/100 on livability (#53 in WI, #1,505 nationally) — a professional / high-income tenant draw. Strengths: crime A+, employment A+, housing A+; Watch: amenities C-, schools D+, commute F.
- Johnson Creek School District (town): math 38% / reading 32% proficiency, ranked #204 of 342 in WI (top 60%) — families likely to look elsewhere, expect single-tenant / working-renter base with shorter leases.
- Market conditions: 20 active listings in the ZIP; 1 comparable units currently listed for rent nearby; 145 units permitted in Jefferson County in 2024 (0 in 5+ unit buildings).
Forward outlook
- Local home prices are declining (-3.0%/yr); year-one equity from $864 of loan paydown is wiped out by about $4k of value loss. Plan a longer hold.
- Jefferson County population projected to shrink 6% by 2050 — rents likely to lag national; underwrite the cash flow, not the appreciation.
- At projected returns (-3.0% appreciation + 3.0% rent growth), your $35k cash investment doubles in ~8 years — after that, you're playing with house money.
Negotiation context
- It's been on market 42 days — a 3% lower offer ($121k) is reasonable based on typical stale-listing flexibility.
Questions for the listing agent
- It's been on market 42 days. Have you received any prior offers? Is the seller open to a 3% concession, seller financing, or rate buy-down credit?
- Is there a deadline driving the sale (1031 exchange, divorce, estate, relocation)? That informs how much negotiation room exists.
- Schools are D-rated, which usually means shorter tenancies and higher turnover. Who's the typical renter profile here, and what's been the actual vacancy rate?
- What's the average days-on-market for RENTAL listings here right now (not sales)? A rising rental-DOM trend means longer vacancies and softer asking-rent achievability than the comps imply.
- What's the recent tenant-quality profile in this submarket — average credit score on applications, eviction rate, late-payment / NSF rate, and stable-employment percentage? A property-management company in the area should have these aggregated.
- How much new for-sale + rental construction is in the pipeline within 1–3 miles? Heavy new supply typically softens prices + rents 12–24 months out; constrained supply supports both.
Investment metrics
- 1% rule
- 1.36% ✓
- Cap rate
- 10.89%
- Cash-on-cash
- 16.43%
- DSCR
- 1.73
- GRM
- 6.1
CMA / ARV
- ARV (median comp)
- $306,021
- List price
- $125,000
- Delta
- -59.15%
- Verdict
- UNDERPRICED
- Comps
- 20 within 1.0 mi
Show comp detail 4 sales within ~0.75 mi
| Address | Dist | Beds/Ba | Sqft | Sold | Price | $/sf | Match |
|---|---|---|---|---|---|---|---|
| 228 Jefferson St | 0.17mi | 3/1.0 | 1,224 (-2%) | 14mo | $282,000 | $230 | 73 |
| 221 Pioneer Dr | 0.52mi | 3/2.0 | 1,269 (+2%) | 1mo | $400,000 | $315 | 73 |
| 240 Jefferson St | 0.22mi | 3/1.0 | 1,172 (-6%) | 9mo | $307,500 | $262 | 68 |
| 214 Parkview Dr | 0.47mi | 3/3.0 | 1,434 (+15%) | 19mo | $396,000 | $276 | 33 |
Match score weights: distance 35% · size 25% · config 20% · recency 20%. Top-matched comps best support the ARV.
Projected returns pro-forma
-3.0% appreciation · 3.0% rent growth · sell at horizon
- IRR
- 7.5%
- Equity multiple
- 1.29×
- Total profit
- $10,288
- Equity at exit
- $18,638
- IRR
- 16.8%
- Equity multiple
- 2.38×
- Total profit
- $48,359
- Equity at exit
- $10,808
Cash invested: $35,000 (down + closing). Projections, not guarantees.
Landlord ↔ Tenant lean methodology
- Overall (STATE)
- 73 Landlord-Friendly
- State Wisconsin
- 73 Landlord-Friendly · R+2
- County
- — inherits STATE
- City
- — inherits STATE
ZIP-level market 53038
- Home prices YoY
- -27.6%
- Active inventory
- 20
- Price-to-rent
- 6.1×
Monthly cashflow live
- Estimated rent
- $1,700 medium interval (Pro) →
- Mortgage (P&I)
- −$656
- Tax est. 1.5%
- −$156 /mo · $1,875/yr
- Insurance
- −$52
- HOA
- −$0
- Vacancy / Maint / Mgmt
- −$357
- Net cashflow
- $479
Break-even live
UW: 25.0% down · 7.5% · 30yr · 1.5% tax · 5.0% vac · 8.0% maint · 8.0% mgmt
Financing live
Cash to close
- Down payment
- $31,250
- Closing costs
- $3,750
- Reserves months
- —
- Total cash needed
- —
Loan-product check · same deal, 3 products live
Conventional
25% down · 7.5% · 30yr
- Down + closing
- —
- Monthly P&I
- —
- Monthly cashflow
- —
- DSCR
- —
- Eligible?
- —
Personal DTI + credit; lowest rate.
DSCR
20% down · 8.5% · 30yr
- Down + closing
- —
- Monthly P&I
- —
- Monthly cashflow
- —
- DSCR
- —
- Eligible?
- —
No personal income docs; deal must DSCR.
Hard money
10% down · 12.0% · 12mo
- Down + closing
- —
- Monthly P&I
- —
- Monthly cashflow
- —
- DSCR
- —
- Eligible?
- —
Short-term bridge; refi at stabilization.
Rent comps 1 comps
| Address | Beds | Baths | Sqft | Rent | $/sqft | DOM | Units | Dist |
|---|---|---|---|---|---|---|---|---|
| 101 Deer Xing Johnson Creek, WI | 2.0 | 2.0 | 1300 | $1,700 | $1.31 | 10d | 1 | 0.60mi |
Listing history 17 events
-
2026-06-19days on market $125,000 Active 42 DOM
-
2026-06-18days on market $125,000 Active 41 DOM
-
2026-06-17days on market $125,000 Active 40 DOM
-
2026-06-16days on market $125,000 Active 39 DOM
-
2026-06-15days on market $125,000 Active 38 DOM
-
2026-06-14days on market $125,000 Active 36 DOM
-
2026-06-12days on market $125,000 Active 35 DOM
-
2026-06-09days on market $125,000 Active 32 DOM
-
2026-06-08days on market $125,000 Active 31 DOM
-
2026-06-07days on market $125,000 Active 30 DOM
-
2026-06-05days on market $125,000 Active 28 DOM
-
2026-06-04days on market $125,000 Active 26 DOM
-
2026-06-02days on market $125,000 Active 25 DOM
-
2026-06-01days on market $125,000 Active 24 DOM
-
2026-05-31days on market $125,000 Active 23 DOM
-
2026-05-31days on market $125,000 Active 22 DOM
-
2026-05-08$125,000 Active 798-char remark
ⓘ Source: listings_history table (triggers on properties + properties_extension) + one-shot
backfill from property_details.listing_events for pre-trigger history.
Nearby sold comps map
Loading sold comps map…
Walkable amenities ~0.75 mi
Loading nearby amenities…
Taxation est. · year 1
- Rental income
- $20,400
- − Mortgage interest
- −$7,002
- − Property taxes
- −$1,875
- − Insurance
- −$625
- − Repairs & maintenance
- −$1,632
- − Management
- −$1,632
- − Depreciation
- −$3,636
- Taxable income
- $3,998
- Est. tax owed @ 24.0%
- −$959
- After-tax cash flow
- $4,790/yr
For passive investors: Depreciation is non-cash, so a rental often shows a tax loss while cash-flowing — sheltering income. Rental losses are passive: they offset passive income freely, and up to $25,000/yr can offset ordinary (W-2) income if you actively participate and your MAGI is under $100k (phasing out to $0 by $150k); unused losses carry forward. On sale, claimed depreciation is recaptured at up to 25%, and gains may owe capital-gains tax (a 1031 exchange can defer both). Figures are a year-1 estimate at your 24.0% rate — not tax advice; consult a CPA.
Condition & rehab AI · 13 photos
This well-maintained, updated 3-bedroom, 2-bath manufactured home is ready for a new owner. The property features a custom kitchen, updated bathrooms, and a spacious deck with a view of Johnson Creek.
Value-add opportunities
- Both Paint exterior trim — Enhances curb appeal and value
- Both Clean gutters — Improves drainage and property value
Renovation cost estimate screening
Value-add ROI direction
- Both Paint exterior trim — Enhances curb appeal and value ↑
- Both Clean gutters — Improves drainage and property value ↑
ⓘ Cost ranges are severity-bucket heuristics (US national rule-of-thumb). Get contractor quotes + a written scope before underwriting a rehab budget.
Schools (NCES district)
- District
- Johnson Creek School District
- NCES district ID
- 5507170
- Math proficiency
- 38% ▼ -2.00%
- Reading proficiency
- 32% ▲ 2.00%
- Median HH income
- $66,775
- Composite
- 31.99/100
- National rank
- #5837
- State rank
- #204 of 342 in WI
Livability — Johnson Creek
- Score
- 81/100
- State rank
- #53
- US rank
- #1505
Category grades
Schools grade is shown separately in the Schools card above.
Census & demographics
- Census place
- Johnson Creek, WI
- City population
- 4,319
- Population (ZIP)
- 4,319
Population outlook (Jefferson County) Hauer SSP2
- Today (2025)
- 86,617 people
- By 2030
- 86,818 · +0.2%
- By 2040
- 85,552 · -1.2%
- By 2050
- 81,765 · -5.6%
- By 2075
- 68,937 · -20.4%
- By 2100
- 55,854 · -35.5%
Race, ethnicity, and origin ACS 2023
- Neighborhood character
- Predominantly White (88%)
- Race & ethnicity
- White 88% Two or more races 5% Asian 4% Hispanic / Latino 4%
- Common ancestry
- Portuguese 8% Romanian 7% Lithuanian 2%
- Foreign-born
- 5% · Canada, Vietnam
- Languages at home
- 94% English-only · Spanish 4% Vietnamese 2%
Political lean MEDSL · Jefferson
- 2024 margin
- R (+16.4) · D 41.1% · R 57.5% · Other 1.4%
- 2008→2024 swing
- -17.2pp toward R · 2008: 0.8pp · 2024: -16.4pp
- All cycles
- 2024: R+16.4 2020: R+15.2 2016: R+16.2 2012: R+7.6 2008: D+0.8
Not yet ingested
- Civics
- —
Market trends
- HPI YoY
- ▼ -87.07%
- Current HPI
- 228.459
- Rent YoY
- —
- Metro
- —
- State GDP YoY
- ▲ 2.10%
- F500 in state
- 20
Industry mix (Fortune 500 HQ in WI)
| Industry | F500 HQs | Revenue |
|---|---|---|
| Industrial Machinery | 4 | $23B |
|
||
| Industrial Technology | 2 | $36B |
|
||
| Insurance | 1 | $36B |
|
||
| Professional Services | 1 | $19B |
|
||
| Utilities | 1 | $9B |
|
||
| Consumer Goods | 1 | $3B |
|
||
Price history
1 event — show timeline
- 2026-05-08 Listed $125,000 METROMLS
Cash-flow waterfall
monthlySold comps — $/sqft
last 12 mo · ≤1 miLoading sold comps…