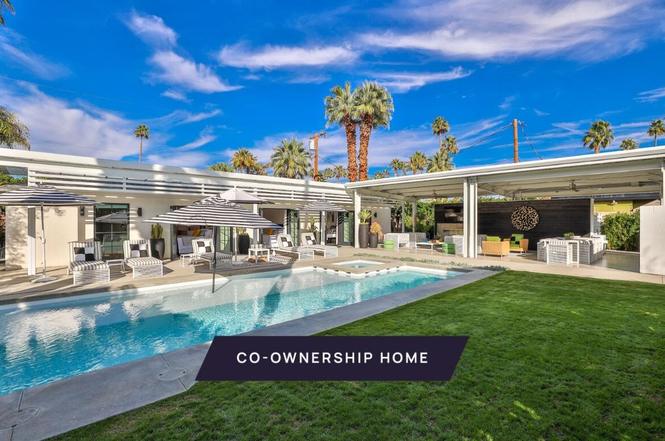
470 E Avenida Olancha Unit B · Palm Springs, CA
Flood risk 1/10 · Minimal
- FEMA flood zone
- X (shaded)
- Chance of flooding over 30 yrs
- 0.0%
- Est. flood insurance / yr
- $507 – $1,088
Fire risk 5/10 · Moderate
- Est. fire insurance / yr
- $659 – $1,223
Heat risk 9/10 · Severe
- Hot days now (above 110°F)
- 9 days/yr
- Hot days in 30 yrs
- 26 days/yr
Wind risk 1/10 · Minimal
- Chance of severe wind over 30 yrs
- —
Air-quality risk 5/10 · Moderate
- Unhealthy air days now
- 6 days/yr
- Unhealthy air days in 30 yrs
- 8 days/yr
Risk factors via First Street. Map © Google.
Why this score? — see what drove the B- grade
The composite is a weighted blend of 9 inputs, each scored 0–100. Each bar is that input's sub-score; the figure is the points it added to the 100-point composite (weight × sub-score).
- Cash flow +30.0/30.0
- 1% rule +10.0/10.0
- DSCR +10.0/10.0
- ARV discount +7.5/15.0
- Livability +3.3/5.0
- Schools +2.7/10.0
- Condition / age +2.5/5.0
- Rent growth +2.4/5.0
- Appreciation +0.0/10.0
$175,000
🖨 Deal sheet 📄 Offer letter ✓ Due diligence
Listing remarks MLS
New co-ownership opportunity by Pacaso: Own one-eighth of Bacana, a professionally managed, turnkey home. Bacana is a reimagined Palm Springs micro-resort where outdoor gathering spaces meet private retreat living. This one-of-a-kind Pacaso property features five individual casita-style guest suites, each thoughtfully appointed with its own kitchen, bathroom, and dining nook-offering a blend of shared spaces and private accommodations. Designed to embrace indoor-outdoor living, the heart of the property is the expansive outdoor courtyard, anchored by a saltwater pool, spa, and mountain views. The central social space is the spacious cabana, featuring a 10-person dining and seating area and a culinary demonstration kitchen with BBQ, burner cooktop, dishwasher, and sink. Additional features include an outdoor fireplace, industrial fans, ambient lighting, and a recessed flat-screen TV - creating a comfortable setting for outdoor dining and entertaining. Each suite is fully furnished and professionally decorated, providing flexible accommodations across the property. With indoor-outdoor flow, mountain views, and Pacaso's professional property management, owners benefit from a turnkey ownership experience in the Palm Springs area.
Key facts
- Turnkey home
- Cul-de-sac
- Efficient kitchens
Tags
Neighborhood map
What this means for you Summary
Snapshot
- This is a 3-bed/5.0-bath other listed at $175k.
Deal economics
- At list price, monthly cash flow is $1k ($16k/yr) — positive.
- The deal already cash-flows at list — no discount required.
- Meets the 1% rule at list price ($3k rent vs $175k).
- Cap rate 15.7% vs local median 2.7% in Palm Springs — top-decile yield for the area; either an underpriced asset or a hidden risk that comps aren't pricing in. Stress-test before assuming the spread holds.
Location & tenants
- Location reads 66/100 on livability (#348 in CA) — a middle-class / working-renter tenant base. Strengths: amenities A+, commute A+; Watch: schools C-, crime F, cost of living F.
- Palm Springs Unified (suburban): math 21% / reading 42% proficiency, ranked #328 of 517 in CA (top 63%) — families likely to look elsewhere, expect single-tenant / working-renter base with shorter leases; 73% free/reduced lunch — lower-income household profile, screen leases tightly.
- Market conditions: Rents soft (-0.4%/yr); 492 active listings in the ZIP; 40 comparable units currently listed for rent nearby; rentals at typical pace (median 24d on market — plan ~3-4 weeks tenant-placement turnaround); solid renter incomes; 9,195 units permitted in Riverside County in 2024 (1,512 in 5+ unit buildings).
- At $3,259/mo this rent would consume 50% of the median local household income ($78k/yr) (locally 1215% of renters already pay >50% of income on rent) — very limited rent-growth headroom before tenants either downsize or default.
Forward outlook
- Local home prices are declining (-3.0%/yr); year-one equity from $1k of loan paydown is wiped out by about $5k of value loss. Plan a longer hold.
- Riverside County population projected at +22% by 2050 — long-run rental-demand tailwind backs the buy-and-hold thesis.
- At projected returns (-3.0% appreciation + 0.0% rent growth), your $49k cash investment doubles in ~4 years — after that, you're playing with house money.
Negotiation context
- Only 1 days on market — expect competitive offers; lowballing is unlikely to land.
Risks & watch-outs
- Watch-outs: built in 1949 — expect roof / HVAC / electrical / plumbing capex.
- Climate carrying-cost: moderate wildfire risk; extreme-heat days projected 9→26/yr by 2055 (HVAC capex compounding) — expect insurance premiums to compound above CPI over the hold.
Questions for the listing agent
- Built in 1949 — when were the roof, HVAC, electrical panel, plumbing, and water heater last replaced?
- Is there a deadline driving the sale (1031 exchange, divorce, estate, relocation)? That informs how much negotiation room exists.
- Crime grade is F in this area — have there been break-ins, vandalism, or insurance claims at this property in the last 3 years? What carrier currently insures it and at what premium?
- What's the average days-on-market for RENTAL listings here right now (not sales)? A rising rental-DOM trend means longer vacancies and softer asking-rent achievability than the comps imply.
- What's the recent tenant-quality profile in this submarket — average credit score on applications, eviction rate, late-payment / NSF rate, and stable-employment percentage? A property-management company in the area should have these aggregated.
- How much new for-sale + rental construction is in the pipeline within 1–3 miles? Heavy new supply typically softens prices + rents 12–24 months out; constrained supply supports both.
Investment metrics
- 1% rule
- 1.86% ✓
- Cap rate
- 15.66%
- Cash-on-cash
- 33.44%
- DSCR
- 2.49
- GRM
- 4.5
CMA / ARV
No comps found within radius.
Projected returns pro-forma
-3.0% appreciation · 0.0% rent growth · sell at horizon
- IRR
- 25.3%
- Equity multiple
- 2.00×
- Total profit
- $49,114
- Equity at exit
- $26,093
- IRR
- 31.1%
- Equity multiple
- 3.41×
- Total profit
- $118,046
- Equity at exit
- $15,131
Cash invested: $49,000 (down + closing). Projections, not guarantees.
Landlord ↔ Tenant lean methodology
- Overall (STATE)
- 18 Strongly Tenant-Friendly
- State California
- 18 Strongly Tenant-Friendly · D+13
- County
- — inherits STATE
- City
- — inherits STATE
ZIP-level market 92264
- Rents YoY
- -0.4%
- Active inventory
- 492
- Price-to-rent
- 4.5×
Monthly cashflow live
- Estimated rent
- $3,259 high interval (Pro) →
- Mortgage (P&I)
- −$918
- Tax est. 1.5%
- −$219 /mo · $2,625/yr
- Insurance
- −$73
- HOA
- −$0
- Vacancy / Maint / Mgmt
- −$684
- Net cashflow
- $1,366
Break-even live
UW: 25.0% down · 7.5% · 30yr · 1.5% tax · 5.0% vac · 8.0% maint · 8.0% mgmt
Financing live
Cash to close
- Down payment
- $43,750
- Closing costs
- $5,250
- Reserves months
- —
- Total cash needed
- —
Loan-product check · same deal, 3 products live
Conventional
25% down · 7.5% · 30yr
- Down + closing
- —
- Monthly P&I
- —
- Monthly cashflow
- —
- DSCR
- —
- Eligible?
- —
Personal DTI + credit; lowest rate.
DSCR
20% down · 8.5% · 30yr
- Down + closing
- —
- Monthly P&I
- —
- Monthly cashflow
- —
- DSCR
- —
- Eligible?
- —
No personal income docs; deal must DSCR.
Hard money
10% down · 12.0% · 12mo
- Down + closing
- —
- Monthly P&I
- —
- Monthly cashflow
- —
- DSCR
- —
- Eligible?
- —
Short-term bridge; refi at stabilization.
Rent comps 40 comps
| Address | Beds | Baths | Sqft | Rent | $/sqft | DOM | Units | Dist |
|---|---|---|---|---|---|---|---|---|
| 500 Paseo Soleado Unit 497 Palm Springs, CA | 3.0 | 2.5 | 1812 | $3,000 | $1.66 | 43d | 1 | 0.08mi |
| 500 Paseo Soleado Unit 485 Palm Springs, CA | 2.0 | 2.5 | 1712 | $2,800 | $1.64 | 43d | 1 | 0.08mi |
| 780 E Palm Canyon Dr #202 Palm Springs, CA | 2.0 | 2.0 | 1305 | $2,950 | $2.26 | 24d | 1 | 0.14mi |
| 1425 Via Soledad Unit 1 Palm Springs, CA | 2.0 | 2.0 | 1050 | $2,500 | $2.38 | 43d | 1 | 0.18mi |
| 1425 Via Soledad Unit 1 Palm Springs, CA | 2.0 | 2.0 | 1050 | $2,500 | $2.38 | 24d | 1 | 0.18mi |
| 1428 S Camino Real Palm Springs, CA | 2.0 | 2.0 | 1054 | $2,300 | $2.18 | 43d | 1 | 0.22mi |
| 791 E Twin Palms Dr Palm Springs, CA | 3.0 | 2.0 | 1793 | $9,700 | $5.41 | 43d | 1 | 0.26mi |
| 965 E Twin Palms Dr Palm Springs, CA | 3.0 | 2.0 | 1600 | $15,000 | $9.38 | 43d | 1 | 0.32mi |
| 1201 Surrey Ln Palm Springs, CA | 2.0 | 2.5 | 1896 | $5,500 | $2.90 | 43d | 1 | 0.38mi |
| 1150 E Palm Canyon Dr #60 Palm Springs, CA | 2.0 | 2.0 | 1240 | $2,595 | $2.09 | 24d | 1 | 0.44mi |
| 722 E San Lorenzo Rd Palm Springs, CA | 3.0 | 1.0–2.0 | 750 | $2,425 | $3.23 | 7d | 3 | 0.46mi |
| 722 E San Lorenzo Rd Unit 02 Palm Springs, CA | 3.0 | 2.0 | 1200 | $2,425 | $2.02 | 3d | 1 | 0.46mi |
| 1947 S Joshua Tree Pl Palm Springs, CA | 3.0 | 2.5 | 1928 | $6,000 | $3.11 | 23d | 1 | 0.48mi |
| 157 Calle Bravo Palm Springs, CA | 2.0 | 3.0 | 1694 | $3,150 | $1.86 | 4d | 1 | 0.50mi |
| 1970 S Joshua Tree Pl Palm Springs, CA | 3.0 | 2.0 | 1957 | $8,175 | $4.18 | 43d | 1 | 0.52mi |
| 1970 S Joshua Tree Pl Palm Springs, CA | 3.0 | 2.0 | 1957 | $8,175 | $4.18 | 14d | 1 | 0.52mi |
| 1486 E Palm Tree Dr Palm Springs, CA | 2.0 | 2.0 | 1300 | $3,000 | $2.31 | 43d | 1 | 0.62mi |
| 251 E La Verne Way Unit F Palm Springs, CA | 2.0 | 2.0 | 1345 | $2,550 | $1.90 | 24d | 1 | 0.70mi |
| 1041 S La Verne Way Palm Springs, CA | 2.0 | 2.0 | 1325 | $2,800 | $2.11 | 24d | 1 | 0.71mi |
| 1423 E San Lorenzo Rd Palm Springs, CA | 4.0 | 2.0 | 1824 | $4,200 | $2.30 | 24d | 1 | 0.75mi |
| 2220 S Calle Palo Fierro #23 Palm Springs, CA | 2.0 | 2.0 | 1200 | $2,995 | $2.50 | 10d | 1 | 0.75mi |
| 451 E Via Carisma #72 Palm Springs, CA | 2.0 | 2.0 | 1170 | $2,200 | $1.88 | 24d | 1 | 0.76mi |
| 1331 S Sunrise Way Palm Springs, CA | 3.0 | 3.0 | 2160 | $7,000 | $3.24 | 43d | 1 | 0.80mi |
| 1111 E Ramon Rd #87 Palm Springs, CA | 3.0 | 2.0 | 1313 | $4,500 | $3.43 | 17d | 1 | 0.83mi |
| 1710 E Sonora Rd Palm Springs, CA | 2.0 | 2.0 | 1391 | $2,800 | $2.01 | 24d | 1 | 0.83mi |
| 250 E San Jose Rd Palm Springs, CA | 2.0–3.0 | 2.0 | 1187 | $2,400 | $2.02 | 43d | 2 | 0.85mi |
| 250 E San Jose Rd #63 Palm Springs, CA | 2.0 | 2.0 | 1152 | $2,400 | $2.08 | 24d | 1 | 0.85mi |
| 1745 Capri Cir Palm Springs, CA | 2.0 | 2.0 | 1200 | $2,495 | $2.08 | 24d | 1 | 0.91mi |
| 1111 E Ramon Rd Palm Springs, CA | 2.0–3.0 | 2.0 | 1191 | $4,500 | $3.78 | 24d | 2 | 0.98mi |
| 1111 E Ramon Rd Palm Springs, CA | 2.0–3.0 | 2.0 | 1191 | $4,500 | $3.78 | 16d | 2 | 0.98mi |
| 453 Village Square E Palm Springs, CA | 2.0 | 2.0 | 1400 | $3,000 | $2.14 | 16d | 1 | 0.99mi |
| 874 Village Square N Palm Springs, CA | 2.0 | 2.0 | 1680 | $3,000 | $1.79 | 18d | 1 | 1.02mi |
| 998 Village Square N Palm Springs, CA | 2.0 | 2.0 | 1588 | $3,000 | $1.89 | 24d | 1 | 1.03mi |
| 1050 E Ramon Rd Palm Springs, CA | 2.0 | 2.0 | 1253 | $3,815 | $3.04 | 43d | 2 | 1.04mi |
| 3000 Cahuilla Hills Dr Palm Springs, CA | 3.0 | 3.0 | 2120 | $7,000 | $3.30 | 43d | 1 | 1.12mi |
| 17 Cahuilla Hills Dr Palm Springs, CA | 2.0 | 2.0 | 1965 | $10,500 | $5.34 | 43d | 1 | 1.13mi |
| 900 E Saturnino Rd Palm Springs, CA | 1.0–3.0 | 1.0–2.0 | 1020 | $2,575 | $2.52 | 1d | 6 | 1.14mi |
| 255 E Avenida Granada #525 Palm Springs, CA | 2.0 | 2.0 | 1198 | $2,195 | $1.83 | 18d | 1 | 1.23mi |
| 255 E Avenida Granada #324 Palm Springs, CA | 2.0 | 2.0 | 1198 | $2,100 | $1.75 | 7d | 1 | 1.23mi |
| 2001 E Camino Parocela Unit D29 Palm Springs, CA | 2.0 | 2.0 | 1175 | $3,900 | $3.32 | 43d | 1 | 1.26mi |
Listing history 2 events
-
2026-06-17statusdays on market $175,000 Active 1 DOM
-
2026-03-12$175,000 Active 1245-char remark
Show marketing remark (1245 chars)
New co-ownership opportunity by Pacaso: Own one-eighth of Bacana, a professionally managed, turnkey home. Bacana is a reimagined Palm Springs micro-resort where outdoor gathering spaces meet private retreat living. This one-of-a-kind Pacaso property features five individual casita-style guest suites, each thoughtfully appointed with its own kitchen, bathroom, and dining nook-offering a blend of shared spaces and private accommodations. Designed to embrace indoor-outdoor living, the heart of the property is the expansive outdoor courtyard, anchored by a saltwater pool, spa, and mountain views. The central social space is the spacious cabana, featuring a 10-person dining and seating area and a culinary demonstration kitchen with BBQ, burner cooktop, dishwasher, and sink. Additional features include an outdoor fireplace, industrial fans, ambient lighting, and a recessed flat-screen TV - creating a comfortable setting for outdoor dining and entertaining. Each suite is fully furnished and professionally decorated, providing flexible accommodations across the property. With indoor-outdoor flow, mountain views, and Pacaso's professional property management, owners benefit from a turnkey ownership experience in the Palm Springs area.
ⓘ Source: listings_history table (triggers on properties + properties_extension) + one-shot
backfill from property_details.listing_events for pre-trigger history.
Climate risk First Street
- Flood 1/10 Low FEMA zone X (shaded) · 0% chance over 30 yrs
- Wildfire 5/10 Major
- Heat 9/10 Extreme 9 d/yr ≥110°F today · 26 d/yr by 30 yrs out
- Wind 1/10 Low
- Air quality 5/10 Major 6 unhealthy d/yr today · 8 by 30 yrs out
Nearby sold comps map
Loading sold comps map…
Walkable amenities ~0.75 mi
Loading nearby amenities…
Taxation est. · year 1
- Rental income
- $39,113
- − Mortgage interest
- −$9,803
- − Property taxes
- −$2,625
- − Insurance
- −$875
- − Repairs & maintenance
- −$3,129
- − Management
- −$3,129
- − Depreciation
- −$5,091
- Taxable income
- $14,462
- Est. tax owed @ 24.0%
- −$3,471
- After-tax cash flow
- $12,916/yr
For passive investors: Depreciation is non-cash, so a rental often shows a tax loss while cash-flowing — sheltering income. Rental losses are passive: they offset passive income freely, and up to $25,000/yr can offset ordinary (W-2) income if you actively participate and your MAGI is under $100k (phasing out to $0 by $150k); unused losses carry forward. On sale, claimed depreciation is recaptured at up to 25%, and gains may owe capital-gains tax (a 1031 exchange can defer both). Figures are a year-1 estimate at your 24.0% rate — not tax advice; consult a CPA.
Schools (NCES district)
- District
- Palm Springs Unified
- NCES district ID
- 0629550
- Math proficiency
- 21% ▼ -7.00%
- Reading proficiency
- 42% ▬ 0.00%
- Median HH income
- $43,638
- Composite
- 26.76/100
- National rank
- #7131
- State rank
- #328 of 517 in CA
Livability — Palm Springs
- Score
- 66/100
- State rank
- #348
- US rank
- #11850
Category grades
Schools grade is shown separately in the Schools card above.
Census & demographics
- Census place
- Palm Springs, CA
- County
- Riverside County · 2,287,001 people
- City population
- 46,786
- Metro
- Riverside-San Bernardino-Ontario, CA
- Population (ZIP)
- 19,899
- Household income
- $77,688
- Rent vs Own
- Severe rent burden
- 1215.0
Population outlook (Riverside County) Hauer SSP2
- Today (2025)
- 2,664,475 people
- By 2030
- 2,802,692 · +5.2%
- By 2040
- 3,050,904 · +14.5%
- By 2050
- 3,256,783 · +22.2%
- By 2075
- 3,655,058 · +37.2%
- By 2100
- 3,766,594 · +41.4%
Race, ethnicity, and origin ACS 2023
- Neighborhood character
- Predominantly White (68%)
- Race & ethnicity
- White 68% Hispanic / Latino 20% Two or more races 12% Asian 6% Black 2% Native American 1%
- Hispanic origin (detail)
- Mexican 16%
- Common ancestry
- Lithuanian 4% Romanian 3% Slovak 3%
- Foreign-born
- 16% · Canada, China, South Korea
- Languages at home
- 81% English-only · Spanish 13% Tagalog/Filipino 2% Other Asian/Pacific 1%
Political lean MEDSL · Riverside
- 2024 margin
- Toss-up / Even · D 48.0% · R 49.3% · Other 2.6%
- 2008→2024 swing
- -3.6pp toward R · 2008: 2.3pp · 2024: -1.3pp
- All cycles
- 2024: R+1.3 2020: D+8.0 2016: D+4.3 2012: R+0.4 2008: D+2.3
Not yet ingested
- Civics
- —
Market trends
- HPI YoY
- ▼ -489.04%
- Current HPI
- 357.0969
- Rent YoY
- ▼ -0.43%
- Metro
- Riverside-San Bernardino-Ontario, CA
- State GDP YoY
- ▲ 3.21%
- F500 in state
- 116
Industry mix (Fortune 500 HQ in CA)
| Industry | F500 HQs | Revenue |
|---|---|---|
| Technology | 27 | $1,492B |
|
||
| Financial Services | 3 | $174B |
|
||
| Retail | 3 | $44B |
|
||
| Insurance | 3 | $26B |
|
||
| Media / Entertainment | 2 | $115B |
|
||
| Pharmaceuticals / Biotech | 2 | $62B |
|
||
Price history
1 event — show timeline
- 2026-03-12 Listed $175,000 GPSMLS
Cash-flow waterfall
monthlySold comps — $/sqft
last 12 mo · ≤1 miLoading sold comps…