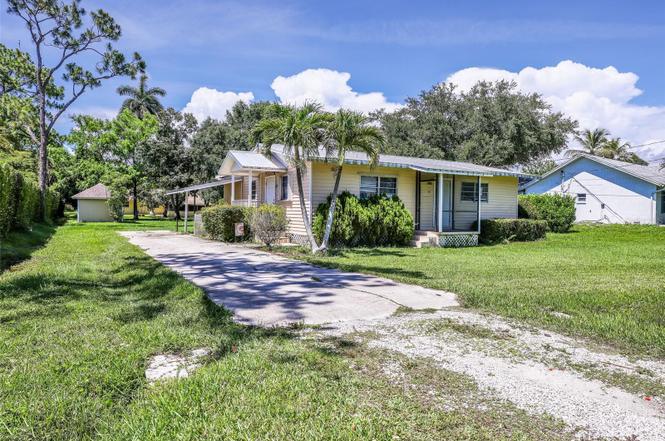
5211 Maple Ln · Naples Manor, FL
Flood risk 9/10 · Severe
- FEMA flood zone
- AE
- Chance of flooding over 30 yrs
- 0.99%
- Est. flood insurance / yr
- $1,737 – $8,500
Fire risk 3/10 · Minor
- Est. fire insurance / yr
- $947 – $1,759
Heat risk 10/10 · Severe
- Hot days now (above 107°F)
- 7 days/yr
- Hot days in 30 yrs
- 27 days/yr
Wind risk 10/10 · Severe
- Chance of severe wind over 30 yrs
- 99.0%
Air-quality risk 2/10 · Minimal
- Unhealthy air days now
- 2 days/yr
- Unhealthy air days in 30 yrs
- 2 days/yr
Risk factors via First Street. Map © Google.
Why this score? — see what drove the B grade
The composite is a weighted blend of 9 inputs, each scored 0–100. Each bar is that input's sub-score; the figure is the points it added to the 100-point composite (weight × sub-score).
- Cash flow +30.0/30.0
- 1% rule +10.0/10.0
- DSCR +10.0/10.0
- ARV discount +7.5/15.0
- Schools +5.0/10.0
- Rent growth +3.9/5.0
- Livability +3.3/5.0
- Condition / age +2.5/5.0
- Appreciation +0.0/10.0
$325,000
🖨 Deal sheet (PDF) 📄 Offer letter ✓ Due diligence
Listing remarks MLS
3 Bedrooms, 2 baths, Metal roof, New wood kitchen cabinets, granite counter tops, sink, plumbing, fixtures, flat top stove, new flooring throughout kitchen, hall and 2nd bath. Large screened lanai, huge 100 x 175 lot with city water and sewer, No deed restrictions or maintenance fees. Seller is very motivated!!
Key facts
- Updated electrical
- Metal roof
- Renovated kitchen
Tags
Property features AI
Finance
- Other: Partially furnished; Living area approx. 1,112 (public records); Total building area approx. 1,201 (public records)
- HOA & community: No HOA association indicated
Exterior
- Utilities: Public water; Public sewer; Electricity available and connected; Water available and connected; Sewer available and connected
- Home design: Single-family residence; One story; Faces south; Completed condition; Residential zoning (RSF-4)
- Construction: Frame construction; Metal roof; Slab foundation; Built on a 0.37-acre lot (approx. 100 x 160)
- Exterior features: Awnings; Exterior lighting; Private mailbox; Rain gutters; Sidewalk; Concrete road access
Interior
- Kitchen: Dishwasher; Range; Microwave; Refrigerator; Freezer
- Bedrooms: 3 bedrooms
- Flooring: Laminate flooring; Tile flooring
- Bathrooms: 2 full bathrooms
- Heating & cooling: Central heating; Central air conditioning
- Interior features: Ceiling fans; Crown molding; Eat-in kitchen; Open floor plan; Solid wood cabinets
- Laundry & utility: Washer; Dryer; Outdoor laundry area; Gas water heater
Neighborhood map
What this means for you Summary
Snapshot
- This is a 3-bed/2.0-bath single-family listed at $325k.
Deal economics
- At list price, monthly cash flow is $2k ($19k/yr) — positive.
- The deal already cash-flows at list — no discount required.
- Meets the 1% rule at list price ($5k rent vs $325k).
Location & tenants
- Location reads 66/100 on livability (#615 in FL) — a middle-class / working-renter tenant base. Strengths: housing A+, health & safety A+, cost of living B+; Watch: amenities F, commute F, employment D-.
- Collier (suburban): math 60% / reading 56% proficiency, ranked #16 of 73 in FL (top 22%) — acceptable for families but not a draw, mixed tenant base, ~2y average lease.
- Zoned schools: Manatee Elementary School (math 58% / reading 51%, grade C, #892 of 2,144 statewide, top 44%, 584 students, 73% FRL); Manatee Middle School (math 61% / reading 43%, grade C+, #217 of 571 statewide, top 40%, 749 students, 64% FRL); Lely High School (math 40% / reading 39%, grade F, #304 of 667 statewide, top 47%, 1,504 students, 54% FRL).
- Market conditions: Rents rising fast (+5.6%/yr); 598 active listings in the ZIP; 40 comparable units currently listed for rent nearby; rentals at typical pace (median 25d on market — plan ~3-4 weeks tenant-placement turnaround); solid renter incomes; 3,520 units permitted in Collier County in 2024 (959 in 5+ unit buildings).
- At $5,184/mo this rent would consume 76% of the median local household income ($82k/yr) (locally 954% of renters already pay >50% of income on rent) — very limited rent-growth headroom before tenants either downsize or default.
Forward outlook
- Local home prices are declining (-3.0%/yr); year-one equity from $2k of loan paydown is wiped out by about $10k of value loss. Plan a longer hold.
- Collier County population projected at +30% by 2050 — long-run rental-demand tailwind backs the buy-and-hold thesis.
- At projected returns (-3.0% appreciation + 5.6% rent growth), your $91k cash investment doubles in ~6 years — after that, you're playing with house money.
Negotiation context
- Only 5 days on market — expect competitive offers; lowballing is unlikely to land.
- 4 sale attempts since 19y ago with the ask held roughly flat each time — persistent listings suggest the price (not the market) is what's stuck; bring a comps-based counter.
- Current owner paid $229k; 42% above their basis — modest negotiation headroom, anchor on the comps not their cost.
Risks & watch-outs
- Watch-outs: flood insurance adds $427/mo.
- Climate carrying-cost: in FEMA flood zone AE (mandatory federal flood insurance); severe wind risk, 99% chance of damaging wind over 30y; extreme-heat days projected 7→27/yr by 2055 (HVAC capex compounding) — expect insurance premiums to compound above CPI over the hold.
Questions for the listing agent
- Built in 1974 — when were the roof, HVAC, electrical panel, plumbing, and water heater last replaced?
- What's the actual annual flood-insurance premium (NFIP or private), and is the property in a SFHA with mandatory coverage?
- Is there a deadline driving the sale (1031 exchange, divorce, estate, relocation)? That informs how much negotiation room exists.
- Schools are F-rated, which usually means shorter tenancies and higher turnover. Who's the typical renter profile here, and what's been the actual vacancy rate?
- What's the average days-on-market for RENTAL listings here right now (not sales)? A rising rental-DOM trend means longer vacancies and softer asking-rent achievability than the comps imply.
- What's the recent tenant-quality profile in this submarket — average credit score on applications, eviction rate, late-payment / NSF rate, and stable-employment percentage? A property-management company in the area should have these aggregated.
- How much new for-sale + rental construction is in the pipeline within 1–3 miles? Heavy new supply typically softens prices + rents 12–24 months out; constrained supply supports both.
Investment metrics
- 1% rule
- 1.60% ✓
- Cap rate
- 13.64%
- Cash-on-cash
- 26.22%
- DSCR
- 2.17
- GRM
- 5.2
CMA / ARV
No comps found within radius.
Projected returns pro-forma
-3.0% appreciation · 5.59% rent growth · sell at horizon
- IRR
- 16.1%
- Equity multiple
- 1.67×
- Total profit
- $60,935
- Equity at exit
- $48,459
- IRR
- 26.7%
- Equity multiple
- 3.66×
- Total profit
- $242,173
- Equity at exit
- $28,100
Cash invested: $91,000 (down + closing). Projections, not guarantees.
Landlord ↔ Tenant lean methodology
- Overall (STATE)
- 87 Strongly Landlord-Friendly
- State Florida
- 87 Strongly Landlord-Friendly · R+3
- County
- — inherits STATE
- City
- — inherits STATE
ZIP-level market 34113
- Rents YoY
- 5.6%
- Active inventory
- 598
- Price-to-rent
- 5.2×
Monthly cashflow live
- Estimated rent
- $5,184 high interval (Pro) →
- Mortgage (P&I)
- −$1,704
- Tax from tax record
- −$267 /mo · $3,206/yr
- Insurance
- −$135
- Flood insurance flood zone
- −$427 /mo · $5,118/yr
- HOA
- −$0
- Vacancy / Maint / Mgmt
- −$1,089
- Net cashflow
- $1,562
Break-even live
Sensitivity live
| Price | -10% $1,746 | -5% $1,654 | +0% $1,562 | +5% $1,470 | +10% $1,378 |
|---|---|---|---|---|---|
| Rent | -10% $1,152 | -5% $1,357 | +0% $1,562 | +5% $1,767 | +10% $1,972 |
| Rate | -1.0pp $1,726 | -0.5pp $1,645 | base $1,562 | +0.5pp $1,478 | +1.0pp $1,392 |
UW: 25.0% down · 7.5% · 30yr · 1.5% tax · 5.0% vac · 8.0% maint · 8.0% mgmt
Financing live
Cash to close
- Down payment
- $81,250
- Closing costs
- $9,750
- Reserves months
- —
- Total cash needed
- —
Loan-product check · same deal, 3 products live
Conventional
25% down · 7.5% · 30yr
- Down + closing
- —
- Monthly P&I
- —
- Monthly cashflow
- —
- DSCR
- —
- Eligible?
- —
Personal DTI + credit; lowest rate.
DSCR
20% down · 8.5% · 30yr
- Down + closing
- —
- Monthly P&I
- —
- Monthly cashflow
- —
- DSCR
- —
- Eligible?
- —
No personal income docs; deal must DSCR.
Hard money
10% down · 12.0% · 12mo
- Down + closing
- —
- Monthly P&I
- —
- Monthly cashflow
- —
- DSCR
- —
- Eligible?
- —
Short-term bridge; refi at stabilization.
Rent comps 40 comps
| Address | Beds | Baths | Sqft | Rent | $/sqft | DOM | Units | Dist |
|---|---|---|---|---|---|---|---|---|
| 5293 Dixie Dr Unit 1546039P Naples, FL | 2.0 | 2.0 | 1130 | $1,561 | $1.38 | 15d | 1 | 0.62mi |
| 248 Pebble Beach Cir Unit G201 Naples, FL | 2.0 | 2.0 | 1163 | $2,300 | $1.98 | 25d | 1 | 0.64mi |
| 9510 Avellino Way #1926 Naples, FL | 3.0 | 2.0 | 1454 | $8,000 | $5.50 | 25d | 1 | 0.66mi |
| 9509 Avellino Way Naples, FL | 2.0 | 2.0 | 1434 | $7,350 | $5.13 | 15d | 2 | 0.66mi |
| 9509 Avellino Way #1815 Naples, FL | 2.0 | 2.0 | 1454 | $7,500 | $5.16 | 25d | 1 | 0.67mi |
| 332 Bradstrom Cir #201 Naples, FL | 2.0 | 2.0 | 1257 | $2,200 | $1.75 | 25d | 1 | 0.67mi |
| 5385 Treetops Dr Unit I Naples, FL | 2.0 | 2.0 | 865 | $1,800 | $2.08 | 25d | 1 | 0.67mi |
| 5324 Treetops Dr Unit G-2 Naples, FL | 2.0 | 2.0 | 878 | $1,800 | $2.05 | 15d | 1 | 0.67mi |
| 5379 Treetops Dr Unit M203 Naples, FL | 2.0 | 2.0 | 950 | $1,700 | $1.79 | 25d | 1 | 0.68mi |
| 5395 Treetops Dr Unit I Naples, FL | 2.0 | 2.0 | 865 | $1,800 | $2.08 | 25d | 1 | 0.68mi |
| 5300 Treetops Dr Unit I206 Naples, FL | 2.0 | 2.0 | 878 | $1,850 | $2.11 | 25d | 1 | 0.69mi |
| 5294 Treetops Dr Unit I203 Naples, FL | 2.0 | 2.0 | 866 | $1,600 | $1.85 | 15d | 1 | 0.69mi |
| 5361 Treetops Dr Naples, FL | 2.0 | 2.0 | 806 | $1,600 | $1.99 | 23d | 1 | 0.69mi |
| 5254 Treetops Dr Naples, FL | 2.0 | 2.0 | 878 | $1,700 | $1.94 | 25d | 1 | 0.69mi |
| 5300 Treetops Dr Unit 206 Naples, FL | 2.0 | 2.0 | 866 | $1,750 | $2.02 | 25d | 1 | 0.69mi |
| 9514 Avellino Way Naples, FL | 2.0 | 2.0 | 1467 | $4,850 | $3.30 | 25d | 2 | 0.71mi |
| 5339 Treetops Dr Unit 5339 Naples, FL | 2.0 | 2.0 | 806 | $2,250 | $2.79 | 25d | 1 | 0.71mi |
| 326 Bradstrom Cir Unit 103F Naples, FL | 2.0 | 2.0 | 1113 | $1,800 | $1.62 | 25d | 1 | 0.72mi |
| 326 Bradstrom Cir Unit 204F Naples, FL | 3.0 | 2.0 | 1200 | $3,500 | $2.92 | 25d | 1 | 0.72mi |
| 9513 Avellino Way #2024 Naples, FL | 2.0 | 2.0 | 1454 | $7,000 | $4.81 | 25d | 1 | 0.72mi |
| 7162 Saona Ct Naples, FL | 2.0 | 2.0 | 1482 | $9,000 | $6.07 | 25d | 1 | 0.72mi |
| 5296 Treetops Dr Unit 5296 Naples, FL | 2.0 | 2.0 | 866 | $1,495 | $1.73 | 25d | 1 | 0.74mi |
| 9518 Avellino Way #2313 Naples, FL | 2.0 | 2.0 | 1454 | $7,500 | $5.16 | 23d | 1 | 0.74mi |
| 7124 Saona Ct Naples, FL | 2.0 | 2.0 | 1387 | $8,000 | $5.77 | 25d | 1 | 0.75mi |
| 9517 Avellino Way #2214 Naples, FL | 2.0 | 2.0 | 1454 | $7,000 | $4.81 | 25d | 1 | 0.76mi |
| 7242 Saona Ct Naples, FL | 2.0 | 2.0 | 1204 | $7,750 | $6.44 | 25d | 1 | 0.78mi |
| 7213 Saona Ct Naples, FL | 2.0 | 2.0 | 1308 | $7,500 | $5.73 | 25d | 1 | 0.79mi |
| 7197 Saona Ct Unit 1545994P Naples, FL | 2.0 | 2.0 | 1291 | $4,152 | $3.22 | 15d | 1 | 0.79mi |
| 7286 Saona Ct Naples, FL | 2.0 | 2.0 | 1205 | $10,000 | $8.30 | 25d | 1 | 0.80mi |
| 9572 Trevi Ct Naples, FL | 2.0 | 2.0 | 1213 | $7,475 | $6.16 | 25d | 3 | 0.80mi |
| 9521 Avellino Way Naples, FL | 2.0 | 2.0 | 1467 | $5,000 | $3.41 | 25d | 3 | 0.80mi |
| 7110 Cayo Coco Ln Naples, FL | 2.0 | 2.0 | 1387 | $9,250 | $6.67 | 25d | 1 | 0.82mi |
| 7138 Cayo Coco Ln Naples, FL | 2.0 | 2.0 | 1205 | $6,500 | $5.39 | 25d | 1 | 0.82mi |
| 7289 Saona Ct Naples, FL | 2.0 | 2.0 | 1411 | $10,000 | $7.09 | 25d | 1 | 0.83mi |
| 7142 Cayo Coco Ln Naples, FL | 2.0 | 2.0 | 1490 | $10,000 | $6.71 | 25d | 1 | 0.83mi |
| 315 Saint Andrews Blvd Unit A25 Naples, FL | 2.0 | 2.0 | 1126 | $1,530 | $1.36 | 25d | 1 | 0.83mi |
| 9554 Trevi Ct Naples, FL | 2.0 | 2.0 | 1213 | $4,250 | $3.50 | 23d | 2 | 0.84mi |
| 9719 Acqua Ct Naples, FL | 2.0 | 2.0 | 1374 | $5,200 | $3.78 | 25d | 2 | 0.84mi |
| 9727 Acqua Ct Naples, FL | 2.0 | 2.0 | 1301 | $6,625 | $5.09 | 15d | 5 | 0.85mi |
| 7204 Cayo Coco Ln Naples, FL | 2.0 | 2.0 | 1308 | $7,500 | $5.73 | 25d | 1 | 0.85mi |
Listing history 4 events
-
2026-06-21days on market $325,000 Active 5 DOM
-
2026-06-18days on market $325,000 Active 2 DOM
-
2026-06-16remarks 699-char remark
-
2026-06-16$325,000 Active 1 DOM
ⓘ Source: listings_history table (triggers on properties + properties_extension) + one-shot
backfill from property_details.listing_events for pre-trigger history.
Tax reassessment forecast FL · Resets to sale price
- Current annual tax
- $3,206 · $267/mo
- Projected year-2 tax
- $3,206 · $267/mo
- Expected delta
- $0/yr ($0/mo · 0.0%)
ⓘ Screening estimate from a state-policy table — verify with the county assessor before closing.
Climate risk First Street
- Flood 9/10 Extreme FEMA zone AE · 99% chance over 30 yrs
- Wildfire 3/10 Moderate
- Heat 10/10 Extreme 7 d/yr ≥107°F today · 27 d/yr by 30 yrs out
- Wind 10/10 Extreme 99% chance of damaging wind over 30 yrs
- Air quality 2/10 Low 2 unhealthy d/yr today · 2 by 30 yrs out
Nearby sold comps map
Loading sold comps map…
Walkable amenities ~0.75 mi
Loading nearby amenities…
Taxation est. · year 1
- Rental income
- $62,210
- − Mortgage interest
- −$18,205
- − Property taxes
- −$3,206
- − Insurance
- −$6,744
- − Repairs & maintenance
- −$4,977
- − Management
- −$4,977
- − Depreciation
- −$9,455
- Taxable income
- $14,647
- Est. tax owed @ 24.0%
- −$3,515
- After-tax cash flow
- $15,229/yr
For passive investors: Depreciation is non-cash, so a rental often shows a tax loss while cash-flowing — sheltering income. Rental losses are passive: they offset passive income freely, and up to $25,000/yr can offset ordinary (W-2) income if you actively participate and your MAGI is under $100k (phasing out to $0 by $150k); unused losses carry forward. On sale, claimed depreciation is recaptured at up to 25%, and gains may owe capital-gains tax (a 1031 exchange can defer both). Figures are a year-1 estimate at your 24.0% rate — not tax advice; consult a CPA.
Schools (NCES district)
- District
- Collier
- NCES district ID
- 1200330
- Math proficiency
- 60% ▼ -4.00%
- Reading proficiency
- 56% ▼ -2.00%
- Median HH income
- $58,275
- Composite
- 50.23/100
- National rank
- #1892
- State rank
- #16 of 73 in FL
Livability — Naples Manor
- Score
- 66/100
- State rank
- #615
- US rank
- #11875
Category grades
Schools grade is shown separately in the Schools card above.
Census & demographics
- County
- Collier County · 396,295 people
- Metro
- Naples-Marco Island, FL
- Population (ZIP)
- 26,056
- Household income
- $81,674
- Rent vs Own
- Severe rent burden
- 954.0
Population outlook (Collier County) Hauer SSP2
- Today (2025)
- 420,858 people
- By 2030
- 450,054 · +6.9%
- By 2040
- 502,232 · +19.3%
- By 2050
- 544,932 · +29.5%
- By 2075
- 627,203 · +49.0%
- By 2100
- 659,015 · +56.6%
Race, ethnicity, and origin ACS 2023
- Neighborhood character
- Diverse neighborhood (Simpson 0.59)
- Race & ethnicity
- White 56% Hispanic / Latino 28% Black 12% Two or more races 11% Asian 2%
- Hispanic origin (detail)
- Mexican 17% Puerto Rican 3% Cuban 2%
- Common ancestry
- Hispanic 10% Romanian 3% Lithuanian 2%
- Foreign-born
- 26% · Canada, Jamaica, Vietnam
- Languages at home
- 63% English-only · Spanish 24% French/Haitian/Cajun 9% Other Indo-European 2%
Political lean MEDSL · Collier
- 2024 margin
- Solid R (+33.1) · D 33.1% · R 66.2%
- 2008→2024 swing
- -10.6pp toward R · 2008: -22.5pp · 2024: -33.1pp
- All cycles
- 2024: R+33.1 2020: R+24.7 2016: R+26.0 2012: R+30.1 2008: R+22.5
Not yet ingested
- Civics
- —
Market trends
- HPI YoY
- ▼ -194.86%
- Current HPI
- 279.4232
- Rent YoY
- ▲ 5.59%
- Metro
- Naples-Marco Island, FL
- State GDP YoY
- ▲ 3.28%
- F500 in state
- 36
Industry mix (Fortune 500 HQ in FL)
| Industry | F500 HQs | Revenue |
|---|---|---|
| Industrial Technology | 2 | $29B |
|
||
| Insurance | 2 | $17B |
|
||
| Retail | 1 | $60B |
|
||
| Technology Distribution | 1 | $58B |
|
||
| Homebuilding | 1 | $35B |
|
||
| Technology Manufacturing | 1 | $35B |
|
||
Price history
+1525.0% since first listed16 events — show timeline
- 2026-06-16 Listed $325,000 Stellar MLS as Distributed by MLS Grid
- 2017-01-14 Price Changed $225,000 NAPLESMLS
- 2016-12-13 Sold (Public Records) $229,000 Public Records
- 2016-11-30 Price Changed $229,900 NAPLESMLS
- 2016-11-30 Sold (MLS) $225,000 NAPLESMLS
- 2016-11-04 Pending — NAPLESMLS
- 2016-10-27 Price Changed $229,900 NAPLESMLS
- 2016-10-20 Price Changed $234,900 NAPLESMLS
- 2016-10-17 Listed $239,900 NAPLESMLS
- 2014-03-28 Price Changed $75,000 FORTMLS
- 2014-03-28 Sold (MLS) $47,500 FORTMLS
- 2014-03-03 Listed $47,500 FORTMLS
- 2009-04-23 Listing Removed — NAPLESMLS
- 2007-05-21 Listed $168,000 NAPLESMLS
- 2003-09-24 Sold (Public Records) $100,000 Public Records
- 1984-01-01 Sold (Public Records) $20,000 Public Records
Property tax history
+14.2%/yrLatest (2025): $3,206 · +22.7% YoY. Source: county tax records.
Cash-flow waterfall
monthlySold comps — $/sqft
last 12 mo · ≤1 miLoading sold comps…