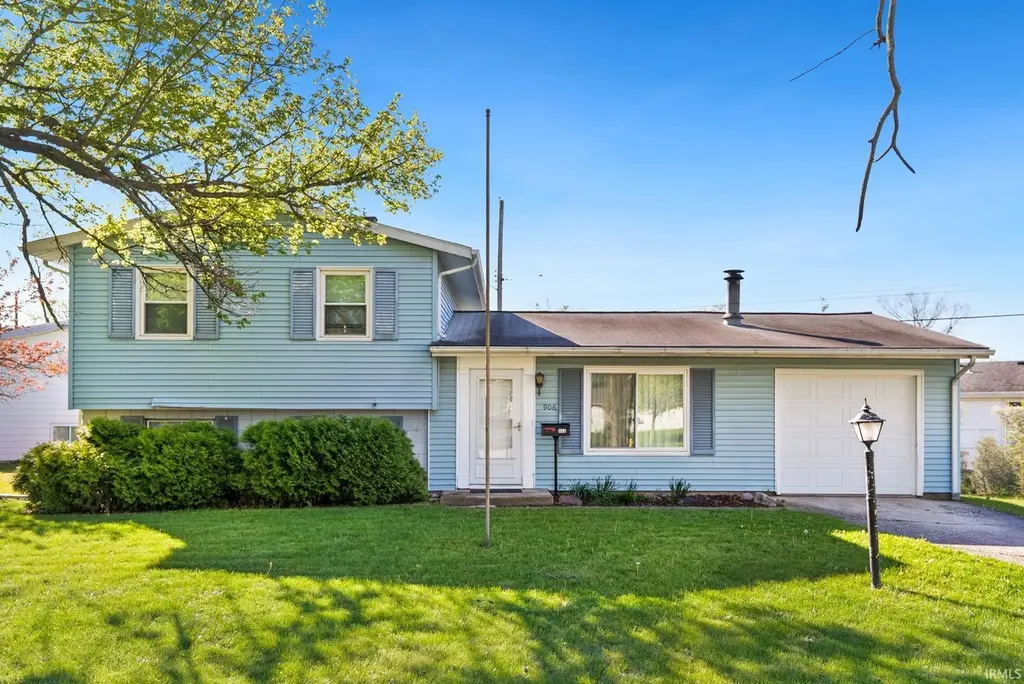
906 Buckingham Dr · Fort Wayne, IN
Flood risk 1/10 · Minimal
- FEMA flood zone
- X (unshaded)
- Chance of flooding over 30 yrs
- 0.0%
- Est. flood insurance / yr
- $507 – $1,088
Fire risk 1/10 · Minimal
- Est. fire insurance / yr
- $717 – $1,331
Heat risk 3/10 · Minor
- Hot days now (above 100°F)
- 7 days/yr
- Hot days in 30 yrs
- 17 days/yr
Wind risk 2/10 · Minimal
- Chance of severe wind over 30 yrs
- —
Air-quality risk 3/10 · Minor
- Unhealthy air days now
- 2 days/yr
- Unhealthy air days in 30 yrs
- 3 days/yr
Risk factors via First Street. Map © Google.
Why this score? — see what drove the C+ grade
The composite is a weighted blend of 9 inputs, each scored 0–100. Each bar is that input's sub-score; the figure is the points it added to the 100-point composite (weight × sub-score).
- Cash flow +21.6/30.0
- ARV discount +15.0/15.0
- DSCR +6.9/10.0
- 1% rule +5.1/10.0
- Livability +4.2/5.0
- Rent growth +2.7/5.0
- Condition / age +2.5/5.0
- Schools +2.2/10.0
- Appreciation +0.0/10.0
$150,000
🖨 Deal sheet 📄 Offer letter ✓ Due diligence
Listing remarks
This tri-level home presents a fantastic opportunity for some sweat equity and customization. The cozy family room features a wood-burning fireplace, creating a warm and inviting space for gatherings. Adjacent to the family room, the dining area and kitchen offer ample potential for modern updates. Upstairs, you'll find three bedrooms, with indications that hardwood flooring lies beneath the carpet in all rooms. A full bathroom serves the upper level, providing convenience for daily routines. The lower level includes a second living space and a laundry room, perfect for additional relaxation or functional needs. The existing half bath can be easily converted into a second full bathroom, add
Key facts
- Private backyard
- Storage shed
- Updated furnace
Tags
Neighborhood map
What this means for you Summary
Snapshot
- This is a 3-bed/1.5-bath single-family listed at $150k.
Deal economics
- At list price, monthly cash flow is $227 ($3k/yr) — positive.
- The deal already cash-flows at list — no discount required.
- Meets the 1% rule at list price ($2k rent vs $150k).
- Cap rate 8.1% vs local median 4.8% in Fort Wayne — top-decile yield for the area; either an underpriced asset or a hidden risk that comps aren't pricing in. Stress-test before assuming the spread holds.
Location & tenants
- Location reads 84/100 on livability (#6 in IN, #676 nationally) — a professional / high-income tenant draw. Strengths: amenities A+, commute A+, cost of living A+; Watch: crime C-, employment D+.
- Fort Wayne Community Schools (urban): math 22% / reading 29% proficiency, ranked #263 of 301 in IN (top 87%) — low school quality limits family demand, transient renter base, plan for 1-2y turnover; 60% free/reduced lunch — lower-income household profile, screen leases tightly.
- Zoned schools: Northcrest Elementary School (math 17% / reading 17%, grade F, #837 of 994 statewide, top 86%, 493 students, 71% FRL); Northwood Middle School (math 14% / reading 22%, grade F, #279 of 330 statewide, top 86%, 587 students, 70% FRL); North Side High School (math 19% / reading 51%, grade F, #266 of 369 statewide, top 73%, 1,474 students, 66% FRL).
- Market conditions: Rents flat; 108 active listings in the ZIP; 6 comparable units currently listed for rent nearby; rentals at typical pace (median 21d on market — plan ~3-4 weeks tenant-placement turnaround); 1,861 units permitted in Allen County in 2024 (576 in 5+ unit buildings).
Forward outlook
- Local home prices are declining (-3.0%/yr); year-one equity from $1k of loan paydown is wiped out by about $4k of value loss. Plan a longer hold.
- Allen County population projected at +10% by 2050 — modest demand growth; plan on rents tracking national, not racing it.
Negotiation context
- Only 2 days on market — expect competitive offers; lowballing is unlikely to land.
Questions for the listing agent
- Built in 1962 — when were the roof, HVAC, electrical panel, plumbing, and water heater last replaced?
- What does the HOA fee cover, when was the last increase, and are there any pending special assessments or reserve-fund shortfalls?
- Is there a deadline driving the sale (1031 exchange, divorce, estate, relocation)? That informs how much negotiation room exists.
- Schools are D-rated, which usually means shorter tenancies and higher turnover. Who's the typical renter profile here, and what's been the actual vacancy rate?
- What's the average days-on-market for RENTAL listings here right now (not sales)? A rising rental-DOM trend means longer vacancies and softer asking-rent achievability than the comps imply.
- What's the recent tenant-quality profile in this submarket — average credit score on applications, eviction rate, late-payment / NSF rate, and stable-employment percentage? A property-management company in the area should have these aggregated.
- How much new for-sale + rental construction is in the pipeline within 1–3 miles? Heavy new supply typically softens prices + rents 12–24 months out; constrained supply supports both.
Investment metrics
- 1% rule
- 1.01% ✓
- Cap rate
- 8.11%
- Cash-on-cash
- 6.48%
- DSCR
- 1.29
- GRM
- 8.2
CMA / ARV
- ARV (on-the-fly)
- $199,318
- Comps found
- 12
Show comp detail 12 sales within ~0.75 mi
| Address | Dist | Beds/Ba | Sqft | Sold | Price | $/sf | Match |
|---|---|---|---|---|---|---|---|
| 701 N Camden Dr | 0.33mi | 3/1.0 | 1,295 (+5%) | 5mo | $189,900 | $147 | 71 |
| 6708 Raintree Rd | 0.58mi | 3/1.0 | 1,197 (-3%) | 2mo | $206,000 | $172 | 64 |
| 1130 Larch Ln | 0.28mi | 3/1.0 | 1,356 (+10%) | 6mo | $186,400 | $137 | 64 |
| 6319 High Point Run | 0.31mi | 3/2.0 | 1,094 (-12%) | 1mo | $212,000 | $194 | 63 |
| 815 Larch Ln | 0.20mi | 3/1.5 | 1,056 (-15%) | 4mo | $182,900 | $173 | 63 |
| 5235 Northcrest Dr | 0.47mi | 3/1.5 | 1,160 (-6%) | 9mo | $175,000 | $151 | 60 |
| 816 Warwick Ave | 0.68mi | 3/1.5 | 1,189 (-4%) | 8mo | $183,000 | $154 | 55 |
| 6608 Baytree Dr | 0.65mi | 3/1.5 | 1,305 (+5%) | 7mo | $199,150 | $153 | 55 |
| 1403 Sycamore Dr | 0.65mi | 3/1.5 | 1,305 (+5%) | 9mo | $216,000 | $166 | 53 |
| 5418 N Stony Run Ln | 0.35mi | 3/1.0 | 1,073 (-13%) | 10mo | $173,000 | $161 | 52 |
| 6523 Meadow Wood Pl | 0.38mi | 3/1.5 | 1,052 (-15%) | 7mo | $199,900 | $190 | 52 |
| 6509 Redbud Dr | 0.57mi | 4/1.0 (+1) | 1,305 (+5%) | 9mo | $199,000 | $152 | 50 |
Match score weights: distance 35% · size 25% · config 20% · recency 20%. Top-matched comps best support the ARV.
Projected returns pro-forma
-3.0% appreciation · 0.81% rent growth · sell at horizon
- IRR
- -8.7%
- Equity multiple
- 0.69×
- Total profit
- $-13,163
- Equity at exit
- $22,365
- IRR
- -2.3%
- Equity multiple
- 0.86×
- Total profit
- $-5,805
- Equity at exit
- $12,969
Cash invested: $42,000 (down + closing). Projections, not guarantees.
Landlord ↔ Tenant lean methodology
- Overall (STATE)
- 90 Strongly Landlord-Friendly
- State Indiana
- 90 Strongly Landlord-Friendly · R+11
- County
- — inherits STATE
- City
- — inherits STATE
ZIP-level market 46825
- Rents YoY
- 0.8%
- Active inventory
- 108
- Price-to-rent
- 8.2×
Monthly cashflow live
- Estimated rent
- $1,519 high interval (Pro) →
- Mortgage (P&I)
- −$787
- Tax from tax record
- −$122 /mo · $1,470/yr
- Insurance
- −$62
- HOA
- −$2
- Vacancy / Maint / Mgmt
- −$319
- Net cashflow
- $227
Break-even live
UW: 25.0% down · 7.5% · 30yr · 1.5% tax · 5.0% vac · 8.0% maint · 8.0% mgmt
Financing live
Cash to close
- Down payment
- $37,500
- Closing costs
- $4,500
- Reserves months
- —
- Total cash needed
- —
Loan-product check · same deal, 3 products live
Conventional
25% down · 7.5% · 30yr
- Down + closing
- —
- Monthly P&I
- —
- Monthly cashflow
- —
- DSCR
- —
- Eligible?
- —
Personal DTI + credit; lowest rate.
DSCR
20% down · 8.5% · 30yr
- Down + closing
- —
- Monthly P&I
- —
- Monthly cashflow
- —
- DSCR
- —
- Eligible?
- —
No personal income docs; deal must DSCR.
Hard money
10% down · 12.0% · 12mo
- Down + closing
- —
- Monthly P&I
- —
- Monthly cashflow
- —
- DSCR
- —
- Eligible?
- —
Short-term bridge; refi at stabilization.
Rent comps 6 comps
| Address | Beds | Baths | Sqft | Rent | $/sqft | DOM | Units | Dist |
|---|---|---|---|---|---|---|---|---|
| 4917 Northcrest Dr Apt C Fort Wayne, IN | 2.0 | 1.0 | 800 | $925 | $1.16 | 21d | 1 | 0.76mi |
| 4917 Northcrest Dr Apt B Fort Wayne, IN | 2.0 | 1.0 | 800 | $975 | $1.22 | 43d | 1 | 0.76mi |
| 5710 River Run Trl Fort Wayne, IN | 1.0–3.0 | 1.0–2.0 | 937 | $1,670 | $1.78 | 13d | 37 | 0.89mi |
| 2306 Deerwood Dr Fort Wayne, IN | 3.0 | 1.5 | 1456 | $1,595 | $1.10 | 21d | 1 | 1.22mi |
| 2727 Canterbury Blvd Fort Wayne, IN | 1.0–3.0 | 1.0–2.5 | 1204 | $2,000 | $1.66 | 13d | 394 | 1.43mi |
| 1035 Ridgewood Dr Fort Wayne, IN | 1.0–3.0 | 1.0–1.5 | 906 | $1,450 | $1.60 | 13d | 33 | 1.48mi |
HOA detail
- Monthly dues
- $2 · $24/yr
Listing history 2 events
-
2026-04-23status Pending
-
2026-04-21$150,000 Active
ⓘ Source: listings_history table (triggers on properties + properties_extension) + one-shot
backfill from property_details.listing_events for pre-trigger history.
Tax reassessment forecast IN · Partial reset (capped growth)
- Current annual tax
- $1,470 · $122/mo
- Projected year-2 tax
- $1,470 · $122/mo
- Expected delta
- $0/yr ($0/mo · 0.0%)
ⓘ Screening estimate from a state-policy table — verify with the county assessor before closing.
Climate risk First Street
- Flood 1/10 Low FEMA zone X (unshaded) · 0% chance over 30 yrs
- Wildfire 1/10 Low
- Heat 3/10 Moderate 7 d/yr ≥100°F today · 17 d/yr by 30 yrs out
- Wind 2/10 Low
- Air quality 3/10 Moderate 2 unhealthy d/yr today · 3 by 30 yrs out
Nearby sold comps map
Loading sold comps map…
Walkable amenities ~0.75 mi
Loading nearby amenities…
Taxation est. · year 1
- Rental income
- $18,232
- − Mortgage interest
- −$8,402
- − Property taxes
- −$1,470
- − Insurance
- −$750
- − Repairs & maintenance
- −$1,459
- − Management
- −$1,459
- − HOA
- −$24
- − Depreciation
- −$4,364
- Taxable income
- $305
- Est. tax owed @ 24.0%
- −$73
- After-tax cash flow
- $2,647/yr
For passive investors: Depreciation is non-cash, so a rental often shows a tax loss while cash-flowing — sheltering income. Rental losses are passive: they offset passive income freely, and up to $25,000/yr can offset ordinary (W-2) income if you actively participate and your MAGI is under $100k (phasing out to $0 by $150k); unused losses carry forward. On sale, claimed depreciation is recaptured at up to 25%, and gains may owe capital-gains tax (a 1031 exchange can defer both). Figures are a year-1 estimate at your 24.0% rate — not tax advice; consult a CPA.
Schools (NCES district)
- District
- Fort Wayne Community Schools
- NCES district ID
- 1803630
- Math proficiency
- 22% ▼ -11.00%
- Reading proficiency
- 29% ▼ -7.00%
- Median HH income
- $41,951
- Composite
- 21.68/100
- National rank
- #8275
- State rank
- #263 of 301 in IN
Livability — Fort Wayne
- Score
- 84/100
- State rank
- #6
- US rank
- #676
Category grades
Schools grade is shown separately in the Schools card above.
Census & demographics
- Census place
- Fort Wayne, IN
- County
- Allen County · 326,813 people
- City population
- 326,813
- Metro
- Fort Wayne, IN
- Population (ZIP)
- 29,296
- Household income
- $70,544
- Rent vs Own
- Severe rent burden
- 752.0
Population outlook (Allen County) Hauer SSP2
- Today (2025)
- 394,020 people
- By 2030
- 405,128 · +2.8%
- By 2040
- 423,476 · +7.5%
- By 2050
- 435,137 · +10.4%
- By 2075
- 450,293 · +14.3%
- By 2100
- 424,101 · +7.6%
Race, ethnicity, and origin ACS 2023
- Neighborhood character
- Predominantly White (71%)
- Race & ethnicity
- White 71% Black 10% Asian 10% Hispanic / Latino 6% Two or more races 6%
- Hispanic origin (detail)
- Mexican 3% Puerto Rican 2%
- Common ancestry
- Italian 4% Lithuanian 3% Romanian 3%
- Foreign-born
- 12% · Philippines, Canada, Vietnam
- Languages at home
- 85% English-only · Spanish 4% Other Asian/Pacific 3% Vietnamese 3%
Political lean MEDSL · Allen
- 2024 margin
- R (+12.5) · D 42.9% · R 55.4% · Other 1.7%
- 2008→2024 swing
- -8.1pp toward R · 2008: -4.3pp · 2024: -12.5pp
- All cycles
- 2024: R+12.5 2020: R+11.2 2016: R+19.6 2012: R+16.8 2008: R+4.3
Not yet ingested
- Civics
- —
Market trends
- HPI YoY
- ▼ -187.64%
- Current HPI
- 238.2276
- Rent YoY
- ▲ 0.81%
- Metro
- Fort Wayne, IN
- State GDP YoY
- ▲ 2.90%
- F500 in state
- 18
Industry mix (Fortune 500 HQ in IN)
| Industry | F500 HQs | Revenue |
|---|---|---|
| Industrial Machinery | 2 | $37B |
|
||
| Healthcare | 1 | $177B |
|
||
| Pharmaceuticals | 1 | $45B |
|
||
| Metals / Steel | 1 | $18B |
|
||
| Agriculture | 1 | $17B |
|
||
| Packaging | 1 | $12B |
|
||
Price history
2 events — show timeline
- 2026-04-23 Pending — IRMLS
- 2026-04-21 Listed $150,000 IRMLS
Property tax history
+28.6%/yrLatest (2024): $1,470 · +1395.0% YoY. Source: county tax records.
Cash-flow waterfall
monthlySold comps — $/sqft
last 12 mo · ≤1 miLoading sold comps…