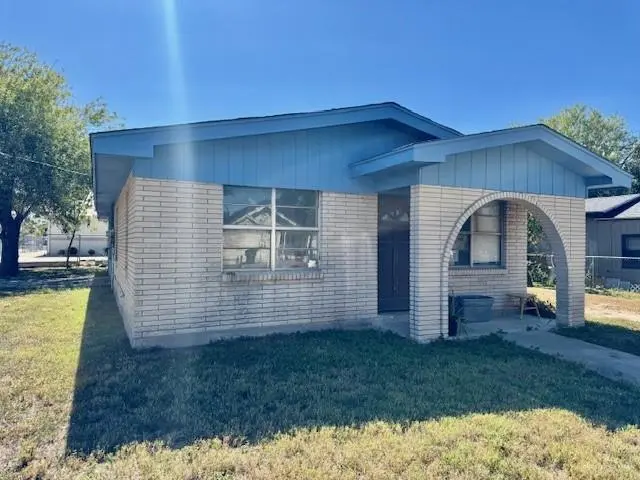
214 E Southern Ave · Edcouch, TX
Flood risk 3/10 · Minor
- FEMA flood zone
- —
- Chance of flooding over 30 yrs
- 0.17%
- Est. flood insurance / yr
- —
Fire risk 2/10 · Minimal
- Est. fire insurance / yr
- $1,222 – $2,270
Heat risk 9/10 · Severe
- Hot days now (above 111°F)
- 7 days/yr
- Hot days in 30 yrs
- 23 days/yr
Wind risk 8/10 · Major
- Chance of severe wind over 30 yrs
- 99.0%
Air-quality risk 1/10 · Minimal
- Unhealthy air days now
- 0 days/yr
- Unhealthy air days in 30 yrs
- 0 days/yr
Risk factors via First Street. Map © Google.
Why this score? — see what drove the C+ grade
The composite is a weighted blend of 9 inputs, each scored 0–100. Each bar is that input's sub-score; the figure is the points it added to the 100-point composite (weight × sub-score).
- Cash flow +23.4/30.0
- DSCR +7.5/10.0
- Appreciation +7.4/10.0
- ARV discount +6.9/15.0
- 1% rule +6.1/10.0
- Livability +3.5/5.0
- Condition / age +2.8/5.0
- Rent growth +2.5/5.0
- Schools +1.1/10.0
$125,000
🖨 Deal sheet 📄 Offer letter ✓ Due diligence
Listing remarks MLS
Discover the potential in this updated 4-bedroom home featuring 1 full bath and 1 bathroom ready for your finishing touches, offering the opportunity to customize it to your style. Perfect for investors or families looking to complete the home to their liking, this property offers ample potential to add value. Situated on a spacious corner lot, the home provides plenty of outdoor space and is conveniently located near local amenities, schools, and shopping. Don’t miss the chance to transform this property into the perfect home or investment.
Key facts
- Spacious corner lot
- Updated home
- Outdoor space
Tags
Neighborhood map
What this means for you Summary
Snapshot
- This is a 4-bed/1.0-bath single-family listed at $125k. Condition is rated average.
Deal economics
- At list price, monthly cash flow is $231 ($3k/yr) — positive.
- The deal already cash-flows at list — no discount required.
- Meets the 1% rule at list price ($1k rent vs $125k).
- Recommended offer: $110k (12.0% below list) — sets the bar for market timing.
Location & tenants
- Location reads 69/100 on livability (#413 in TX) — a middle-class / working-renter tenant base. Strengths: crime A+, cost of living A+, housing A+; Watch: schools F, amenities F, commute F.
- Edcouch-Elsa ISD (suburban): math 9% / reading 20% proficiency, ranked #822 of 826 in TX (top 100%) — low school quality limits family demand, transient renter base, plan for 1-2y turnover; 74% free/reduced lunch — lower-income household profile, screen leases tightly.
- Market conditions: 40 active listings in the ZIP; 7,378 units permitted in Hidalgo County in 2024 (641 in 5+ unit buildings).
Forward outlook
- In year one you build about $7k of equity ($864 loan paydown + $6k appreciation (4.8% local appreciation)).
- Hidalgo County population projected at +28% by 2050 — long-run rental-demand tailwind backs the buy-and-hold thesis.
- At projected returns (4.8% appreciation + 3.0% rent growth), your $35k cash investment doubles in ~4 years — after that, you're playing with house money.
- By year 6, paydown + projected appreciation supports a ~$37k cash-out refi (75% LTV) — recoverable capital for the next deal without selling this one.
Negotiation context
- It's been on market 210 days — a 12% lower offer ($110k) is reasonable based on typical stale-listing flexibility.
Risks & watch-outs
- Climate carrying-cost: severe wind risk, 99% chance of damaging wind over 30y; extreme-heat days projected 7→23/yr by 2055 (HVAC capex compounding) — expect insurance premiums to compound above CPI over the hold.
Questions for the listing agent
- It's been on market 210 days. Have you received any prior offers? Is the seller open to a 12% concession, seller financing, or rate buy-down credit?
- Built in 1965 — when were the roof, HVAC, electrical panel, plumbing, and water heater last replaced?
- Why hasn't it sold? Are there any deal-killer items the seller is aware of (foundation, flood, title, zoning, code violations)?
- Is there a deadline driving the sale (1031 exchange, divorce, estate, relocation)? That informs how much negotiation room exists.
- Schools are F-rated, which usually means shorter tenancies and higher turnover. Who's the typical renter profile here, and what's been the actual vacancy rate?
- What's the average days-on-market for RENTAL listings here right now (not sales)? A rising rental-DOM trend means longer vacancies and softer asking-rent achievability than the comps imply.
- What's the recent tenant-quality profile in this submarket — average credit score on applications, eviction rate, late-payment / NSF rate, and stable-employment percentage? A property-management company in the area should have these aggregated.
- How much new for-sale + rental construction is in the pipeline within 1–3 miles? Heavy new supply typically softens prices + rents 12–24 months out; constrained supply supports both.
Investment metrics
- 1% rule
- 1.11% ✓
- Cap rate
- 8.51%
- Cash-on-cash
- 7.93%
- DSCR
- 1.35
- GRM
- 7.5
CMA / ARV
- ARV (median comp)
- $123,458
- List price
- $125,000
- Delta
- 1.25%
- Verdict
- FAIR
- Comps
- 14 within 1.0 mi
Show comp detail 5 sales within ~0.75 mi
| Address | Dist | Beds/Ba | Sqft | Sold | Price | $/sf | Match |
|---|---|---|---|---|---|---|---|
| 121 Lenon St | 0.36mi | 3/2.0 (-1) | 1,384 (-1%) | 1mo | $199,000 | $144 | 72 |
| 117 Lenon Ave | 0.36mi | 3/2.0 (-1) | 1,457 (+4%) | 4mo | $195,000 | $134 | 64 |
| 105 Lenon St | 0.38mi | 3/2.0 (-1) | 1,455 (+4%) | 4mo | $199,000 | $137 | 63 |
| 109 Lenon St | 0.36mi | 3/2.0 (-1) | 1,483 (+6%) | 8mo | $210,000 | $142 | 58 |
| 105 S Lackland St | 0.45mi | 3/2.0 (-1) | 1,344 (-4%) | 19mo | $139,999 | $104 | 48 |
Match score weights: distance 35% · size 25% · config 20% · recency 20%. Top-matched comps best support the ARV.
Projected returns pro-forma
4.77% appreciation · 3.0% rent growth · sell at horizon
- IRR
- 19.2%
- Equity multiple
- 2.20×
- Total profit
- $41,932
- Equity at exit
- $69,110
- IRR
- 19.2%
- Equity multiple
- 4.28×
- Total profit
- $114,883
- Equity at exit
- $117,871
Cash invested: $35,000 (down + closing). Projections, not guarantees.
Landlord ↔ Tenant lean methodology
- Overall (STATE)
- 87 Strongly Landlord-Friendly
- State Texas
- 87 Strongly Landlord-Friendly · R+5
- County
- — inherits STATE
- City
- — inherits STATE
ZIP-level market 78543
- Home prices YoY
- 1.9%
- Active inventory
- 40
- Price-to-rent
- 7.5×
Monthly cashflow live
- Estimated rent
- $1,386 medium interval (Pro) →
- Mortgage (P&I)
- −$656
- Tax est. 1.5%
- −$156 /mo · $1,875/yr
- Insurance
- −$52
- HOA
- −$0
- Vacancy / Maint / Mgmt
- −$291
- Net cashflow
- $231
Break-even live
UW: 25.0% down · 7.5% · 30yr · 1.5% tax · 5.0% vac · 8.0% maint · 8.0% mgmt
Financing live
Cash to close
- Down payment
- $31,250
- Closing costs
- $3,750
- Reserves months
- —
- Total cash needed
- —
Loan-product check · same deal, 3 products live
Conventional
25% down · 7.5% · 30yr
- Down + closing
- —
- Monthly P&I
- —
- Monthly cashflow
- —
- DSCR
- —
- Eligible?
- —
Personal DTI + credit; lowest rate.
DSCR
20% down · 8.5% · 30yr
- Down + closing
- —
- Monthly P&I
- —
- Monthly cashflow
- —
- DSCR
- —
- Eligible?
- —
No personal income docs; deal must DSCR.
Hard money
10% down · 12.0% · 12mo
- Down + closing
- —
- Monthly P&I
- —
- Monthly cashflow
- —
- DSCR
- —
- Eligible?
- —
Short-term bridge; refi at stabilization.
Listing history 15 events
-
2026-06-18days on market $125,000 Active 210 DOM
-
2026-06-17days on market $125,000 Active 209 DOM
-
2026-06-16days on market $125,000 Active 208 DOM
-
2026-06-15days on market $125,000 Active 207 DOM
-
2026-06-13days on market $125,000 Active 205 DOM
-
2026-06-12days on market $125,000 Active 204 DOM
-
2026-06-09days on market $125,000 Active 201 DOM
-
2026-06-08days on market $125,000 Active 200 DOM
-
2026-06-08days on market $125,000 Active 199 DOM
-
2026-06-07days on market $125,000 Active 198 DOM
-
2026-06-03days on market $125,000 Active 195 DOM
-
2026-06-02days on market $125,000 Active 194 DOM
-
2026-06-01days on market $125,000 Active 193 DOM
-
2026-05-31days on market $125,000 Active 192 DOM
-
2025-11-20$125,000 Active 553-char remark
Show marketing remark (553 chars)
Discover the potential in this updated 4-bedroom home featuring 1 full bath and 1 bathroom ready for your finishing touches, offering the opportunity to customize it to your style. Perfect for investors or families looking to complete the home to their liking, this property offers ample potential to add value. Situated on a spacious corner lot, the home provides plenty of outdoor space and is conveniently located near local amenities, schools, and shopping. Don’t miss the chance to transform this property into the perfect home or investment.
ⓘ Source: listings_history table (triggers on properties + properties_extension) + one-shot
backfill from property_details.listing_events for pre-trigger history.
Climate risk First Street
- Flood 3/10 Moderate 17% chance over 30 yrs
- Wildfire 2/10 Low
- Heat 9/10 Extreme 7 d/yr ≥111°F today · 23 d/yr by 30 yrs out
- Wind 8/10 Severe 99% chance of damaging wind over 30 yrs
- Air quality 1/10 Low 0 unhealthy d/yr today · 0 by 30 yrs out
Nearby sold comps map
Loading sold comps map…
Walkable amenities ~0.75 mi
Loading nearby amenities…
Taxation est. · year 1
- Rental income
- $16,633
- − Mortgage interest
- −$7,002
- − Property taxes
- −$1,875
- − Insurance
- −$625
- − Repairs & maintenance
- −$1,331
- − Management
- −$1,331
- − Depreciation
- −$3,636
- Taxable income
- $833
- Est. tax owed @ 24.0%
- −$200
- After-tax cash flow
- $2,574/yr
For passive investors: Depreciation is non-cash, so a rental often shows a tax loss while cash-flowing — sheltering income. Rental losses are passive: they offset passive income freely, and up to $25,000/yr can offset ordinary (W-2) income if you actively participate and your MAGI is under $100k (phasing out to $0 by $150k); unused losses carry forward. On sale, claimed depreciation is recaptured at up to 25%, and gains may owe capital-gains tax (a 1031 exchange can defer both). Figures are a year-1 estimate at your 24.0% rate — not tax advice; consult a CPA.
Condition & rehab AI · 12 photos
This 4-bedroom home offers significant potential for renovation and improvement, with moderate repairs and maintenance needed to enhance its resale and rental value.
Repairs flagged
- Moderate kitchen cabinets — Dated appearance
- Moderate bathroom fixtures — Appears dated
- Moderate exterior siding — Weathered appearance
Value-add opportunities
- Both Kitchen renovation — Modernizing the kitchen can significantly increase both resale and rental value.
- Both Bathroom update — Updating the bathroom can also boost both resale and rental value.
- Both Exterior paint and landscaping — Improving curb appeal can attract more buyers and renters.
- Rental HVAC system inspection and maintenance — A well-maintained HVAC system is crucial for rental properties and can attract tenants.
- Both Landscaping and curb appeal — A well-maintained and attractive exterior can increase both resale and rental value.
Renovation cost estimate screening
| Repair item | Severity | Est. cost |
|---|---|---|
| kitchen cabinets · Dated appearance | Moderate | $3,000–15,000 |
| bathroom fixtures · Appears dated | Moderate | $3,000–15,000 |
| exterior siding · Weathered appearance | Moderate | $3,000–15,000 |
| Total estimated repair cost · 3 items | $9,000–45,000 |
Value-add ROI direction
- Both Kitchen renovation — Modernizing the kitchen can significantly increase both resale and rental value. ↑
- Both Bathroom update — Updating the bathroom can also boost both resale and rental value. ↑
- Both Exterior paint and landscaping — Improving curb appeal can attract more buyers and renters. ↑
- Rental HVAC system inspection and maintenance — A well-maintained HVAC system is crucial for rental properties and can attract tenants. ↑
- Both Landscaping and curb appeal — A well-maintained and attractive exterior can increase both resale and rental value. ↑
ⓘ Cost ranges are severity-bucket heuristics (US national rule-of-thumb). Get contractor quotes + a written scope before underwriting a rehab budget.
Schools (NCES district)
- District
- Edcouch-Elsa ISD
- NCES district ID
- 4818060
- Math proficiency
- 9% ▼ -27.00%
- Reading proficiency
- 20% ▼ -13.00%
- Median HH income
- $25,724
- Composite
- 10.99/100
- National rank
- #9744
- State rank
- #822 of 826 in TX
Livability — Edcouch
- Score
- 69/100
- State rank
- #413
- US rank
- #8499
Category grades
Schools grade is shown separately in the Schools card above.
Census & demographics
- Census place
- Edcouch, TX
- Population (ZIP)
- 8,608
Population outlook (Hidalgo County) Hauer SSP2
- Today (2025)
- 955,232 people
- By 2030
- 1,009,774 · +5.7%
- By 2040
- 1,120,332 · +17.3%
- By 2050
- 1,225,036 · +28.2%
- By 2075
- 1,439,189 · +50.7%
- By 2100
- 1,533,429 · +60.5%
Race, ethnicity, and origin ACS 2023
- Neighborhood character
- Predominantly Hispanic (98%)
- Race & ethnicity
- Hispanic / Latino 98% Two or more races 56% White 2%
- Hispanic origin (detail)
- Mexican 96%
- Foreign-born
- 15% · Canada
- Languages at home
- 19% English-only · Spanish 81%
Political lean MEDSL · Hidalgo
- 2024 margin
- Toss-up / Even · D 48.1% · R 51.0%
- 2008→2024 swing
- -41.6pp toward R · 2008: 38.7pp · 2024: -2.9pp
- All cycles
- 2024: R+2.9 2020: D+17.1 2016: D+40.5 2012: D+41.8 2008: D+38.7
Not yet ingested
- Civics
- —
Market trends
- HPI YoY
- ▲ 4.77%
- Current HPI
- 250.7357
- Rent YoY
- —
- Metro
- —
- State GDP YoY
- ▲ 3.95%
- F500 in state
- 110
Industry mix (Fortune 500 HQ in TX)
| Industry | F500 HQs | Revenue |
|---|---|---|
| Energy | 16 | $1,198B |
|
||
| Technology | 5 | $198B |
|
||
| Engineering / Construction | 4 | $72B |
|
||
| Energy Services | 3 | $60B |
|
||
| Utilities | 3 | $41B |
|
||
| Healthcare | 2 | $330B |
|
||
Price history
1 event — show timeline
- 2025-11-20 Listed $125,000 MCALLENMLS
Cash-flow waterfall
monthlySold comps — $/sqft
last 12 mo · ≤1 miLoading sold comps…