4229 Woodsage Trce · Indianapolis city (balance), IN
Flood risk 1/10 · Minimal
- FEMA flood zone
- X (unshaded)
- Chance of flooding over 30 yrs
- 0.0%
- Est. flood insurance / yr
- $507 – $1,088
Fire risk 1/10 · Minimal
- Est. fire insurance / yr
- $717 – $1,331
Heat risk 3/10 · Minor
- Hot days now (above 102°F)
- 7 days/yr
- Hot days in 30 yrs
- 19 days/yr
Wind risk 2/10 · Minimal
- Chance of severe wind over 30 yrs
- 1.0%
Air-quality risk 3/10 · Minor
- Unhealthy air days now
- 2 days/yr
- Unhealthy air days in 30 yrs
- 3 days/yr
Risk factors via First Street. Map © Google.
Why this score? — see what drove the D grade
The composite is a weighted blend of 9 inputs, each scored 0–100. Each bar is that input's sub-score; the figure is the points it added to the 100-point composite (weight × sub-score).
- Cash flow +13.0/30.0
- ARV discount +7.5/15.0
- 1% rule +7.4/10.0
- DSCR +3.9/10.0
- Schools +3.5/10.0
- Rent growth +3.4/5.0
- Livability +2.5/5.0
- Condition / age +2.5/5.0
- Appreciation +0.0/10.0
$120,000
🖨 Deal sheet (PDF) 📄 Offer letter ✓ Due diligence
Listing remarks MLS
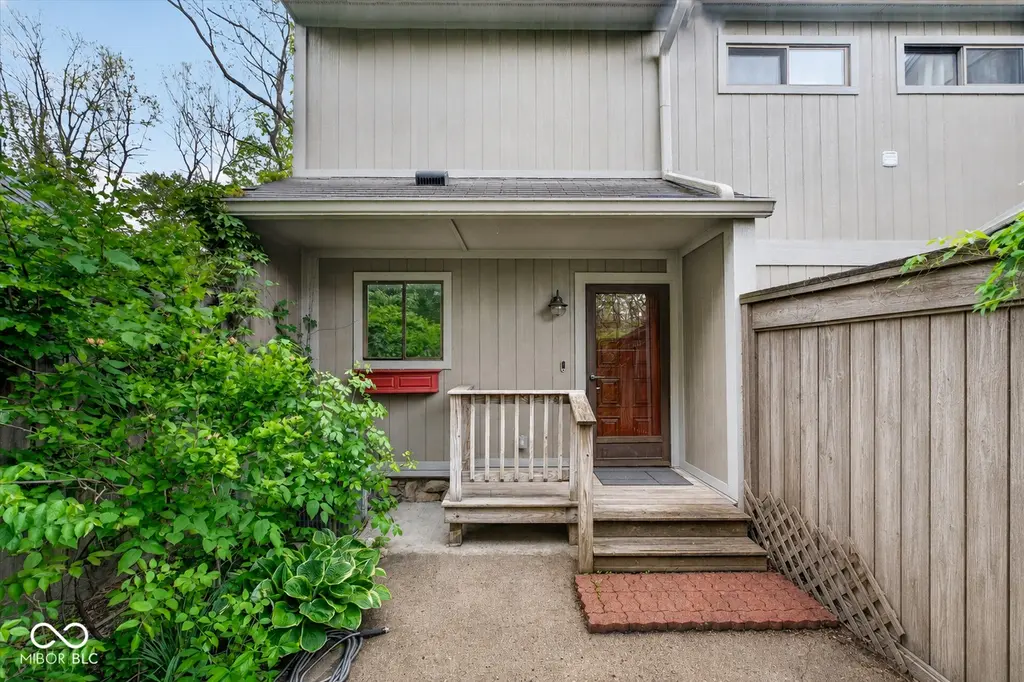
BROWN COUNTY LIKE SETTING FOR THIS CONDO IN THE CITY. GREAT ROOM WITH WOODBURNING FIREPLACE AND DINING AREA. THE KITCHEN INCLUDES ALL MAJOR APPLIANCES. MASTER BEDROOM HAS TWO CLOSETS & FULL BATH. THE MASTER BDRM AND THE GREAT ROOM HAVE DIRECT ACESS TO THE WOOD DECK OVERLOOKING THE HEAVILY WOODED AREA. SEPARATE LAUNDRY ROOM HAS STORAGE SHELVES. COMMUNITY CLUBHOUSE. PRIVACY FENCED PATIO IN FRONT OF THE HOME.
Key facts
- Oversized deck
- Storage shed
- $430 HOA
Tags
Property features AI
Finance
- Other: Ownership interest: Mandatory fee; Condo building private entry; GPS-friendly directions
- HOA & community: HOA with monthly fee (includes clubhouse, sewer, insurance, lawncare, structural and common maintenance, snow removal, trash); Community clubhouse; Covenants & Restrictions apply; Low-maintenance lifestyle
Exterior
- Parking: Carport; Assigned outdoor parking and guest street parking
- Security: Smoke alarm
- Utilities: Public water; Municipal sewer connected; Solid waste service available; Electric service
- Home design: Attached condominium (horizontal condo) with private entry; End unit with one common wall; One story; Faces northwest; Updated/remodeled condition; Has a view
- Construction: Wood siding; Crawl space foundation; Built as a single-level home
- Exterior features: Covered patio and deck; Storage shed; Mature trees; No fence
Interior
- Kitchen: Dishwasher; Disposal; Microwave; Electric oven; Refrigerator
- Bedrooms: Two bedrooms on the main level; primary bedroom includes a walk-in closet
- Flooring: Floor number: 1
- Bathrooms: Two full bathrooms on the main level
- Heating & cooling: Electric forced air heating; Central air conditioning
- Interior features: Walk-in closet(s); Laundry in unit; Covered patio/deck; Storage shed; Wood-burning fireplace in great room
- Laundry & utility: Washer and dryer included; Electric water heater; Laundry room on main level
Neighborhood map
What this means for you Summary
Snapshot
- This is a 3-bed/1.0-bath condo listed at $120k.
Deal economics
- At list price, monthly cash flow is $-7 ($-84/yr) — negative.
- To cash-flow at today's rent, offer at most $119k (1.0% below list).
- Meets the 1% rule at list price ($1k rent vs $120k).
- Recommended offer: $116k (3.0% below list) — sets the bar for market timing.
- Cap rate 6.2% vs local median 4.4% in Indianapolis city (balance) — top-decile yield for the area; either an underpriced asset or a hidden risk that comps aren't pricing in. Stress-test before assuming the spread holds.
Location & tenants
- Location reads: area grade D — affects rentability + tenant quality, not the cash-flow math above.
- Perry Township Schools (urban): math 36% / reading 45% proficiency, ranked #138 of 301 in IN (top 46%) — families likely to look elsewhere, expect single-tenant / working-renter base with shorter leases.
- Zoned schools: Clinton Young Elementary School (math 22% / reading 19%, grade F, #811 of 994 statewide, top 82%, 785 students, 86% FRL); Southport Middle School (math 22% / reading 40%, grade F, #201 of 330 statewide, top 61%, 1,194 students, 72% FRL); Southport High School (math 25% / reading 53%, grade F, #235 of 369 statewide, top 65%, 2,355 students, 70% FRL) — zoned schools average 76% FRL vs 54% district-wide (22 pts higher); higher-poverty schools than district average — tighter screening recommended.
- Market conditions: Rents rising (+3.8%/yr); 270 active listings in the ZIP; 22 comparable units currently listed for rent nearby; rentals at typical pace (median 17d on market — plan ~3-4 weeks tenant-placement turnaround); solid renter incomes; 1,906 units permitted in Marion County in 2024 (621 in 5+ unit buildings).
Forward outlook
- Local home prices are declining (-3.0%/yr); year-one equity from $830 of loan paydown is wiped out by about $4k of value loss. Plan a longer hold.
- Marion County population projected at +18% by 2050 — long-run rental-demand tailwind backs the buy-and-hold thesis.
Negotiation context
- It's been on market 49 days — a 3% lower offer ($116k) is reasonable based on typical stale-listing flexibility.
- 4 sale attempts since 24y ago; this cycle's ask has dropped $20k (14%) from the opening price — seller is motivated, your offer sets the floor, not the list.
- Current owner paid $42k; list at $120k implies a 186% gain — meaningful room to come down on a strong offer.
Risks & watch-outs
- Watch-outs: HOA is 29% of rent.
Questions for the listing agent
- What do current leases actually rent for vs. the listed asking? Can we see a recent rent roll and the last 12 months of T-12 income?
- It's been on market 49 days. Have you received any prior offers? Is the seller open to a 3% concession, seller financing, or rate buy-down credit?
- Built in 1974 — when were the roof, HVAC, electrical panel, plumbing, and water heater last replaced?
- What does the HOA fee cover, when was the last increase, and are there any pending special assessments or reserve-fund shortfalls?
- Any open or pending special assessments — roof, HVAC, plumbing, elevator, façade? What's the per-unit balance and payoff schedule, and is the seller paying it off at close or rolling it to the buyer?
- Is there a deadline driving the sale (1031 exchange, divorce, estate, relocation)? That informs how much negotiation room exists.
- The area grade is low — what's the realistic commute time and amenity access for the typical tenant pool here? Any planned neighborhood developments (good or bad) we should know about?
- What's the average days-on-market for RENTAL listings here right now (not sales)? A rising rental-DOM trend means longer vacancies and softer asking-rent achievability than the comps imply.
- What's the recent tenant-quality profile in this submarket — average credit score on applications, eviction rate, late-payment / NSF rate, and stable-employment percentage? A property-management company in the area should have these aggregated.
- How much new apartment / multifamily construction is in the pipeline within 1–3 miles? Heavy new supply (>2% of stock underway) typically softens rents 12–24 months out; light construction supports rent growth.
Investment metrics
- 1% rule
- 1.24% ✓
- Cap rate
- 6.22%
- Cash-on-cash
- -0.25%
- DSCR
- 0.99
- GRM
- 6.7
CMA / ARV
No comps found within radius.
Projected returns pro-forma
-3.0% appreciation · 3.78% rent growth · sell at horizon
- IRR
- -15.2%
- Equity multiple
- 0.45×
- Total profit
- $-18,474
- Equity at exit
- $17,892
- IRR
- -4.6%
- Equity multiple
- 0.68×
- Total profit
- $-10,779
- Equity at exit
- $10,375
Cash invested: $33,600 (down + closing). Projections, not guarantees.
Landlord ↔ Tenant lean methodology
- Overall (STATE)
- 90 Strongly Landlord-Friendly
- State Indiana
- 90 Strongly Landlord-Friendly · R+11
- County
- — inherits STATE
- City
- — inherits STATE
ZIP-level market 46237
- Rents YoY
- 3.8%
- Active inventory
- 270
- Price-to-rent
- 6.7×
Monthly cashflow live
- Estimated rent
- $1,489 high interval (Pro) →
- Mortgage (P&I)
- −$629
- Tax from tax record
- −$74 /mo · $886/yr
- Insurance
- −$50
- HOA
- −$430
- Vacancy / Maint / Mgmt
- −$313
- Net cashflow
- $-7
Break-even live
Sensitivity live
| Price | -10% $61 | -5% $27 | +0% $-7 | +5% $-41 | +10% $-75 |
|---|---|---|---|---|---|
| Rent | -10% $-125 | -5% $-66 | +0% $-7 | +5% $52 | +10% $111 |
| Rate | -1.0pp $53 | -0.5pp $24 | base $-7 | +0.5pp $-38 | +1.0pp $-70 |
UW: 25.0% down · 7.5% · 30yr · 1.5% tax · 5.0% vac · 8.0% maint · 8.0% mgmt
Financing live
Cash to close
- Down payment
- $30,000
- Closing costs
- $3,600
- Reserves months
- —
- Total cash needed
- —
Loan-product check · same deal, 3 products live
Conventional
25% down · 7.5% · 30yr
- Down + closing
- —
- Monthly P&I
- —
- Monthly cashflow
- —
- DSCR
- —
- Eligible?
- —
Personal DTI + credit; lowest rate.
DSCR
20% down · 8.5% · 30yr
- Down + closing
- —
- Monthly P&I
- —
- Monthly cashflow
- —
- DSCR
- —
- Eligible?
- —
No personal income docs; deal must DSCR.
Hard money
10% down · 12.0% · 12mo
- Down + closing
- —
- Monthly P&I
- —
- Monthly cashflow
- —
- DSCR
- —
- Eligible?
- —
Short-term bridge; refi at stabilization.
Rent comps 22 comps
| Address | Beds | Baths | Sqft | Rent | $/sqft | DOM | Units | Dist |
|---|---|---|---|---|---|---|---|---|
| 4649 Strawbridge St Indianapolis, IN | 2.0–3.0 | 1.0–1.5 | 983 | $1,175 | $1.19 | 3d | 11 | 0.49mi |
| 4651 Mimi Dr Indianapolis, IN | 2.0 | 1.0 | 725 | $1,234 | $1.70 | 0d | 11 | 0.61mi |
| 416 Ada Ln Beech Grove, IN | 3.0 | 2.0 | 1043 | $1,611 | $1.54 | 0d | 1 | 0.66mi |
| 4880 Willow Glen Dr Beech Grove, IN | 1.0–3.0 | 1.0–1.5 | 971 | $1,695 | $1.75 | 4d | 34 | 0.68mi |
| 2913 E Hanna Ave Indianapolis, IN | 1.0–2.0 | 1.0 | 717 | $1,200 | $1.67 | 25d | 1 | 0.72mi |
| 240 Grovewood Pl Unit 228 Beech Grove, IN | 2.0 | 1.0 | 900 | $1,215 | $1.35 | 45d | 1 | 0.81mi |
| 1973 Newcomer Ln Beech Grove, IN | 4.0 | 1.0 | 1368 | $1,500 | $1.10 | 23d | 1 | 0.93mi |
| 3633 S Rural St Indianapolis, IN | 3.0 | 2.5 | 1440 | $1,700 | $1.18 | 25d | 1 | 1.01mi |
| 108 S 8th Ave Beech Grove, IN | 2.0 | 1.5 | 816 | $1,225 | $1.50 | 12d | 1 | 1.03mi |
| 136 S 4th Ave Unit 2 Beech Grove, IN | 3.0 | 2.0 | 1200 | $1,300 | $1.08 | 25d | 1 | 1.11mi |
| 93 S 5th Ave Beech Grove, IN | 3.0 | 1.0 | 1316 | $1,195 | $0.91 | 45d | 1 | 1.15mi |
| 4901 S Emerson Ave Indianapolis, IN | 1.0–4.0 | 1.0–2.0 | 998 | $1,712 | $1.71 | 0d | 10 | 1.19mi |
| 4401 S Keystone Ave Indianapolis, IN | 2.0 | 1.5–2.0 | 1000 | $1,142 | $1.14 | 3d | 17 | 1.21mi |
| 2315 Bischoff Dr Beech Grove, IN | 2.0 | 1.0 | 1065 | $848 | $0.80 | 25d | 2 | 1.27mi |
| 80 N 5th Ave Beech Grove, IN | 2.0 | 2.0 | 900 | $1,150 | $1.28 | 9d | 1 | 1.32mi |
| 82 N 5th Ave Beech Grove, IN | 2.0 | 2.0 | 900 | $1,295 | $1.44 | 45d | 1 | 1.33mi |
| 2430 Albany St Beech Grove, IN | 2.0 | 1.0 | 800 | $899 | $1.12 | 16d | 1 | 1.35mi |
| 2430 Albany St Apt 01 Beech Grove, IN | 2.0 | 1.0 | 800 | $899 | $1.12 | 9d | 1 | 1.35mi |
| 142 N 7th Ave Beech Grove, IN | 2.0 | 1.0 | 1212 | $1,150 | $0.95 | 45d | 1 | 1.38mi |
| 3206 S Temple Ave Indianapolis, IN | 2.0 | 1.0 | 784 | $1,080 | $1.38 | 25d | 1 | 1.39mi |
| 5334 Padre Ln Indianapolis, IN | 3.0 | 1.5 | 1016 | $1,695 | $1.67 | 16d | 1 | 1.49mi |
| 5140 Emerson Village Pl Indianapolis, IN | 1.0–2.0 | 1.0–2.0 | 805 | $1,360 | $1.69 | 0d | 14 | 1.49mi |
HOA detail condo
- Monthly dues
- $430 · $5,160/yr
- Assessments
- None detected in remarks — confirm with the listing agent.
Listing history 19 events
-
2026-06-16status $120,000 Pending 49 DOM
-
2026-06-15days on market $120,000 Active 49 DOM
-
2026-06-13days on market $120,000 Active 47 DOM
-
2026-06-09days on market $120,000 Active 43 DOM
-
2026-06-08days on market $120,000 Active 42 DOM
-
2026-06-07days on market $120,000 Active 41 DOM
-
2026-06-03days on market $120,000 Active 37 DOM
-
2026-06-02days on market $120,000 Active 36 DOM
-
2026-06-01days on market $120,000 Active 35 DOM
-
2026-05-31days on market $120,000 Active 34 DOM
-
2026-05-14price $129,900
-
2026-05-07price $134,900
-
2026-04-27$139,900 Active
-
2009-08-31historical
-
2009-08-28soldstatus $42,000
-
2009-06-26$49,500
-
2002-08-21soldstatus $75,000 418-char remark
Show marketing remark (418 chars)
BROWN COUNTY LIKE SETTING FOR THIS CONDO IN THE CITY. GREAT ROOM WITH WOODBURNING FIREPLACE AND DINING AREA. THE KITCHEN INCLUDES ALL MAJOR APPLIANCES. MASTER BEDROOM HAS TWO CLOSETS & FULL BATH. THE MASTER BDRM AND THE GREAT ROOM HAVE DIRECT ACESS TO THE WOOD DECK OVERLOOKING THE HEAVILY WOODED AREA. SEPARATE LAUNDRY ROOM HAS STORAGE SHELVES. COMMUNITY CLUBHOUSE. PRIVACY FENCED PATIO IN FRONT OF THE HOME.
-
2002-06-11$79,900
Show marketing remark (418 chars)
BROWN COUNTY LIKE SETTING FOR THIS CONDO IN THE CITY. GREAT ROOM WITH WOODBURNING FIREPLACE AND DINING AREA. THE KITCHEN INCLUDES ALL MAJOR APPLIANCES. MASTER BEDROOM HAS TWO CLOSETS & FULL BATH. THE MASTER BDRM AND THE GREAT ROOM HAVE DIRECT ACESS TO THE WOOD DECK OVERLOOKING THE HEAVILY WOODED AREA. SEPARATE LAUNDRY ROOM HAS STORAGE SHELVES. COMMUNITY CLUBHOUSE. PRIVACY FENCED PATIO IN FRONT OF THE HOME.
-
2002-06-11$79,900 418-char remark
Show marketing remark (418 chars)
BROWN COUNTY LIKE SETTING FOR THIS CONDO IN THE CITY. GREAT ROOM WITH WOODBURNING FIREPLACE AND DINING AREA. THE KITCHEN INCLUDES ALL MAJOR APPLIANCES. MASTER BEDROOM HAS TWO CLOSETS & FULL BATH. THE MASTER BDRM AND THE GREAT ROOM HAVE DIRECT ACESS TO THE WOOD DECK OVERLOOKING THE HEAVILY WOODED AREA. SEPARATE LAUNDRY ROOM HAS STORAGE SHELVES. COMMUNITY CLUBHOUSE. PRIVACY FENCED PATIO IN FRONT OF THE HOME.
ⓘ Source: listings_history table (triggers on properties + properties_extension) + one-shot
backfill from property_details.listing_events for pre-trigger history.
Tax reassessment forecast IN · Partial reset (capped growth)
- Current annual tax
- $886 · $74/mo
- Projected year-2 tax
- $953 · $79/mo
- Expected delta
- +$67/yr (+$6/mo · 7.6%)
ⓘ Screening estimate from a state-policy table — verify with the county assessor before closing.
Climate risk First Street
- Flood 1/10 Low FEMA zone X (unshaded) · 0% chance over 30 yrs
- Wildfire 1/10 Low
- Heat 3/10 Moderate 7 d/yr ≥102°F today · 19 d/yr by 30 yrs out
- Wind 2/10 Low 100% chance of damaging wind over 30 yrs
- Air quality 3/10 Moderate 2 unhealthy d/yr today · 3 by 30 yrs out
Nearby sold comps map
Loading sold comps map…
Walkable amenities ~0.75 mi
Loading nearby amenities…
Taxation est. · year 1
- Rental income
- $17,865
- − Mortgage interest
- −$6,722
- − Property taxes
- −$886
- − Insurance
- −$600
- − Repairs & maintenance
- −$1,429
- − Management
- −$1,429
- − HOA
- −$5,160
- − Depreciation
- −$3,491
- Taxable loss
- −$1,852
- Est. tax savings @ 24.0%
- +$445
- After-tax cash flow
- $360/yr
For passive investors: Depreciation is non-cash, so a rental often shows a tax loss while cash-flowing — sheltering income. Rental losses are passive: they offset passive income freely, and up to $25,000/yr can offset ordinary (W-2) income if you actively participate and your MAGI is under $100k (phasing out to $0 by $150k); unused losses carry forward. On sale, claimed depreciation is recaptured at up to 25%, and gains may owe capital-gains tax (a 1031 exchange can defer both). Figures are a year-1 estimate at your 24.0% rate — not tax advice; consult a CPA.
Schools (NCES district)
- District
- Perry Township Schools
- NCES district ID
- 1808820
- Math proficiency
- 36% ▼ -13.00%
- Reading proficiency
- 45% ▼ -6.00%
- Median HH income
- $47,170
- Composite
- 34.61/100
- National rank
- #5153
- State rank
- #138 of 301 in IN
Livability — Indianapolis city (balance)
No livability data for this city. (Only ~50 U.S. cities are tracked.)
Census & demographics
- Census place
- Indianapolis city (balance), IN
- County
- Marion County · 998,460 people
- City population
- 881,119
- Metro
- Indianapolis-Carmel-Anderson, IN
- Population (ZIP)
- 43,473
- Household income
- $79,078
- Rent vs Own
- Severe rent burden
- 1245.0
Population outlook (Marion County) Hauer SSP2
- Today (2025)
- 1,025,572 people
- By 2030
- 1,065,727 · +3.9%
- By 2040
- 1,141,577 · +11.3%
- By 2050
- 1,208,920 · +17.9%
- By 2075
- 1,367,288 · +33.3%
- By 2100
- 1,438,201 · +40.2%
Race, ethnicity, and origin ACS 2023
- Neighborhood character
- Predominantly White (71%)
- Race & ethnicity
- White 71% Asian 13% Hispanic / Latino 7% Two or more races 6% Black 5%
- Hispanic origin (detail)
- Mexican 6%
- Common ancestry
- Italian 2% Lithuanian 2% Romanian 2%
- Foreign-born
- 12% · Canada, Philippines
- Languages at home
- 84% English-only · Other Asian/Pacific 5% Spanish 5% Other Indo-European 4%
Political lean MEDSL · Marion
- 2024 margin
- Strong D (+27.7) · D 63.0% · R 35.3% · Other 1.7%
- 2008→2024 swing
- -0.7pp no change · 2008: 28.4pp · 2024: 27.7pp
- All cycles
- 2024: D+27.7 2020: D+29.1 2016: D+22.8 2012: D+22.2 2008: D+28.4
Not yet ingested
- Civics
- —
Market trends
- HPI YoY
- ▼ -180.33%
- Current HPI
- 238.9661
- Rent YoY
- ▲ 3.78%
- Metro
- Indianapolis-Carmel-Anderson, IN
- State GDP YoY
- ▲ 2.90%
- F500 in state
- 18
Industry mix (Fortune 500 HQ in IN)
| Industry | F500 HQs | Revenue |
|---|---|---|
| Industrial Machinery | 2 | $37B |
|
||
| Healthcare | 1 | $177B |
|
||
| Pharmaceuticals | 1 | $45B |
|
||
| Metals / Steel | 1 | $18B |
|
||
| Agriculture | 1 | $17B |
|
||
| Packaging | 1 | $12B |
|
||
Price history
+62.6% since first listed9 events — show timeline
- 2026-05-14 Price Changed $129,900 MIBOR as Distributed by MLS Grid
- 2026-05-07 Price Changed $134,900 MIBOR as Distributed by MLS Grid
- 2026-04-27 Listed $139,900 MIBOR as Distributed by MLS Grid
- 2009-08-31 Listing Removed — MIBOR as Distributed by MLS Grid
- 2009-08-28 Sold (MLS) $42,000 MIBOR as Distributed by MLS Grid
- 2009-06-26 Listed $49,500 MIBOR as Distributed by MLS Grid
- 2002-08-21 Sold (MLS) $75,000 MIBOR as Distributed by MLS Grid
- 2002-06-11 Listed $79,900 MIBOR as Distributed by MLS Grid
- 2002-06-11 Listed $79,900 MIBOR as Distributed by MLS Grid
Property tax history
+5.0%/yrLatest (2025): $886 · +2.0% YoY. Source: county tax records.
Cash-flow waterfall
monthlySold comps — $/sqft
last 12 mo · ≤1 miLoading sold comps…