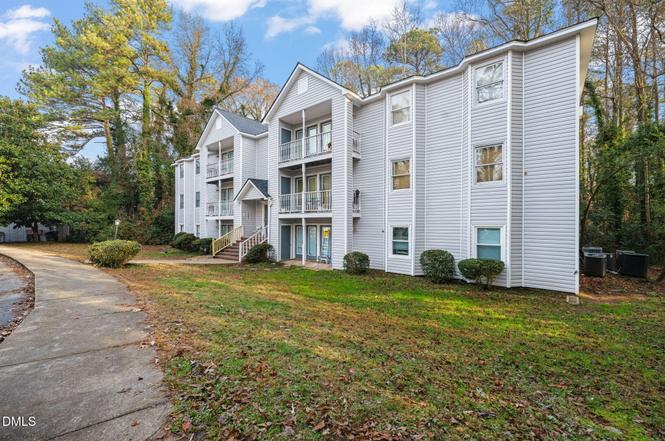
1300 Park Glen Dr #102 · Raleigh, NC
Flood risk 1/10 · Minimal
- FEMA flood zone
- X (unshaded)
- Chance of flooding over 30 yrs
- 0.0%
- Est. flood insurance / yr
- $507 – $1,088
Fire risk 3/10 · Minor
- Est. fire insurance / yr
- $906 – $1,684
Heat risk 6/10 · Moderate
- Hot days now (above 106°F)
- 7 days/yr
- Hot days in 30 yrs
- 17 days/yr
Wind risk 6/10 · Moderate
- Chance of severe wind over 30 yrs
- 60.0%
Air-quality risk 3/10 · Minor
- Unhealthy air days now
- 2 days/yr
- Unhealthy air days in 30 yrs
- 2 days/yr
Risk factors via First Street. Map © Google.
Why this score? — see what drove the C+ grade
The composite is a weighted blend of 9 inputs, each scored 0–100. Each bar is that input's sub-score; the figure is the points it added to the 100-point composite (weight × sub-score).
- Cash flow +23.7/30.0
- 1% rule +8.7/10.0
- DSCR +7.6/10.0
- ARV discount +7.5/15.0
- Schools +4.9/10.0
- Livability +4.2/5.0
- Rent growth +2.6/5.0
- Condition / age +2.5/5.0
- Appreciation +0.0/10.0
$119,900
🖨 Deal sheet 📄 Offer letter ✓ Due diligence
Listing remarks MLS
GORGEOUS 1st floor 2bed/2ba Condo in AMAZING ITB Location near Universities and all Downtown Raleigh has to offer. Bright open floor plan and upgrades galore including beautiful new shaker cabinets, granite countertops and Stainless Steel appliances. LVP Flooring in living areas and in bedrooms - NO CARPET! HOA covers water/sewer. Home Warranty included! Move in and Enjoy!
Key facts
- Open floor plan
- New dishwasher
- Granite counters
Tags
Property features AI
Finance
- HOA & community: Homeowners association (Block & Associates); HOA fee $286 monthly (includes grounds and structure maintenance, sewer, trash, water)
Exterior
- Parking: Assigned parking in lot; 2 open parking spaces
- Utilities: Public water; Public sewer
- Home design: One-story site-built unit; Unit number 102
- Construction: Vinyl siding; Shingle roof; Slab foundation; Built as site-built construction
- Exterior features: Patio; 2+ common walls (attached unit)
Interior
- Kitchen: Dishwasher; Electric range; Microwave; Stainless steel appliances; Granite counters; Pantry
- Bedrooms: 2 bedrooms (both on main level)
- Flooring: Luxury vinyl; Tile
- Bathrooms: 2 full bathrooms
- Heating & cooling: Electric heating (forced air, heat pump); Central air conditioning
- Interior features: Bathtub/shower combination; Ceiling fan(s); Granite counters; Living/dining room combination; Pantry; Primary bedroom on main level; Walk-in closet(s)
- Laundry & utility: Washer and dryer included; Laundry room on main level; Electric water heater
Neighborhood map
What this means for you Summary
Snapshot
- This is a 2-bed/2.0-bath condo listed at $120k.
Deal economics
- At list price, monthly cash flow is $227 ($3k/yr) — positive.
- The deal already cash-flows at list — no discount required.
- Meets the 1% rule at list price ($2k rent vs $120k).
- Recommended offer: $106k (12.0% below list) — sets the bar for market timing.
- Cap rate 8.6% vs local median 2.7% in Raleigh — top-decile yield for the area; either an underpriced asset or a hidden risk that comps aren't pricing in. Stress-test before assuming the spread holds.
Location & tenants
- Location reads 83/100 on livability (#10 in NC, #1,028 nationally) — a professional / high-income tenant draw. Strengths: amenities A+, commute A+, housing A+; Watch: crime F.
- Wake County Schools (suburban): math 52% / reading 60% proficiency, ranked #35 of 178 in NC (top 20%) — acceptable for families but not a draw, mixed tenant base, ~2y average lease.
- Market conditions: Rents flat; 586 active listings in the ZIP; 40 comparable units currently listed for rent nearby; rentals at typical pace (median 20d on market — plan ~3-4 weeks tenant-placement turnaround); 15,249 units permitted in Wake County in 2024 (5,568 in 5+ unit buildings).
Forward outlook
- Local home prices are declining (-3.0%/yr); year-one equity from $829 of loan paydown is wiped out by about $4k of value loss. Plan a longer hold.
- Wake County population projected at +51% by 2050 — long-run rental-demand tailwind backs the buy-and-hold thesis.
Negotiation context
- It's been on market 188 days — a 12% lower offer ($106k) is reasonable based on typical stale-listing flexibility.
- 8 sale attempts since 15y ago; this cycle's ask has dropped $40k (25%) from the opening price — seller is motivated, your offer sets the floor, not the list.
Risks & watch-outs
- Climate carrying-cost: major wind risk, 60% chance of damaging wind over 30y; extreme-heat days projected 7→17/yr by 2055 (HVAC capex compounding) — expect insurance premiums to compound above CPI over the hold.
Questions for the listing agent
- It's been on market 188 days. Have you received any prior offers? Is the seller open to a 12% concession, seller financing, or rate buy-down credit?
- What does the HOA fee cover, when was the last increase, and are there any pending special assessments or reserve-fund shortfalls?
- Any open or pending special assessments — roof, HVAC, plumbing, elevator, façade? What's the per-unit balance and payoff schedule, and is the seller paying it off at close or rolling it to the buyer?
- Why hasn't it sold? Are there any deal-killer items the seller is aware of (foundation, flood, title, zoning, code violations)?
- Is there a deadline driving the sale (1031 exchange, divorce, estate, relocation)? That informs how much negotiation room exists.
- Schools are B-rated — typically a magnet for longer-tenancy family renters. What's the average tenant stay here, and is there a school-zone premium baked into asking?
- Crime grade is F in this area — have there been break-ins, vandalism, or insurance claims at this property in the last 3 years? What carrier currently insures it and at what premium?
- What's the average days-on-market for RENTAL listings here right now (not sales)? A rising rental-DOM trend means longer vacancies and softer asking-rent achievability than the comps imply.
- What's the recent tenant-quality profile in this submarket — average credit score on applications, eviction rate, late-payment / NSF rate, and stable-employment percentage? A property-management company in the area should have these aggregated.
- How much new apartment / multifamily construction is in the pipeline within 1–3 miles? Heavy new supply (>2% of stock underway) typically softens rents 12–24 months out; light construction supports rent growth.
Investment metrics
- 1% rule
- 1.37% ✓
- Cap rate
- 8.57%
- Cash-on-cash
- 8.12%
- DSCR
- 1.36
- GRM
- 6.1
CMA / ARV
No comps found within radius.
Projected returns pro-forma
-3.0% appreciation · 0.2% rent growth · sell at horizon
- IRR
- -7.8%
- Equity multiple
- 0.72×
- Total profit
- $-9,279
- Equity at exit
- $17,877
- IRR
- -3.3%
- Equity multiple
- 0.82×
- Total profit
- $-6,196
- Equity at exit
- $10,367
Cash invested: $33,572 (down + closing). Projections, not guarantees.
Landlord ↔ Tenant lean methodology
- Overall (STATE)
- 85 Strongly Landlord-Friendly
- State North Carolina
- 85 Strongly Landlord-Friendly · R+3
- County
- — inherits STATE
- City
- — inherits STATE
ZIP-level market 27610
- Rents YoY
- 0.2%
- Active inventory
- 586
- Price-to-rent
- 6.1×
Monthly cashflow live
- Estimated rent
- $1,642 high interval (Pro) →
- Mortgage (P&I)
- −$629
- Tax from tax record
- −$105 /mo · $1,263/yr
- Insurance
- −$50
- HOA
- −$286
- Vacancy / Maint / Mgmt
- −$345
- Net cashflow
- $227
Break-even live
UW: 25.0% down · 7.5% · 30yr · 1.5% tax · 5.0% vac · 8.0% maint · 8.0% mgmt
Financing live
Cash to close
- Down payment
- $29,975
- Closing costs
- $3,597
- Reserves months
- —
- Total cash needed
- —
Loan-product check · same deal, 3 products live
Conventional
25% down · 7.5% · 30yr
- Down + closing
- —
- Monthly P&I
- —
- Monthly cashflow
- —
- DSCR
- —
- Eligible?
- —
Personal DTI + credit; lowest rate.
DSCR
20% down · 8.5% · 30yr
- Down + closing
- —
- Monthly P&I
- —
- Monthly cashflow
- —
- DSCR
- —
- Eligible?
- —
No personal income docs; deal must DSCR.
Hard money
10% down · 12.0% · 12mo
- Down + closing
- —
- Monthly P&I
- —
- Monthly cashflow
- —
- DSCR
- —
- Eligible?
- —
Short-term bridge; refi at stabilization.
Rent comps 40 comps
| Address | Beds | Baths | Sqft | Rent | $/sqft | DOM | Units | Dist |
|---|---|---|---|---|---|---|---|---|
| 1330 Park Glen Dr #104 Raleigh, NC | 2.0 | 2.0 | 1012 | $1,295 | $1.28 | 17d | 1 | 0.05mi |
| 1341 Park Glen Dr #101 Raleigh, NC | 2.0 | 2.0 | 912 | $1,250 | $1.37 | 23d | 1 | 0.08mi |
| 817 Dalewood Dr Raleigh, NC | 3.0 | 2.0 | 1110 | $1,595 | $1.44 | 14d | 1 | 0.14mi |
| 530 Banks St Raleigh, NC | 3.0 | 1.5 | 1241 | $2,399 | $1.93 | 23d | 1 | 0.20mi |
| 1950 N Raleigh Blvd Unit C Raleigh, NC | 2.0 | 2.0 | 1050 | $1,249 | $1.19 | 20d | 1 | 0.20mi |
| 2110 Birkhall St Raleigh, NC | 2.0 | 1.0–2.0 | 929 | $2,200 | $2.37 | 2d | 93 | 0.29mi |
| 1129 Marlborough Rd Raleigh, NC | 3.0 | 2.0 | 1101 | $2,050 | $1.86 | 23d | 1 | 0.36mi |
| 2317 Glascock St Raleigh, NC | 2.0 | 1.0 | 820 | $1,395 | $1.70 | 23d | 1 | 0.45mi |
| 2200 Glascock St Apt G Raleigh, NC | 2.0 | 1.5 | 1100 | $1,200 | $1.09 | 23d | 1 | 0.46mi |
| 1805 Bennett St Raleigh, NC | 2.0 | 1.0 | 1200 | $2,300 | $1.92 | 23d | 1 | 0.57mi |
| 2325 K Wesley Way Raleigh, NC | 3.0 | 2.0 | 1136 | $2,099 | $1.85 | 3d | 1 | 0.59mi |
| 712 Hartford Rd Raleigh, NC | 2.0 | 1.0 | 900 | $1,450 | $1.61 | 4d | 1 | 0.61mi |
| 1806 Midwood Dr Apt C Raleigh, NC | 2.0 | 1.0 | 950 | $1,550 | $1.63 | 21d | 1 | 0.66mi |
| 1806 Midwood Dr Raleigh, NC | 2.0 | 1.0 | 950 | $1,550 | $1.63 | 4d | 1 | 0.66mi |
| 1806 Midwood Dr Apt D Raleigh, NC | 2.0 | 1.0 | 950 | $1,475 | $1.55 | 21d | 1 | 0.66mi |
| 808 Edmund St Unit B Raleigh, NC | 1.0 | 1.0 | 720 | $1,595 | $2.22 | 23d | 1 | 0.79mi |
| 2080 Brentmoor Dr Raleigh, NC | 1.0 | 1.0 | 735 | $1,325 | $1.80 | 23d | 1 | 0.90mi |
| 2080 Brentmoor Dr Raleigh, NC | 2.0 | 2.0 | 1055 | $1,625 | $1.54 | 21d | 1 | 0.90mi |
| 2080 Brentmoor Dr Raleigh, NC | 1.0 | 1.0 | 735 | $1,325 | $1.80 | 12d | 1 | 0.90mi |
| 2221 Iron Works Dr Raleigh, NC | 2.0 | 1.0–2.0 | 803 | $2,967 | $3.69 | 4d | 30 | 0.96mi |
| 2221 Iron Works Dr Raleigh, NC | 2.0 | 1.0–2.0 | 800 | $2,572 | $3.21 | 2d | 10 | 0.96mi |
| 460 Dickens Dr Raleigh, NC | 3.0 | 2.0 | 1422 | $1,950 | $1.37 | 10d | 1 | 1.17mi |
| 900 Canenaugh Dr #108 Raleigh, NC | 2.0 | 2.0 | 1000 | $1,550 | $1.55 | 17d | 1 | 1.19mi |
| 900 E Six Forks Rd Raleigh, NC | 1.0 | 1.0 | 895 | $1,695 | $1.89 | 23d | 1 | 1.22mi |
| 800 Moratuck Dr Raleigh, NC | 1.0 | 2.0 | 750 | $1,100 | $1.47 | 23d | 1 | 1.26mi |
| 212 N Peartree Ln Raleigh, NC | 3.0 | 1.5 | 1379 | $1,545 | $1.12 | 20d | 1 | 1.29mi |
| 105 Tall Rock Ct Raleigh, NC | 1.0 | 1.0 | 1000 | $965 | $0.96 | 12d | 1 | 1.31mi |
| 105 Tall Rock Ct Raleigh, NC | 1.0 | 1.0 | 1000 | $950 | $0.95 | 23d | 1 | 1.31mi |
| 2621 Oldgate Dr Raleigh, NC | 2.0 | 2.0 | 1177 | $1,595 | $1.36 | 23d | 1 | 1.31mi |
| 305 N State St Raleigh, NC | 2.0 | 1.0 | 816 | $1,350 | $1.65 | 12d | 1 | 1.37mi |
| 1309 E Jones St Unit 1309 Raleigh, NC | 2.0 | 1.0 | 1200 | $1,395 | $1.16 | 23d | 1 | 1.38mi |
| 2305 Hill St Raleigh, NC | 2.0 | 2.0 | 1035 | $1,550 | $1.50 | 23d | 1 | 1.43mi |
| 679 Highpark Ln Raleigh, NC | 2.0 | 2.5 | 1458 | $2,700 | $1.85 | 17d | 1 | 1.43mi |
| 676 Highpark Ln Raleigh, NC | 2.0 | 2.5 | 1434 | $2,250 | $1.57 | 12d | 1 | 1.44mi |
| 2421 Hill St Raleigh, NC | 3.0 | 2.0 | 1033 | $1,700 | $1.65 | 10d | 1 | 1.48mi |
| 2922 Glenridge Dr Raleigh, NC | 2.0 | 1.5 | 1104 | $1,450 | $1.31 | 23d | 1 | 1.48mi |
| 2922 Glenridge Dr Unit A Raleigh, NC | 2.0 | 1.5 | 1104 | $1,450 | $1.31 | 19d | 1 | 1.48mi |
| 2404 Hill St Raleigh, NC | 3.0 | 2.0 | 1033 | $1,700 | $1.65 | 10d | 1 | 1.49mi |
| 2911 Mid-Century Dr Raleigh, NC | 3.0 | 1.0–2.0 | 1038 | $1,974 | $1.90 | 1d | 37 | 1.49mi |
| 3211 Pridwen Cir Raleigh, NC | 1.0–3.0 | 1.0–2.0 | 1103 | $1,362 | $1.23 | 2d | 17 | 1.49mi |
HOA detail condo
- Monthly dues
- $286 · $3,432/yr
- Likely covers
- watersewer
- Assessments
- None detected in remarks — confirm with the listing agent.
Listing history 45 events
-
2026-06-18days on market $119,900 Active 188 DOM
-
2026-06-17days on market $119,900 Active 187 DOM
-
2026-06-16days on market $119,900 Active 186 DOM
-
2026-06-15days on market $119,900 Active 185 DOM
-
2026-06-13days on market $119,900 Active 183 DOM
-
2026-06-13days on market $119,900 Active 182 DOM
-
2026-06-09days on market $119,900 Active 179 DOM
-
2026-06-08days on market $119,900 Active 178 DOM
-
2026-06-07days on market $119,900 Active 177 DOM
-
2026-06-05days on market $119,900 Active 174 DOM
-
2026-06-03days on market $119,900 Active 173 DOM
-
2026-06-02days on market $119,900 Active 172 DOM
-
2026-06-01days on market $119,900 Active 171 DOM
-
2026-05-31days on market $119,900 Active 170 DOM
-
2026-05-01price $125,000
-
2026-05-01historical
-
2026-04-20price $125,000
-
2026-04-13price $129,900
-
2026-04-07price $129,900
-
2026-03-05price $139,900
-
2026-03-02price $139,900
-
2026-01-28price $150,000
-
2026-01-28price $150,000
-
2026-01-21$159,900 Active
-
2025-12-12$159,900 Active
-
2022-08-26soldstatus $159,900 Closed 376-char remark
Show marketing remark (376 chars)
GORGEOUS 1st floor 2bed/2ba Condo in AMAZING ITB Location near Universities and all Downtown Raleigh has to offer. Bright open floor plan and upgrades galore including beautiful new shaker cabinets, granite countertops and Stainless Steel appliances. LVP Flooring in living areas and in bedrooms - NO CARPET! HOA covers water/sewer. Home Warranty included! Move in and Enjoy!
-
2022-08-26soldstatus $160,000
Show marketing remark (376 chars)
GORGEOUS 1st floor 2bed/2ba Condo in AMAZING ITB Location near Universities and all Downtown Raleigh has to offer. Bright open floor plan and upgrades galore including beautiful new shaker cabinets, granite countertops and Stainless Steel appliances. LVP Flooring in living areas and in bedrooms - NO CARPET! HOA covers water/sewer. Home Warranty included! Move in and Enjoy!
-
2022-08-01historical Contingent 376-char remark
Show marketing remark (376 chars)
GORGEOUS 1st floor 2bed/2ba Condo in AMAZING ITB Location near Universities and all Downtown Raleigh has to offer. Bright open floor plan and upgrades galore including beautiful new shaker cabinets, granite countertops and Stainless Steel appliances. LVP Flooring in living areas and in bedrooms - NO CARPET! HOA covers water/sewer. Home Warranty included! Move in and Enjoy!
-
2022-07-29$159,900 Active 376-char remark
Show marketing remark (376 chars)
GORGEOUS 1st floor 2bed/2ba Condo in AMAZING ITB Location near Universities and all Downtown Raleigh has to offer. Bright open floor plan and upgrades galore including beautiful new shaker cabinets, granite countertops and Stainless Steel appliances. LVP Flooring in living areas and in bedrooms - NO CARPET! HOA covers water/sewer. Home Warranty included! Move in and Enjoy!
-
2019-03-01soldstatus $67,000 Closed
-
2019-03-01soldstatus $67,000
-
2019-03-01soldstatus $67,000
-
2019-02-12historical Contingent
-
2019-02-08$70,000 Active
-
2019-02-08$70,000
-
2016-02-15historical
-
2015-11-02status Active
-
2015-10-23historical
-
2015-10-23$50,000
-
2013-05-16soldstatus $25,000 Closed
-
2013-05-16soldstatus $25,000
-
2013-02-23historical Contingent
-
2011-09-01$49,000 Active
-
1995-07-14soldstatus $53,000
-
1986-04-25soldstatus $53,000
ⓘ Source: listings_history table (triggers on properties + properties_extension) + one-shot
backfill from property_details.listing_events for pre-trigger history.
Tax reassessment forecast NC · Resets to sale price
- Current annual tax
- $1,263 · $105/mo
- Projected year-2 tax
- $1,263 · $105/mo
- Expected delta
- $0/yr ($0/mo · 0.0%)
ⓘ Screening estimate from a state-policy table — verify with the county assessor before closing.
Climate risk First Street
- Flood 1/10 Low FEMA zone X (unshaded) · 0% chance over 30 yrs
- Wildfire 3/10 Moderate
- Heat 6/10 Major 7 d/yr ≥106°F today · 17 d/yr by 30 yrs out
- Wind 6/10 Major 60% chance of damaging wind over 30 yrs
- Air quality 3/10 Moderate 2 unhealthy d/yr today · 2 by 30 yrs out
Nearby sold comps map
Loading sold comps map…
Walkable amenities ~0.75 mi
Loading nearby amenities…
Taxation est. · year 1
- Rental income
- $19,706
- − Mortgage interest
- −$6,716
- − Property taxes
- −$1,263
- − Insurance
- −$600
- − Repairs & maintenance
- −$1,576
- − Management
- −$1,576
- − HOA
- −$3,432
- − Depreciation
- −$3,488
- Taxable income
- $1,054
- Est. tax owed @ 24.0%
- −$253
- After-tax cash flow
- $2,475/yr
For passive investors: Depreciation is non-cash, so a rental often shows a tax loss while cash-flowing — sheltering income. Rental losses are passive: they offset passive income freely, and up to $25,000/yr can offset ordinary (W-2) income if you actively participate and your MAGI is under $100k (phasing out to $0 by $150k); unused losses carry forward. On sale, claimed depreciation is recaptured at up to 25%, and gains may owe capital-gains tax (a 1031 exchange can defer both). Figures are a year-1 estimate at your 24.0% rate — not tax advice; consult a CPA.
Schools (NCES district)
- District
- Wake County Schools
- NCES district ID
- 3704720
- Math proficiency
- 52% ▲ 2.00%
- Reading proficiency
- 60% ▲ 4.00%
- Median HH income
- $67,509
- Composite
- 49.41/100
- National rank
- #2010
- State rank
- #35 of 178 in NC
Livability — Raleigh
- Score
- 83/100
- State rank
- #10
- US rank
- #1028
Category grades
Schools grade is shown separately in the Schools card above.
Census & demographics
- Census place
- Raleigh, NC
- County
- Wake County · 1,216,256 people
- City population
- 569,344
- Metro
- Raleigh-Cary, NC
- Population (ZIP)
- 81,419
- Household income
- $67,932
- Rent vs Own
- Severe rent burden
- 3499.0
Population outlook (Wake County) Hauer SSP2
- Today (2025)
- 1,293,152 people
- By 2030
- 1,428,223 · +10.4%
- By 2040
- 1,698,188 · +31.3%
- By 2050
- 1,955,807 · +51.2%
- By 2075
- 2,520,273 · +94.9%
- By 2100
- 2,893,335 · +123.7%
Race, ethnicity, and origin ACS 2023
- Neighborhood character
- Diverse neighborhood (Simpson 0.59)
- Race & ethnicity
- Black 59% Hispanic / Latino 20% White 15% Two or more races 8% Asian 1%
- Hispanic origin (detail)
- Mexican 10% Puerto Rican 1% Dominican 1%
- Common ancestry
- Lithuanian 1% Slovak 1% Serbian 1%
- Foreign-born
- 14% · Canada
- Languages at home
- 77% English-only · Spanish 18% Arabic 1% French/Haitian/Cajun 1%
Political lean MEDSL · Wake
- 2024 margin
- Strong D (+25.5) · D 61.9% · R 36.4% · Other 1.7%
- 2008→2024 swing
- +11.1pp toward D · 2008: 14.4pp · 2024: 25.5pp
- All cycles
- 2024: D+25.5 2020: D+26.4 2016: D+20.5 2012: D+10.2 2008: D+14.4
Not yet ingested
- Civics
- —
Market trends
- HPI YoY
- ▼ -131.88%
- Current HPI
- 237.704
- Rent YoY
- ▲ 0.20%
- Metro
- Raleigh-Cary, NC
- State GDP YoY
- ▲ 3.28%
- F500 in state
- 26
Industry mix (Fortune 500 HQ in NC)
| Industry | F500 HQs | Revenue |
|---|---|---|
| Financial Services | 2 | $213B |
|
||
| Retail | 2 | $95B |
|
||
| Industrial Conglomerate | 1 | $38B |
|
||
| Metals / Steel | 1 | $35B |
|
||
| Utilities | 1 | $30B |
|
||
| Industrial Machinery | 1 | $19B |
|
||
Price history
+135.8% since first listed31 events — show timeline
- 2026-05-01 Price Changed $125,000 TMLS
- 2026-05-01 Listing Removed — TMLS
- 2026-04-20 Price Changed $125,000 TMLS
- 2026-04-13 Price Changed $129,900 TMLS
- 2026-04-07 Price Changed $129,900 TMLS
- 2026-03-05 Price Changed $139,900 TMLS
- 2026-03-02 Price Changed $139,900 TMLS
- 2026-01-28 Price Changed $150,000 TMLS
- 2026-01-28 Price Changed $150,000 TMLS
- 2026-01-21 Listed $159,900 TMLS
- 2025-12-12 Listed $159,900 TMLS
- 2022-08-26 Sold (Public Records) $160,000 Public Records
- 2022-08-26 Sold (MLS) $159,900 TMLS
- 2022-08-01 Contingent — TMLS
- 2022-07-29 Listed $159,900 TMLS
- 2019-03-01 Sold (Public Records) $67,000 Public Records
- 2019-03-01 Sold (MLS) $67,000 AMLSNC
- 2019-03-01 Sold (MLS) $67,000 TMLS
- 2019-02-12 Contingent — TMLS
- 2019-02-08 Listed $70,000 AMLSNC
- 2019-02-08 Listed $70,000 TMLS
- 2016-02-15 Listing Removed — TMLS
- 2015-11-02 Relisted — TMLS
- 2015-10-23 Listed $50,000 TMLS
- 2015-10-23 Listing Removed — TMLS
- 2013-05-16 Sold (Public Records) $25,000 Public Records
- 2013-05-16 Sold (MLS) $25,000 TMLS
- 2013-02-23 Contingent — TMLS
- 2011-09-01 Listed $49,000 TMLS
- 1995-07-14 Sold (Public Records) $53,000 Public Records
- 1986-04-25 Sold (Public Records) $53,000 Public Records
Property tax history
+6.1%/yrLatest (2025): $1,263 · +0.4% YoY. Source: county tax records.
Cash-flow waterfall
monthlySold comps — $/sqft
last 12 mo · ≤1 miLoading sold comps…