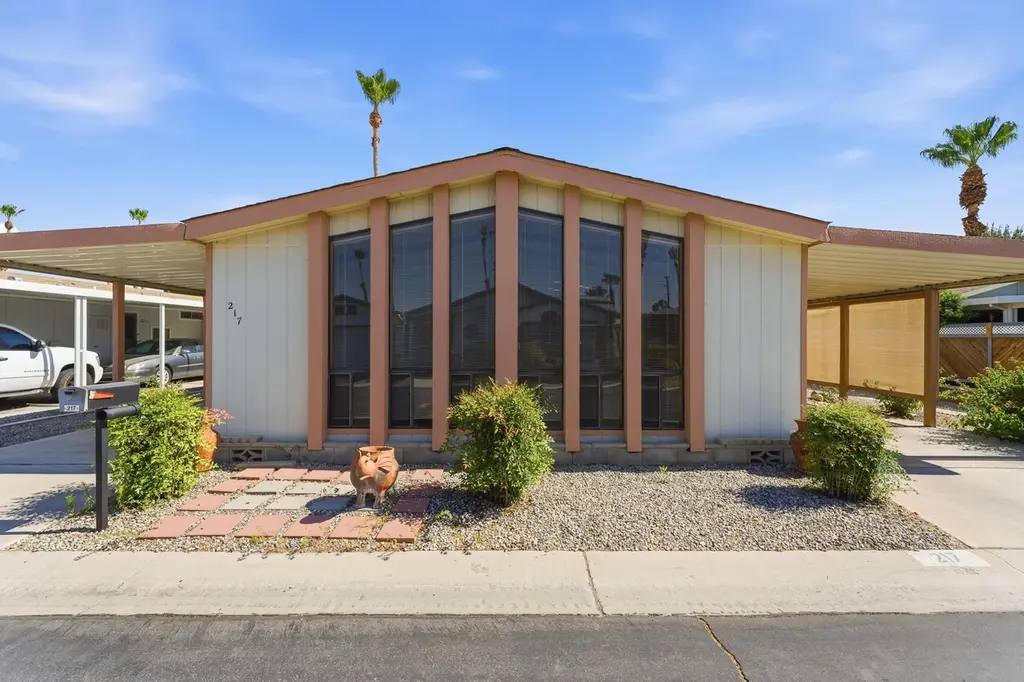
217 Settles Dr · Cathedral City, CA
Flood risk 1/10 · Minimal
- FEMA flood zone
- X
- Chance of flooding over 30 yrs
- 0.0%
- Est. flood insurance / yr
- $507 – $1,088
Fire risk 4/10 · Minor
- Est. fire insurance / yr
- $659 – $1,223
Heat risk 9/10 · Severe
- Hot days now (above 113°F)
- 7 days/yr
- Hot days in 30 yrs
- 20 days/yr
Wind risk 1/10 · Minimal
- Chance of severe wind over 30 yrs
- —
Air-quality risk 5/10 · Moderate
- Unhealthy air days now
- 6 days/yr
- Unhealthy air days in 30 yrs
- 8 days/yr
Risk factors via First Street. Map © Google.
Why this score? — see what drove the B+ grade
The composite is a weighted blend of 9 inputs, each scored 0–100. Each bar is that input's sub-score; the figure is the points it added to the 100-point composite (weight × sub-score).
- Cash flow +30.0/30.0
- ARV discount +15.0/15.0
- 1% rule +10.0/10.0
- DSCR +10.0/10.0
- Rent growth +3.3/5.0
- Livability +3.3/5.0
- Schools +2.7/10.0
- Condition / age +2.5/5.0
- Appreciation +0.0/10.0
$125,000
🖨 Deal sheet 📄 Offer letter ✓ Due diligence
Listing remarks
Discover the potential in this spacious triple-wide manufactured home offering 1,976 square feet of living space with 2 bedrooms and 2 full baths. Built in 1984 and maintained in its original condition, this home presents a wonderful opportunity for a buyer to update and customize to their own style and taste. Being sold As-Is, the seller has proactively completed a property inspection and is offering a credit at the close of escrow for minor repairs and handyman items. Ideally situated alongside a convenient breezeway leading directly to the community clubhouse, this home enjoys a desirable location within the park. The generous floor plan provides ample living and entertaining space, maki
Key facts
- Garage
- Community pool
- Built 1984
Property features AI
Finance
- Other: Listing is cash sale terms; Property sold as-is with pet restrictions; Short-term rentals and leasing not permitted
- Financial info: Land is leasehold; annual land lease amount $11,700
- HOA & community: Senior community; Gated community; No monthly association fee listed
Exterior
- Parking: Attached carport; 2 carport spaces; 2 total parking spaces; Guest parking
- Security: Gated community; 24-hour security; Resident manager on site
- Utilities: Water provided by C.V.W.D. (water district); Sewer connected and paid; Cable TV available
- Home design: Single-story (one level) with ground-level entry; Triple-wide mobile home (Barrington model); Senior park location (The Canyon)
- Construction: Fleetwood manufactured home; Triple-wide mobile home; One shed on the property
- Exterior features: 24-hour security with resident manager; Community security and automatic gate; Community in-ground pool with safety gate; Community heated spa / hot tub; Mountain views; Detached property; Located on a state road frontage
Interior
- Flooring: Carpet; Laminate; Linoleum
- Bathrooms: 2 full bathrooms
- Heating & cooling: Natural gas heating; Central heating plus fireplace(s); Air conditioning; Evaporative cooling; Ceiling fans
- Interior features: Wet bar; Blinds and stained glass window treatments; Unfurnished
- Laundry & utility: Laundry in an individual room or dedicated laundry area; Water heater unit
Neighborhood map
What this means for you Summary
Snapshot
- This is a 2-bed/2.0-bath manufactured listed at $125k.
Deal economics
- At list price, monthly cash flow is $2k ($20k/yr) — positive.
- The deal already cash-flows at list — no discount required.
- Meets the 1% rule at list price ($3k rent vs $125k).
- Cap rate 21.9% vs local median 5.1% in Cathedral City — top-decile yield for the area; either an underpriced asset or a hidden risk that comps aren't pricing in. Stress-test before assuming the spread holds.
Location & tenants
- Location reads 66/100 on livability (#344 in CA) — a middle-class / working-renter tenant base. Strengths: commute A+, housing B+; Watch: employment D+, schools F, amenities D-.
- Palm Springs Unified (suburban): math 21% / reading 42% proficiency, ranked #328 of 517 in CA (top 63%) — families likely to look elsewhere, expect single-tenant / working-renter base with shorter leases; 73% free/reduced lunch — lower-income household profile, screen leases tightly.
- Market conditions: Rents rising (+3.2%/yr); 525 active listings in the ZIP; 26 comparable units currently listed for rent nearby; rentals lingering (median 44d on market — plan ~5-8 weeks vacancy on turnover, expect pricing pressure); 54% of comp listings sitting > 30 days — soft ceiling on asking rent; 9,195 units permitted in Riverside County in 2024 (1,512 in 5+ unit buildings).
- At $3,016/mo this rent would consume 49% of the median local household income ($74k/yr) (locally 1682% of renters already pay >50% of income on rent) — very limited rent-growth headroom before tenants either downsize or default.
Forward outlook
- Local home prices are declining (-3.0%/yr); year-one equity from $864 of loan paydown is wiped out by about $4k of value loss. Plan a longer hold.
- Riverside County population projected at +22% by 2050 — long-run rental-demand tailwind backs the buy-and-hold thesis.
- At projected returns (-3.0% appreciation + 3.2% rent growth), your $35k cash investment doubles in ~3 years — after that, you're playing with house money.
Negotiation context
- Only 6 days on market — expect competitive offers; lowballing is unlikely to land.
Risks & watch-outs
- Climate carrying-cost: extreme-heat days projected 7→20/yr by 2055 (HVAC capex compounding) — expect insurance premiums to compound above CPI over the hold.
Questions for the listing agent
- Is there a deadline driving the sale (1031 exchange, divorce, estate, relocation)? That informs how much negotiation room exists.
- Schools are F-rated, which usually means shorter tenancies and higher turnover. Who's the typical renter profile here, and what's been the actual vacancy rate?
- What's the average days-on-market for RENTAL listings here right now (not sales)? A rising rental-DOM trend means longer vacancies and softer asking-rent achievability than the comps imply.
- What's the recent tenant-quality profile in this submarket — average credit score on applications, eviction rate, late-payment / NSF rate, and stable-employment percentage? A property-management company in the area should have these aggregated.
- How much new for-sale + rental construction is in the pipeline within 1–3 miles? Heavy new supply typically softens prices + rents 12–24 months out; constrained supply supports both.
Investment metrics
- 1% rule
- 2.41% ✓
- Cap rate
- 21.93%
- Cash-on-cash
- 55.86%
- DSCR
- 3.49
- GRM
- 3.5
CMA / ARV
- ARV (on-the-fly)
- $187,720
- Comps found
- 10
Show comp detail 10 sales within ~0.75 mi
| Address | Dist | Beds/Ba | Sqft | Sold | Price | $/sf | Match |
|---|---|---|---|---|---|---|---|
| 130 Hester Dr | 0.18mi | 2/2.0 | 2,003 (+1%) | 4mo | $159,000 | $79 | 86 |
| 57 Coble Dr | 0.15mi | 2/2.0 | 1,920 (-3%) | 3mo | $154,000 | $80 | 86 |
| 181 Zacharia Dr | 0.23mi | 2/2.0 | 1,800 (-9%) | 1mo | $117,000 | $65 | 73 |
| 10 Coble | 0.18mi | 2/2.0 | 2,100 (+6%) | 13mo | $200,000 | $95 | 70 |
| 228 Settles Dr | 0.02mi | 2/2.0 | 1,728 (-13%) | 12mo | $165,000 | $95 | 68 |
| 82 Zacharia | 0.12mi | 2/2.0 | 1,868 (-6%) | 21mo | $200,000 | $107 | 68 |
| 224 Settles Dr | 0.04mi | 3/2.0 (+1) | 1,744 (-12%) | 13mo | $225,000 | $129 | 62 |
| 222 Settles Dr | 0.05mi | 3/2.0 (+1) | 1,840 (-7%) | 22mo | $196,000 | $107 | 62 |
| 307 Coble Dr | 0.20mi | 3/2.0 (+1) | 1,701 (-14%) | 14mo | $158,000 | $93 | 51 |
| 176 Zacharia Dr | 0.15mi | 3/3.0 (+1) | 1,710 (-14%) | 17mo | $128,500 | $75 | 47 |
Match score weights: distance 35% · size 25% · config 20% · recency 20%. Top-matched comps best support the ARV.
Projected returns pro-forma
-3.0% appreciation · 3.22% rent growth · sell at horizon
- IRR
- 54.4%
- Equity multiple
- 3.40×
- Total profit
- $84,150
- Equity at exit
- $18,638
- IRR
- 59.6%
- Equity multiple
- 6.99×
- Total profit
- $209,549
- Equity at exit
- $10,808
Cash invested: $35,000 (down + closing). Projections, not guarantees.
Landlord ↔ Tenant lean methodology
- Overall (STATE)
- 18 Strongly Tenant-Friendly
- State California
- 18 Strongly Tenant-Friendly · D+13
- County
- — inherits STATE
- City
- — inherits STATE
ZIP-level market 92234
- Home prices YoY
- -27.7%
- Rents YoY
- 3.2%
- Active inventory
- 525
- Price-to-rent
- 3.5×
Monthly cashflow live
- Estimated rent
- $3,016 high interval (Pro) →
- Mortgage (P&I)
- −$656
- Tax from tax record
- −$46 /mo · $547/yr
- Insurance
- −$52
- HOA
- −$0
- Vacancy / Maint / Mgmt
- −$633
- Net cashflow
- $1,629
Break-even live
UW: 25.0% down · 7.5% · 30yr · 1.5% tax · 5.0% vac · 8.0% maint · 8.0% mgmt
Financing live
Cash to close
- Down payment
- $31,250
- Closing costs
- $3,750
- Reserves months
- —
- Total cash needed
- —
Loan-product check · same deal, 3 products live
Conventional
25% down · 7.5% · 30yr
- Down + closing
- —
- Monthly P&I
- —
- Monthly cashflow
- —
- DSCR
- —
- Eligible?
- —
Personal DTI + credit; lowest rate.
DSCR
20% down · 8.5% · 30yr
- Down + closing
- —
- Monthly P&I
- —
- Monthly cashflow
- —
- DSCR
- —
- Eligible?
- —
No personal income docs; deal must DSCR.
Hard money
10% down · 12.0% · 12mo
- Down + closing
- —
- Monthly P&I
- —
- Monthly cashflow
- —
- DSCR
- —
- Eligible?
- —
Short-term bridge; refi at stabilization.
Rent comps 26 comps
| Address | Beds | Baths | Sqft | Rent | $/sqft | DOM | Units | Dist |
|---|---|---|---|---|---|---|---|---|
| 68615 Paseo Soria Cathedral City, CA | 2.0 | 2.0 | 1462 | $3,500 | $2.39 | 7d | 1 | 0.17mi |
| 68153 Lakeland Dr Cathedral City, CA | 2.0 | 2.0 | 1255 | $2,500 | $1.99 | 24d | 1 | 0.18mi |
| 68368 Calle Leon Cathedral City, CA | 2.0 | 2.0 | 1406 | $3,790 | $2.70 | 14d | 1 | 0.24mi |
| 68368 Calle Leon Cathedral City, CA | 2.0 | 2.0 | 1406 | $3,790 | $2.70 | 43d | 1 | 0.24mi |
| 33892 Sky Blue Water Trl Cathedral City, CA | 3.0 | 2.0 | 1352 | $2,800 | $2.07 | 4d | 1 | 0.31mi |
| 35200 Cathedral Canyon Dr Unit B10 Cathedral City, CA | 2.0 | 2.0 | 1384 | $2,600 | $1.88 | 43d | 1 | 0.55mi |
| 35200 Cathedral Canyon Dr Unit H64 Cathedral City, CA | 2.0 | 2.0 | 1375 | $2,500 | $1.82 | 43d | 1 | 0.58mi |
| 69180 Victoria Dr #8 Cathedral City, CA | 3.0 | 2.0 | 1230 | $1,995 | $1.62 | 2d | 1 | 0.58mi |
| 33387 Shifting Sands Trl Unit 2 Cathedral City, CA | 2.0 | 2.0 | 1300 | $1,999 | $1.54 | 24d | 1 | 0.60mi |
| 68859 Paseo Real Cathedral City, CA | 2.0 | 2.0 | 1406 | $3,960 | $2.82 | 43d | 1 | 0.63mi |
| 68859 Paseo Real Cathedral City, CA | 2.0 | 2.0 | 1406 | $3,960 | $2.82 | 14d | 1 | 0.63mi |
| 34750 Marcia Rd Unit 02 Cathedral City, CA | 3.0 | 2.0 | 1325 | $2,000 | $1.51 | 17d | 1 | 0.67mi |
| 32790 Aurora Vista Rd Cathedral City, CA | 3.0 | 3.0 | 2037 | $3,300 | $1.62 | 43d | 1 | 0.72mi |
| 69200 Nilda Dr Cathedral City, CA | 3.0 | 2.0 | 1330 | $2,495 | $1.88 | 21d | 1 | 0.78mi |
| 68882 Calle Mula Cathedral City, CA | 2.0 | 2.0 | 1714 | $2,500 | $1.46 | 20d | 1 | 0.83mi |
| 5951 Montecito Dr #5 Palm Springs, CA | 3.0 | 2.5 | 1551 | $2,300 | $1.48 | 43d | 1 | 0.95mi |
| 99 Shoreline Dr Rancho Mirage, CA | 3.0 | 3.0 | 2102 | $4,000 | $1.90 | 43d | 1 | 0.95mi |
| 26 Pueblo Vista Dr Palm Springs, CA | 3.0 | 2.0 | 1487 | $3,200 | $2.15 | 43d | 1 | 1.00mi |
| 2420 Los Coyotes Dr Palm Springs, CA | 2.0 | 3.0 | 1608 | $2,600 | $1.62 | 43d | 1 | 1.05mi |
| 34361 Denise Way Rancho Mirage, CA | 3.0 | 2.0 | 1400 | $2,800 | $2.00 | 43d | 1 | 1.06mi |
| 59 Shoreline Dr Rancho Mirage, CA | 3.0 | 3.5 | 2235 | $3,995 | $1.79 | 43d | 1 | 1.07mi |
| 37 Shoreline Dr Rancho Mirage, CA | 3.0 | 3.0 | 1928 | $3,650 | $1.89 | 43d | 1 | 1.13mi |
| 152 Estrada Way #152 Cathedral City, CA | 2.0 | 2.0 | 1500 | $2,200 | $1.47 | 43d | 1 | 1.15mi |
| 159 Estrada Way Cathedral City, CA | 3.0 | 2.0 | 1800 | $2,850 | $1.58 | 43d | 1 | 1.18mi |
| 5314 Los Coyotes Dr Palm Springs, CA | 3.0 | 3.0 | 1550 | $2,600 | $1.68 | 19d | 1 | 1.20mi |
| 35349 Rush Ln Cathedral City, CA | 3.0 | 3.0 | 2196 | $3,895 | $1.77 | 23d | 1 | 1.20mi |
Listing history 6 events
-
2026-06-18days on market $125,000 Active 6 DOM
-
2026-06-17days on market $125,000 Active 5 DOM
-
2026-06-16days on market $125,000 Active 4 DOM
-
2026-06-15days on market $125,000 Active 3 DOM
-
2026-06-13remarks 699-char remark
-
2026-06-13$125,000 Active 1 DOM
ⓘ Source: listings_history table (triggers on properties + properties_extension) + one-shot
backfill from property_details.listing_events for pre-trigger history.
Tax reassessment forecast CA · Resets to sale price
- Current annual tax
- $547 · $46/mo
- Projected year-2 tax
- $950 · $79/mo
- Expected delta
- +$403/yr (+$34/mo · 73.8%)
ⓘ Screening estimate from a state-policy table — verify with the county assessor before closing.
Climate risk First Street
- Flood 1/10 Low FEMA zone X · 0% chance over 30 yrs
- Wildfire 4/10 Moderate
- Heat 9/10 Extreme 7 d/yr ≥113°F today · 20 d/yr by 30 yrs out
- Wind 1/10 Low
- Air quality 5/10 Major 6 unhealthy d/yr today · 8 by 30 yrs out
Nearby sold comps map
Loading sold comps map…
Walkable amenities ~0.75 mi
Loading nearby amenities…
Taxation est. · year 1
- Rental income
- $36,186
- − Mortgage interest
- −$7,002
- − Property taxes
- −$547
- − Insurance
- −$625
- − Repairs & maintenance
- −$2,895
- − Management
- −$2,895
- − Depreciation
- −$3,636
- Taxable income
- $18,587
- Est. tax owed @ 24.0%
- −$4,461
- After-tax cash flow
- $15,089/yr
For passive investors: Depreciation is non-cash, so a rental often shows a tax loss while cash-flowing — sheltering income. Rental losses are passive: they offset passive income freely, and up to $25,000/yr can offset ordinary (W-2) income if you actively participate and your MAGI is under $100k (phasing out to $0 by $150k); unused losses carry forward. On sale, claimed depreciation is recaptured at up to 25%, and gains may owe capital-gains tax (a 1031 exchange can defer both). Figures are a year-1 estimate at your 24.0% rate — not tax advice; consult a CPA.
Schools (NCES district)
- District
- Palm Springs Unified
- NCES district ID
- 0629550
- Math proficiency
- 21% ▼ -7.00%
- Reading proficiency
- 42% ▬ 0.00%
- Median HH income
- $43,638
- Composite
- 26.76/100
- National rank
- #7131
- State rank
- #328 of 517 in CA
Livability — Cathedral City
- Score
- 66/100
- State rank
- #344
- US rank
- #11749
Category grades
Schools grade is shown separately in the Schools card above.
Census & demographics
- Census place
- Cathedral City, CA
- County
- Riverside County · 2,287,001 people
- City population
- 52,267
- Metro
- Riverside-San Bernardino-Ontario, CA
- Population (ZIP)
- 52,267
- Household income
- $73,572
- Rent vs Own
- Severe rent burden
- 1682.0
Population outlook (Riverside County) Hauer SSP2
- Today (2025)
- 2,664,475 people
- By 2030
- 2,802,692 · +5.2%
- By 2040
- 3,050,904 · +14.5%
- By 2050
- 3,256,783 · +22.2%
- By 2075
- 3,655,058 · +37.2%
- By 2100
- 3,766,594 · +41.4%
Race, ethnicity, and origin ACS 2023
- Neighborhood character
- Diverse neighborhood (Simpson 0.56)
- Race & ethnicity
- Hispanic / Latino 59% White 30% Two or more races 27% Asian 6% Native American 2% Black 2%
- Hispanic origin (detail)
- Mexican 51%
- Common ancestry
- Lithuanian 2% Romanian 1% Italian 1%
- Foreign-born
- 28% · Canada, Vietnam
- Languages at home
- 48% English-only · Spanish 46% Tagalog/Filipino 3% Other Asian/Pacific 1%
Political lean MEDSL · Riverside
- 2024 margin
- Toss-up / Even · D 48.0% · R 49.3% · Other 2.6%
- 2008→2024 swing
- -3.6pp toward R · 2008: 2.3pp · 2024: -1.3pp
- All cycles
- 2024: R+1.3 2020: D+8.0 2016: D+4.3 2012: R+0.4 2008: D+2.3
Not yet ingested
- Civics
- —
Market trends
- HPI YoY
- ▼ -136.57%
- Current HPI
- 356.9845
- Rent YoY
- ▲ 3.22%
- Metro
- Riverside-San Bernardino-Ontario, CA
- State GDP YoY
- ▲ 3.21%
- F500 in state
- 116
Industry mix (Fortune 500 HQ in CA)
| Industry | F500 HQs | Revenue |
|---|---|---|
| Technology | 27 | $1,492B |
|
||
| Financial Services | 3 | $174B |
|
||
| Retail | 3 | $44B |
|
||
| Insurance | 3 | $26B |
|
||
| Media / Entertainment | 2 | $115B |
|
||
| Pharmaceuticals / Biotech | 2 | $62B |
|
||
Price history
1 event — show timeline
- 2026-06-11 Listed $125,000 GPSMLS
Property tax history
-2.9%/yrLatest (2025): $547 · +1.5% YoY. Source: county tax records.
Cash-flow waterfall
monthlySold comps — $/sqft
last 12 mo · ≤1 miLoading sold comps…