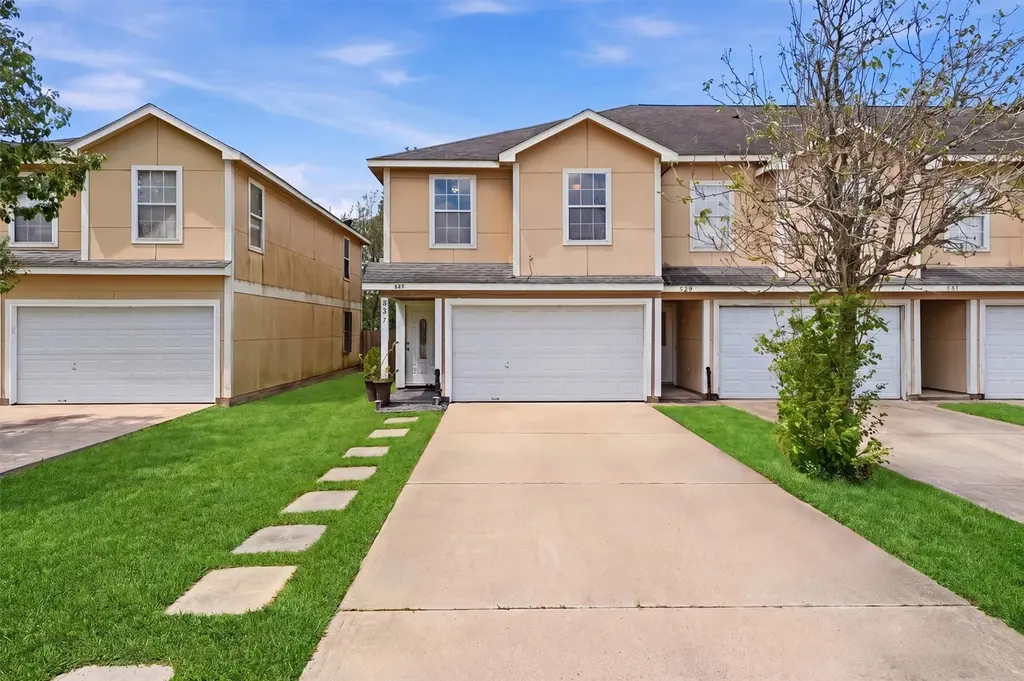
527 Solomon Ln · Brookshire, TX
Flood risk 1/10 · Minimal
- FEMA flood zone
- X (unshaded)
- Chance of flooding over 30 yrs
- 0.0%
- Est. flood insurance / yr
- $507 – $1,088
Fire risk 3/10 · Minor
- Est. fire insurance / yr
- $1,222 – $2,270
Heat risk 9/10 · Severe
- Hot days now (above 111°F)
- 7 days/yr
- Hot days in 30 yrs
- 22 days/yr
Wind risk 9/10 · Severe
- Chance of severe wind over 30 yrs
- 99.0%
Air-quality risk 2/10 · Minimal
- Unhealthy air days now
- 1 days/yr
- Unhealthy air days in 30 yrs
- 1 days/yr
Risk factors via First Street. Map © Google.
Why this score? — see what drove the C+ grade
The composite is a weighted blend of 9 inputs, each scored 0–100. Each bar is that input's sub-score; the figure is the points it added to the 100-point composite (weight × sub-score).
- Cash flow +26.4/30.0
- ARV discount +11.0/15.0
- DSCR +9.0/10.0
- 1% rule +8.2/10.0
- Livability +3.1/5.0
- Condition / age +2.5/5.0
- Rent growth +2.2/5.0
- Schools +2.0/10.0
- Appreciation +0.0/10.0
$189,900
🖨 Deal sheet 📄 Offer letter ✓ Due diligence
Listing remarks MLS
Welcome to this well-maintained townhome in the quiet community of Solomons Landing in Brookshire. This inviting home features a functional open-concept layout that seamlessly connects the living, dining, and kitchen areas ideal for both everyday living and entertaining. Enjoy tile flooring throughout, offering durability, easy maintenance, and a clean, cohesive look. Pride of ownership is evident, as the property has been very well cared for by the owner. The layout provides comfortable living spaces with a spacious primary retreat and well-appointed secondary areas. Additional highlights include a 2-car garage and a generously sized lot. Conveniently located with easy access to I-10, allowing for an easy commute to Katy and West Houston, and close to shopping, dining, and everyday conveniences. NO monthly maintenance fee & Low HOA. Great for first-time homebuyers and ready for move-in in a peaceful, growing area.
Key facts
- Generously sized lot
- 2-car garage
- Tile flooring
Tags
Neighborhood map
What this means for you Summary
Snapshot
- This is a 3-bed/2.5-bath townhouse listed at $190k.
Deal economics
- At list price, monthly cash flow is $495 ($6k/yr) — positive.
- The deal already cash-flows at list — no discount required.
- Meets the 1% rule at list price ($3k rent vs $190k).
- Recommended offer: $184k (3.0% below list) — sets the bar for market timing.
- Cap rate 9.4% vs local median 5.9% in Brookshire — top-decile yield for the area; either an underpriced asset or a hidden risk that comps aren't pricing in. Stress-test before assuming the spread holds.
Location & tenants
- Location reads 62/100 on livability (#960 in TX) — a middle-class / working-renter tenant base. Strengths: cost of living A+, housing A+; Watch: schools F, crime D-, amenities F.
- Royal ISD (rural): math 23% / reading 23% proficiency, ranked #744 of 826 in TX (top 90%) — low school quality limits family demand, transient renter base, plan for 1-2y turnover; 77% free/reduced lunch — lower-income household profile, screen leases tightly.
- Market conditions: Rents soft (-1.0%/yr); 997 active listings in the ZIP; 3 comparable units currently listed for rent nearby; rentals lingering (median 44d on market — plan ~5-8 weeks vacancy on turnover, expect pricing pressure); 100% of comp listings sitting > 30 days — soft ceiling on asking rent; solid renter incomes; 483 units permitted in Waller County in 2024 (89 in 5+ unit buildings).
- This rent runs 36% of the median local income ($84k/yr) — at the standard rent-burdened threshold; future hikes will face affordability resistance.
Forward outlook
- Local home prices are declining (-3.0%/yr); year-one equity from $1k of loan paydown is wiped out by about $6k of value loss. Plan a longer hold.
- Waller County population projected at +62% by 2050 — long-run rental-demand tailwind backs the buy-and-hold thesis.
Negotiation context
- It's been on market 57 days — a 3% lower offer ($184k) is reasonable based on typical stale-listing flexibility.
- 2 sale attempts since 17y ago with the ask held roughly flat each time — persistent listings suggest the price (not the market) is what's stuck; bring a comps-based counter.
- Current owner paid $82k; list at $190k implies a 130% gain — meaningful room to come down on a strong offer.
Risks & watch-outs
- Climate carrying-cost: severe wind risk, 99% chance of damaging wind over 30y; extreme-heat days projected 7→22/yr by 2055 (HVAC capex compounding) — expect insurance premiums to compound above CPI over the hold.
Questions for the listing agent
- It's been on market 57 days. Have you received any prior offers? Is the seller open to a 3% concession, seller financing, or rate buy-down credit?
- What does the HOA fee cover, when was the last increase, and are there any pending special assessments or reserve-fund shortfalls?
- Is there a deadline driving the sale (1031 exchange, divorce, estate, relocation)? That informs how much negotiation room exists.
- Schools are F-rated, which usually means shorter tenancies and higher turnover. Who's the typical renter profile here, and what's been the actual vacancy rate?
- Crime grade is D in this area — have there been break-ins, vandalism, or insurance claims at this property in the last 3 years? What carrier currently insures it and at what premium?
- What's the average days-on-market for RENTAL listings here right now (not sales)? A rising rental-DOM trend means longer vacancies and softer asking-rent achievability than the comps imply.
- What's the recent tenant-quality profile in this submarket — average credit score on applications, eviction rate, late-payment / NSF rate, and stable-employment percentage? A property-management company in the area should have these aggregated.
- How much new for-sale + rental construction is in the pipeline within 1–3 miles? Heavy new supply typically softens prices + rents 12–24 months out; constrained supply supports both.
Investment metrics
- 1% rule
- 1.32% ✓
- Cap rate
- 9.42%
- Cash-on-cash
- 11.18%
- DSCR
- 1.50
- GRM
- 6.3
CMA / ARV
- ARV (median comp)
- $205,973
- List price
- $189,900
- Delta
- -7.80%
- Verdict
- FAIR
- Comps
- 16 within 1.0 mi
Show comp detail 2 sales within ~0.75 mi
| Address | Dist | Beds/Ba | Sqft | Sold | Price | $/sf | Match |
|---|---|---|---|---|---|---|---|
| 513 Solomon Ln | 0.03mi | 3/2.0 | 1,516 (0%) | 6mo | $135,000 | $89 | 91 |
| 523 Solomon Ln | 0.01mi | 3/2.5 | 1,516 (0%) | 15mo | $199,000 | $131 | 87 |
Match score weights: distance 35% · size 25% · config 20% · recency 20%. Top-matched comps best support the ARV.
Projected returns pro-forma
-3.0% appreciation · 0.0% rent growth · sell at horizon
- IRR
- -3.3%
- Equity multiple
- 0.88×
- Total profit
- $-6,442
- Equity at exit
- $28,315
- IRR
- 2.2%
- Equity multiple
- 1.13×
- Total profit
- $7,141
- Equity at exit
- $16,419
Cash invested: $53,172 (down + closing). Projections, not guarantees.
Landlord ↔ Tenant lean methodology
- Overall (STATE)
- 87 Strongly Landlord-Friendly
- State Texas
- 87 Strongly Landlord-Friendly · R+5
- County
- — inherits STATE
- City
- — inherits STATE
ZIP-level market 77423
- Rents YoY
- -1.0%
- Active inventory
- 997
- Price-to-rent
- 6.3×
Monthly cashflow live
- Estimated rent
- $2,514 medium interval (Pro) →
- Mortgage (P&I)
- −$996
- Tax from tax record
- −$378 /mo · $4,536/yr
- Insurance
- −$79
- HOA
- −$38
- Vacancy / Maint / Mgmt
- −$528
- Net cashflow
- $495
Break-even live
UW: 25.0% down · 7.5% · 30yr · 1.5% tax · 5.0% vac · 8.0% maint · 8.0% mgmt
Financing live
Cash to close
- Down payment
- $47,475
- Closing costs
- $5,697
- Reserves months
- —
- Total cash needed
- —
Loan-product check · same deal, 3 products live
Conventional
25% down · 7.5% · 30yr
- Down + closing
- —
- Monthly P&I
- —
- Monthly cashflow
- —
- DSCR
- —
- Eligible?
- —
Personal DTI + credit; lowest rate.
DSCR
20% down · 8.5% · 30yr
- Down + closing
- —
- Monthly P&I
- —
- Monthly cashflow
- —
- DSCR
- —
- Eligible?
- —
No personal income docs; deal must DSCR.
Hard money
10% down · 12.0% · 12mo
- Down + closing
- —
- Monthly P&I
- —
- Monthly cashflow
- —
- DSCR
- —
- Eligible?
- —
Short-term bridge; refi at stabilization.
Rent comps 3 comps
| Address | Beds | Baths | Sqft | Rent | $/sqft | DOM | Units | Dist |
|---|---|---|---|---|---|---|---|---|
| 523 Solomon Ln Brookshire, TX | 3.0 | 2.5 | 1516 | $3,480 | $2.30 | 43d | 1 | 0.03mi |
| 4441 South St Brookshire, TX | 3.0 | 3.0 | 1846 | $1,500 | $0.81 | 43d | 1 | 0.07mi |
| 1001 Walnut Ln Brookshire, TX | 4.0 | 2.0 | 1761 | $1,941 | $1.10 | 43d | 1 | 0.59mi |
HOA detail
- Monthly dues
- $38 · $456/yr
Listing history 18 events
-
2026-06-18days on market $189,900 Active 57 DOM
-
2026-06-17days on market $189,900 Active 56 DOM
-
2026-06-16days on market $189,900 Active 55 DOM
-
2026-06-15days on market $189,900 Active 54 DOM
-
2026-06-13days on market $189,900 Active 52 DOM
-
2026-06-10days on market $189,900 Active 48 DOM
-
2026-06-08days on market $189,900 Active 47 DOM
-
2026-06-07days on market $189,900 Active 46 DOM
-
2026-06-04days on market $189,900 Active 43 DOM
-
2026-06-03days on market $189,900 Active 42 DOM
-
2026-06-02days on market $189,900 Active 41 DOM
-
2026-06-01days on market $189,900 Active 40 DOM
-
2026-05-31days on market $189,900 Active 39 DOM
-
2026-04-22$189,900 Active 944-char remark
Show marketing remark (944 chars)
Welcome to this well-maintained townhome in the quiet community of Solomons Landing in Brookshire. This inviting home features a functional open-concept layout that seamlessly connects the living, dining, and kitchen areas ideal for both everyday living and entertaining. Enjoy tile flooring throughout, offering durability, easy maintenance, and a clean, cohesive look. Pride of ownership is evident, as the property has been very well cared for by the owner. The layout provides comfortable living spaces with a spacious primary retreat and well-appointed secondary areas. Additional highlights include a 2-car garage and a generously sized lot. Conveniently located with easy access to I-10, allowing for an easy commute to Katy and West Houston, and close to shopping, dining, and everyday conveniences. NO monthly maintenance fee & Low HOA. Great for first-time homebuyers and ready for move-in in a peaceful, growing area.
-
2009-07-06soldstatus 48-char remark
Show marketing remark (48 chars)
Townhome, 3 bedroom, priced to sell. Bank Owned.
-
2009-06-25historical 48-char remark
Show marketing remark (48 chars)
Townhome, 3 bedroom, priced to sell. Bank Owned.
-
2009-04-24$29,900 48-char remark
Show marketing remark (48 chars)
Townhome, 3 bedroom, priced to sell. Bank Owned.
-
2006-12-01soldstatus $82,500
ⓘ Source: listings_history table (triggers on properties + properties_extension) + one-shot
backfill from property_details.listing_events for pre-trigger history.
Tax reassessment forecast TX · Resets to sale price
- Current annual tax
- $4,536 · $378/mo
- Projected year-2 tax
- $4,536 · $378/mo
- Expected delta
- $0/yr ($0/mo · 0.0%)
ⓘ Screening estimate from a state-policy table — verify with the county assessor before closing.
Climate risk First Street
- Flood 1/10 Low FEMA zone X (unshaded) · 0% chance over 30 yrs
- Wildfire 3/10 Moderate
- Heat 9/10 Extreme 7 d/yr ≥111°F today · 22 d/yr by 30 yrs out
- Wind 9/10 Extreme 99% chance of damaging wind over 30 yrs
- Air quality 2/10 Low 1 unhealthy d/yr today · 1 by 30 yrs out
Nearby sold comps map
Loading sold comps map…
Walkable amenities ~0.75 mi
Loading nearby amenities…
Taxation est. · year 1
- Rental income
- $30,173
- − Mortgage interest
- −$10,637
- − Property taxes
- −$4,536
- − Insurance
- −$950
- − Repairs & maintenance
- −$2,414
- − Management
- −$2,414
- − HOA
- −$456
- − Depreciation
- −$5,524
- Taxable income
- $3,242
- Est. tax owed @ 24.0%
- −$778
- After-tax cash flow
- $5,167/yr
For passive investors: Depreciation is non-cash, so a rental often shows a tax loss while cash-flowing — sheltering income. Rental losses are passive: they offset passive income freely, and up to $25,000/yr can offset ordinary (W-2) income if you actively participate and your MAGI is under $100k (phasing out to $0 by $150k); unused losses carry forward. On sale, claimed depreciation is recaptured at up to 25%, and gains may owe capital-gains tax (a 1031 exchange can defer both). Figures are a year-1 estimate at your 24.0% rate — not tax advice; consult a CPA.
Schools (NCES district)
- District
- Royal ISD
- NCES district ID
- 4838190
- Math proficiency
- 23% ▼ -11.00%
- Reading proficiency
- 23% ▼ -6.00%
- Median HH income
- $41,059
- Composite
- 19.55/100
- National rank
- #8760
- State rank
- #744 of 826 in TX
Livability — Brookshire
- Score
- 62/100
- State rank
- #960
- US rank
- #17059
Category grades
Schools grade is shown separately in the Schools card above.
Census & demographics
- Census place
- Brookshire, TX
- County
- Waller County · 18,767 people
- Metro
- Houston-The Woodlands-Sugar Land, TX
- Population (ZIP)
- 18,767
- Household income
- $84,490
- Rent vs Own
- Severe rent burden
- 20.0
Population outlook (Waller County) Hauer SSP2
- Today (2025)
- 60,772 people
- By 2030
- 67,616 · +11.3%
- By 2040
- 82,283 · +35.4%
- By 2050
- 98,276 · +61.7%
- By 2075
- 142,860 · +135.1%
- By 2100
- 175,596 · +188.9%
Race, ethnicity, and origin ACS 2023
- Neighborhood character
- Diverse neighborhood (Simpson 0.64)
- Race & ethnicity
- Hispanic / Latino 41% White 41% Black 14% Two or more races 13% Asian 2% Native American 1%
- Hispanic origin (detail)
- Mexican 30% Cuban 2%
- Common ancestry
- Lithuanian 2% Italian 2% Slovak 1%
- Foreign-born
- 17% · Canada, China, Dominican Republic
- Languages at home
- 65% English-only · Spanish 32% French/Haitian/Cajun 1% Other Indo-European 1%
Political lean MEDSL · Waller
- 2024 margin
- Strong R (+25.0) · D 37.0% · R 62.0% · Other 1.0%
- 2008→2024 swing
- -17.9pp toward R · 2008: -7.2pp · 2024: -25.0pp
- All cycles
- 2024: R+25.0 2020: R+26.7 2016: R+28.6 2012: R+17.6 2008: R+7.2
Not yet ingested
- Civics
- —
Market trends
- HPI YoY
- ▼ -125.28%
- Current HPI
- 204.8709
- Rent YoY
- ▼ -1.01%
- Metro
- Houston-The Woodlands-Sugar Land, TX
- State GDP YoY
- ▲ 3.95%
- F500 in state
- 110
Industry mix (Fortune 500 HQ in TX)
| Industry | F500 HQs | Revenue |
|---|---|---|
| Energy | 16 | $1,198B |
|
||
| Technology | 5 | $198B |
|
||
| Engineering / Construction | 4 | $72B |
|
||
| Energy Services | 3 | $60B |
|
||
| Utilities | 3 | $41B |
|
||
| Healthcare | 2 | $330B |
|
||
Price history
+130.2% since first listed5 events — show timeline
- 2026-04-22 Listed $189,900 HARMLS
- 2009-07-06 Sold (MLS) — HARMLS
- 2009-06-25 Listing Removed — HARMLS
- 2009-04-24 Listed $29,900 HARMLS
- 2006-12-01 Sold (Public Records) $82,500 Public Records
Property tax history
+5.1%/yrLatest (2025): $4,536 · -6.8% YoY. Source: county tax records.
Cash-flow waterfall
monthlySold comps — $/sqft
last 12 mo · ≤1 miLoading sold comps…