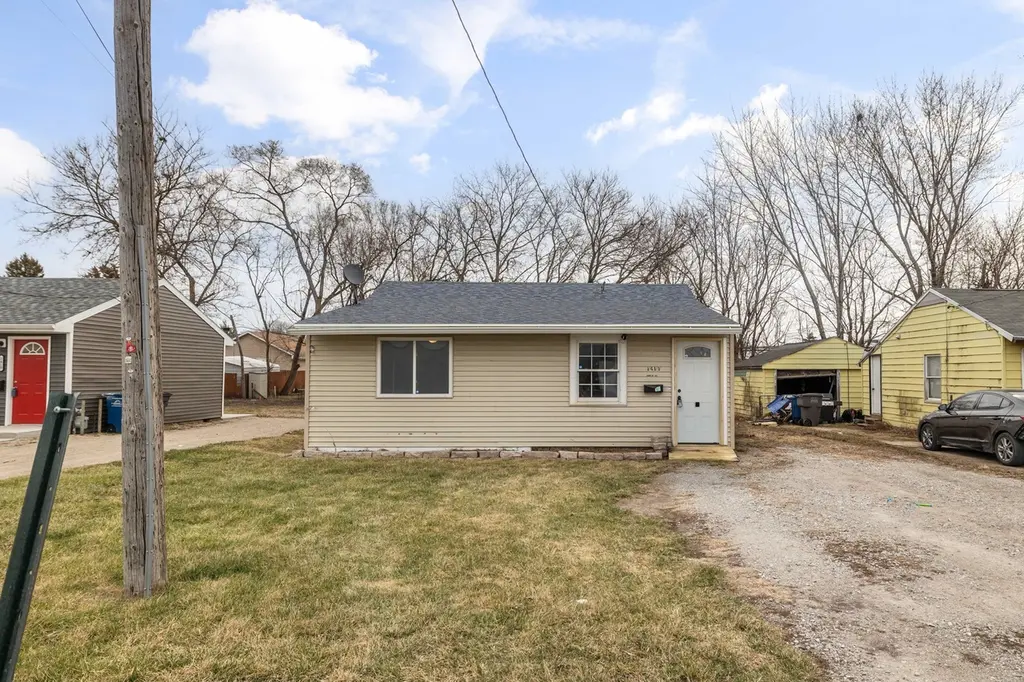
1411 Delaware Ave · Des Moines, IA
Flood risk 4/10 · Minor
- FEMA flood zone
- X (unshaded)
- Chance of flooding over 30 yrs
- 0.24%
- Est. flood insurance / yr
- $507 – $1,088
Fire risk 1/10 · Minimal
- Est. fire insurance / yr
- $902 – $1,676
Heat risk 3/10 · Minor
- Hot days now (above 103°F)
- 7 days/yr
- Hot days in 30 yrs
- 15 days/yr
Wind risk 2/10 · Minimal
- Chance of severe wind over 30 yrs
- —
Air-quality risk 2/10 · Minimal
- Unhealthy air days now
- 1 days/yr
- Unhealthy air days in 30 yrs
- 2 days/yr
Risk factors via First Street. Map © Google.
Why this score? — see what drove the C+ grade
The composite is a weighted blend of 9 inputs, each scored 0–100. Each bar is that input's sub-score; the figure is the points it added to the 100-point composite (weight × sub-score).
- Cash flow +20.1/30.0
- ARV discount +15.0/15.0
- DSCR +6.4/10.0
- 1% rule +5.6/10.0
- Livability +4.0/5.0
- Schools +3.8/10.0
- Rent growth +3.1/5.0
- Condition / age +2.5/5.0
- Appreciation +0.0/10.0
$113,900
🖨 Deal sheet (PDF) 📄 Offer letter ✓ Due diligence
Listing remarks MLS
This 2 bedroom 1 bath house is the perfect starter home or investment property. The mud room at the entrance, leading into an open living room makes this home spacious and comfortable. Good sized bedrooms with an office or den feature in one. This home is move in ready! Schedule a tour today! In the event of multiple offers, all offers will be reviewed on Thursday March 24th.
Key facts
- New siding
- New hvac
- New roof
Tags
Property features AI
Exterior
- Parking: Detached 2-car garage
- Security: Fire alarm
- Utilities: Public water; Public sewer
- Home design: Single-family residence
- Construction: Vinyl siding; Asphalt shingle roof; Block foundation; Built with vinyl siding
- Exterior features: Chain link fence; Concrete road access; Residential zoning
Interior
- Kitchen: Refrigerator; Stove
- Bedrooms: 2 main-level bedrooms
- Flooring: Carpet; Vinyl
- Bathrooms: 1 full bathroom
- Heating & cooling: Central air conditioning; Forced air heating; Natural gas heating
- Interior features: Fire alarm; Crawl space basement
- Laundry & utility: Washer; Dryer
Neighborhood map
What this means for you Summary
Snapshot
- This is a 2-bed/1.0-bath single-family listed at $114k.
Deal economics
- At list price, monthly cash flow is $143 ($2k/yr) — positive.
- The deal already cash-flows at list — no discount required.
- Meets the 1% rule at list price ($1k rent vs $114k).
- Recommended offer: $110k (3.0% below list) — sets the bar for market timing.
- Cap rate 7.8% vs local median 3.1% in Des Moines — top-decile yield for the area; either an underpriced asset or a hidden risk that comps aren't pricing in. Stress-test before assuming the spread holds.
Location & tenants
- Location reads 81/100 on livability (#63 in IA, #1,432 nationally) — a professional / high-income tenant draw. Strengths: commute A+, cost of living A+, housing A+; Watch: employment C-, crime F.
- Des Moines Independent Community School District (urban): math 43% / reading 46% proficiency, ranked #289 of 289 in IA (top 100%) — families likely to look elsewhere, expect single-tenant / working-renter base with shorter leases; 63% free/reduced lunch — lower-income household profile, screen leases tightly.
- Zoned schools: Garton Elementary (math 47% / reading 31%, grade F, #586 of 616 statewide, top 95%, 455 students, 88% FRL); Hiatt Middle School (math 31% / reading 35%, grade F, #244 of 246 statewide, top 99%, 529 students, 95% FRL); East High School (math 38% / reading 51%, grade F, #324 of 336 statewide, top 97%, 2,040 students, 79% FRL) — zoned schools average 87% FRL vs 63% district-wide (25 pts higher); higher-poverty schools than district average — tighter screening recommended.
- Market conditions: Rents rising (+2.3%/yr); 362 active listings in the ZIP; 13 comparable units currently listed for rent nearby; rentals at typical pace (median 25d on market — plan ~3-4 weeks tenant-placement turnaround); 46% of comp listings sitting > 30 days — soft ceiling on asking rent; 2,953 units permitted in Polk County in 2024 (540 in 5+ unit buildings).
Forward outlook
- Local home prices are declining (-3.0%/yr); year-one equity from $787 of loan paydown is wiped out by about $3k of value loss. Plan a longer hold.
- Polk County population projected at +37% by 2050 — long-run rental-demand tailwind backs the buy-and-hold thesis.
Negotiation context
- It's been on market 54 days — a 3% lower offer ($110k) is reasonable based on typical stale-listing flexibility.
- 6 sale attempts since 20y ago; this cycle's ask has dropped $15k (12%) from the opening price — seller is motivated, your offer sets the floor, not the list.
Risks & watch-outs
- Watch-outs: built in 1954 — expect roof / HVAC / electrical / plumbing capex.
Questions for the listing agent
- It's been on market 54 days. Have you received any prior offers? Is the seller open to a 3% concession, seller financing, or rate buy-down credit?
- Built in 1954 — when were the roof, HVAC, electrical panel, plumbing, and water heater last replaced?
- Is there a deadline driving the sale (1031 exchange, divorce, estate, relocation)? That informs how much negotiation room exists.
- Schools are D-rated, which usually means shorter tenancies and higher turnover. Who's the typical renter profile here, and what's been the actual vacancy rate?
- Crime grade is F in this area — have there been break-ins, vandalism, or insurance claims at this property in the last 3 years? What carrier currently insures it and at what premium?
- What's the average days-on-market for RENTAL listings here right now (not sales)? A rising rental-DOM trend means longer vacancies and softer asking-rent achievability than the comps imply.
- What's the recent tenant-quality profile in this submarket — average credit score on applications, eviction rate, late-payment / NSF rate, and stable-employment percentage? A property-management company in the area should have these aggregated.
- How much new for-sale + rental construction is in the pipeline within 1–3 miles? Heavy new supply typically softens prices + rents 12–24 months out; constrained supply supports both.
Investment metrics
- 1% rule
- 1.06% ✓
- Cap rate
- 7.80%
- Cash-on-cash
- 5.37%
- DSCR
- 1.24
- GRM
- 7.8
CMA / ARV
- ARV (median comp)
- $157,833
- List price
- $113,900
- Delta
- -27.84%
- Verdict
- UNDERPRICED
- Comps
- 20 within 1.0 mi
Show comp detail 12 sales within ~0.75 mi
| Address | Dist | Beds/Ba | Sqft | Sold | Price | $/sf | Match |
|---|---|---|---|---|---|---|---|
| 1519 E 24th St | 0.43mi | 2/2.0 | 945 (-2%) | 2mo | $140,000 | $148 | 72 |
| 1460 E 22nd St | 0.19mi | 3/2.0 (+1) | 1,037 (+8%) | 1mo | $189,900 | $183 | 68 |
| 1410 E 23rd St | 0.33mi | 2/1.0 | 874 (-9%) | 3mo | $164,500 | $188 | 68 |
| 1429 E 17th St | 0.54mi | 3/1.0 (+1) | 957 (-0%) | 6mo | $147,000 | $154 | 65 |
| 2432 Maple St | 0.66mi | 2/2.0 | 980 (+2%) | 2mo | $209,000 | $213 | 61 |
| 1740 E 21st St | 0.37mi | 2/1.0 | 816 (-15%) | 4mo | $85,200 | $104 | 54 |
| 1345 Sampson St | 0.59mi | 3/1.0 (+1) | 900 (-6%) | 4mo | $181,500 | $202 | 53 |
| 1536 Stewart St | 0.43mi | 2/1.0 | 816 (-15%) | 3mo | $95,000 | $116 | 52 |
| 1721 Des Moines St | 0.72mi | 2/1.0 | 833 (-13%) | 5mo | $95,000 | $114 | 40 |
| 2428 Des Moines St | 0.74mi | 2/1.5 | 832 (-13%) | 2mo | $140,000 | $168 | 39 |
| 1821 E 25th St | 0.67mi | 3/2.0 (+1) | 851 (-11%) | 3mo | $215,000 | $253 | 38 |
| 2224 Capitol Ave | 0.73mi | 3/2.0 (+1) | 1,082 (+13%) | 3mo | $110,000 | $102 | 33 |
Match score weights: distance 35% · size 25% · config 20% · recency 20%. Top-matched comps best support the ARV.
Projected returns pro-forma
-3.0% appreciation · 2.29% rent growth · sell at horizon
- IRR
- -8.8%
- Equity multiple
- 0.68×
- Total profit
- $-10,187
- Equity at exit
- $16,983
- IRR
- -0.2%
- Equity multiple
- 0.98×
- Total profit
- $-495
- Equity at exit
- $9,848
Cash invested: $31,892 (down + closing). Projections, not guarantees.
Landlord ↔ Tenant lean methodology
- Overall (STATE)
- 83 Strongly Landlord-Friendly
- State Iowa
- 83 Strongly Landlord-Friendly · R+6
- County
- — inherits STATE
- City
- — inherits STATE
ZIP-level market 50317
- Rents YoY
- 2.3%
- Active inventory
- 362
- Price-to-rent
- 7.8×
Monthly cashflow live
- Estimated rent
- $1,210 high interval (Pro) →
- Mortgage (P&I)
- −$597
- Tax from tax record
- −$169 /mo · $2,024/yr
- Insurance
- −$47
- HOA
- −$0
- Vacancy / Maint / Mgmt
- −$254
- Net cashflow
- $143
Break-even live
Sensitivity live
| Price | -10% $207 | -5% $175 | +0% $143 | +5% $111 | +10% $78 |
|---|---|---|---|---|---|
| Rent | -10% $47 | -5% $95 | +0% $143 | +5% $191 | +10% $238 |
| Rate | -1.0pp $200 | -0.5pp $172 | base $143 | +0.5pp $113 | +1.0pp $83 |
UW: 25.0% down · 7.5% · 30yr · 1.5% tax · 5.0% vac · 8.0% maint · 8.0% mgmt
Financing live
Cash to close
- Down payment
- $28,475
- Closing costs
- $3,417
- Reserves months
- —
- Total cash needed
- —
Loan-product check · same deal, 3 products live
Conventional
25% down · 7.5% · 30yr
- Down + closing
- —
- Monthly P&I
- —
- Monthly cashflow
- —
- DSCR
- —
- Eligible?
- —
Personal DTI + credit; lowest rate.
DSCR
20% down · 8.5% · 30yr
- Down + closing
- —
- Monthly P&I
- —
- Monthly cashflow
- —
- DSCR
- —
- Eligible?
- —
No personal income docs; deal must DSCR.
Hard money
10% down · 12.0% · 12mo
- Down + closing
- —
- Monthly P&I
- —
- Monthly cashflow
- —
- DSCR
- —
- Eligible?
- —
Short-term bridge; refi at stabilization.
Rent comps 13 comps
| Address | Beds | Baths | Sqft | Rent | $/sqft | DOM | Units | Dist |
|---|---|---|---|---|---|---|---|---|
| 1726 E 24th St Des Moines, IA | 3.0 | 1.0 | 850 | $1,295 | $1.52 | 45d | 1 | 0.49mi |
| 2121 E 23rd St Des Moines, IA | 3.0 | 1.0 | 972 | $1,395 | $1.44 | 45d | 1 | 0.67mi |
| 1713 Lyon St Des Moines, IA | 3.0 | 1.0 | 834 | $1,045 | $1.25 | 23d | 1 | 0.72mi |
| 2120 Capitol Ave Des Moines, IA | 3.0 | 1.0 | 973 | $1,395 | $1.43 | 45d | 1 | 0.73mi |
| 410 E 17th St Des Moines, IA | 3.0 | 1.0 | 1000 | $1,695 | $1.70 | 45d | 1 | 0.86mi |
| 1364 Idaho St Des Moines, IA | 2.0 | 1.0 | 804 | $1,195 | $1.49 | 25d | 1 | 0.95mi |
| 1525 Des Moines St Des Moines, IA | 3.0 | 1.0 | 928 | $1,195 | $1.29 | 45d | 1 | 0.97mi |
| 1513 Des Moines St Des Moines, IA | 3.0 | 1.0 | 900 | $995 | $1.11 | 25d | 1 | 1.00mi |
| 2726 Des Moines St Des Moines, IA | 2.0 | 1.0 | 975 | $1,295 | $1.33 | 45d | 1 | 1.03mi |
| 1441 Capitol Ave Apt 16 Des Moines, IA | 1.0 | 1.0 | 650 | $550 | $0.85 | 16d | 1 | 1.14mi |
| 1419 Capitol Ave Des Moines, IA | 1.0 | 1.0 | 680 | $750 | $1.10 | 25d | 1 | 1.19mi |
| 1301 E 12th St Unit 2 Des Moines, IA | 2.0 | 1.0 | 995 | $795 | $0.80 | 25d | 1 | 1.23mi |
| 922 Walker St Des Moines, IA | 3.0 | 1.0 | 864 | $1,295 | $1.50 | 25d | 1 | 1.39mi |
Listing history 36 events
-
2026-06-21days on market $113,900 Active 54 DOM
-
2026-06-18days on market $113,900 Active 51 DOM
-
2026-06-17days on market $113,900 Active 50 DOM
-
2026-06-16days on market $113,900 Active 49 DOM
-
2026-06-15days on market $113,900 Active 48 DOM
-
2026-06-14days on market $113,900 Active 46 DOM
-
2026-06-13days on market $113,900 Active 45 DOM
-
2026-06-10days on market $113,900 Active 43 DOM
-
2026-06-09days on market $113,900 Active 42 DOM
-
2026-06-09price $113,900 Active 41 DOM
-
2026-06-08days on market $119,000 Active 41 DOM
-
2026-06-07days on market $119,000 Active 40 DOM
-
2026-06-05days on market $119,000 Active 37 DOM
-
2026-06-03days on market $119,000 Active 36 DOM
-
2026-06-02days on market $119,000 Active 35 DOM
-
2026-06-01days on market $119,000 Active 34 DOM
-
2026-05-31days on market $119,000 Active 33 DOM
-
2026-05-31days on market $119,000 Active 32 DOM
-
2026-05-06price $119,000 426-char remark
-
2026-04-28$129,000 Active 426-char remark
-
2026-03-25status Active
-
2026-03-11historical
-
2026-02-24price $129,500
-
2026-01-23$137,000 Active
-
2022-05-09soldstatus $101,500 Closed
Show marketing remark (378 chars)
This 2 bedroom 1 bath house is the perfect starter home or investment property. The mud room at the entrance, leading into an open living room makes this home spacious and comfortable. Good sized bedrooms with an office or den feature in one. This home is move in ready! Schedule a tour today! In the event of multiple offers, all offers will be reviewed on Thursday March 24th.
-
2022-05-06soldstatus $101,500
-
2022-03-22status Pending
Show marketing remark (378 chars)
This 2 bedroom 1 bath house is the perfect starter home or investment property. The mud room at the entrance, leading into an open living room makes this home spacious and comfortable. Good sized bedrooms with an office or den feature in one. This home is move in ready! Schedule a tour today! In the event of multiple offers, all offers will be reviewed on Thursday March 24th.
-
2022-03-21$99,000 Active
Show marketing remark (378 chars)
This 2 bedroom 1 bath house is the perfect starter home or investment property. The mud room at the entrance, leading into an open living room makes this home spacious and comfortable. Good sized bedrooms with an office or den feature in one. This home is move in ready! Schedule a tour today! In the event of multiple offers, all offers will be reviewed on Thursday March 24th.
-
2021-03-23soldstatus $85,000
-
2021-03-16soldstatus $85,000 Closed
-
2021-02-03status Pending
-
2021-01-25price $87,000
-
2020-11-04price $92,000
-
2020-08-24$98,000 Active
-
2006-11-03soldstatus $40,000
-
2006-07-14$49,000
ⓘ Source: listings_history table (triggers on properties + properties_extension) + one-shot
backfill from property_details.listing_events for pre-trigger history.
Tax reassessment forecast IA · Partial reset (capped growth)
- Current annual tax
- $2,024 · $169/mo
- Projected year-2 tax
- $2,024 · $169/mo
- Expected delta
- $0/yr ($0/mo · 0.0%)
ⓘ Screening estimate from a state-policy table — verify with the county assessor before closing.
Climate risk First Street
- Flood 4/10 Moderate FEMA zone X (unshaded) · 24% chance over 30 yrs
- Wildfire 1/10 Low
- Heat 3/10 Moderate 7 d/yr ≥103°F today · 15 d/yr by 30 yrs out
- Wind 2/10 Low
- Air quality 2/10 Low 1 unhealthy d/yr today · 2 by 30 yrs out
Nearby sold comps map
Loading sold comps map…
Walkable amenities ~0.75 mi
Loading nearby amenities…
Taxation est. · year 1
- Rental income
- $14,525
- − Mortgage interest
- −$6,380
- − Property taxes
- −$2,024
- − Insurance
- −$570
- − Repairs & maintenance
- −$1,162
- − Management
- −$1,162
- − Depreciation
- −$3,313
- Taxable loss
- −$86
- Est. tax savings @ 24.0%
- +$21
- After-tax cash flow
- $1,734/yr
For passive investors: Depreciation is non-cash, so a rental often shows a tax loss while cash-flowing — sheltering income. Rental losses are passive: they offset passive income freely, and up to $25,000/yr can offset ordinary (W-2) income if you actively participate and your MAGI is under $100k (phasing out to $0 by $150k); unused losses carry forward. On sale, claimed depreciation is recaptured at up to 25%, and gains may owe capital-gains tax (a 1031 exchange can defer both). Figures are a year-1 estimate at your 24.0% rate — not tax advice; consult a CPA.
Schools (NCES district)
- District
- Des Moines Independent Community School District
- NCES district ID
- 1908970
- Math proficiency
- 43% ▼ -6.00%
- Reading proficiency
- 46% ▼ -1.00%
- Median HH income
- $45,905
- Composite
- 37.83/100
- National rank
- #4331
- State rank
- #289 of 289 in IA
Livability — Des Moines
- Score
- 81/100
- State rank
- #63
- US rank
- #1432
Category grades
Schools grade is shown separately in the Schools card above.
Census & demographics
- Census place
- Des Moines, IA
- County
- Polk County · 453,298 people
- City population
- 203,612
- Metro
- Des Moines-West Des Moines, IA
- Population (ZIP)
- 36,548
- Household income
- $65,617
- Rent vs Own
- Severe rent burden
- 716.0
Population outlook (Polk County) Hauer SSP2
- Today (2025)
- 548,042 people
- By 2030
- 588,557 · +7.4%
- By 2040
- 670,629 · +22.4%
- By 2050
- 752,830 · +37.4%
- By 2075
- 955,069 · +74.3%
- By 2100
- 1,115,436 · +103.5%
Race, ethnicity, and origin ACS 2023
- Neighborhood character
- Majority White (65%)
- Race & ethnicity
- White 65% Hispanic / Latino 19% Two or more races 10% Black 10% Asian 3%
- Hispanic origin (detail)
- Mexican 15% Puerto Rican 1%
- Common ancestry
- Portuguese 3% Iranian 2% Swiss 1%
- Foreign-born
- 12% · Canada
- Languages at home
- 80% English-only · Spanish 13% Other Asian/Pacific 2%
Political lean MEDSL · Polk
- 2024 margin
- D (+10.9) · D 54.8% · R 43.9% · Other 1.3%
- 2008→2024 swing
- -3.7pp toward R · 2008: 14.6pp · 2024: 10.9pp
- All cycles
- 2024: D+10.9 2020: D+15.2 2016: D+11.5 2012: D+14.2 2008: D+14.6
Not yet ingested
- Civics
- —
Market trends
- HPI YoY
- ▼ -235.00%
- Current HPI
- 281.7409
- Rent YoY
- ▲ 2.29%
- Metro
- Des Moines-West Des Moines, IA
- State GDP YoY
- ▲ 2.48%
- F500 in state
- 4
Industry mix (Fortune 500 HQ in IA)
| Industry | F500 HQs | Revenue |
|---|---|---|
| Financial Services | 1 | $16B |
|
||
| Retail / Convenience | 1 | $15B |
|
||
Price history
+132.4% since first listed19 events — show timeline
- 2026-06-08 Price Changed $113,900 DMMLS
- 2026-05-06 Price Changed $119,000 DMMLS
- 2026-04-28 Listed $129,000 DMMLS
- 2026-03-25 Relisted — DMMLS
- 2026-03-11 Listing Removed — DMMLS
- 2026-02-24 Price Changed $129,500 DMMLS
- 2026-01-23 Listed $137,000 DMMLS
- 2022-05-09 Sold (MLS) $101,500 DMMLS
- 2022-05-06 Sold (Public Records) $101,500 Public Records
- 2022-03-22 Pending — DMMLS
- 2022-03-21 Listed $99,000 DMMLS
- 2021-03-23 Sold (Public Records) $85,000 Public Records
- 2021-03-16 Sold (MLS) $85,000 DMMLS
- 2021-02-03 Pending — DMMLS
- 2021-01-25 Price Changed $87,000 DMMLS
- 2020-11-04 Price Changed $92,000 DMMLS
- 2020-08-24 Listed $98,000 DMMLS
- 2006-11-03 Sold (MLS) $40,000 DMMLS
- 2006-07-14 Listed $49,000 DMMLS
Property tax history
+4.4%/yrLatest (2025): $2,024 · +2.1% YoY. Source: county tax records.
Cash-flow waterfall
monthlySold comps — $/sqft
last 12 mo · ≤1 miLoading sold comps…