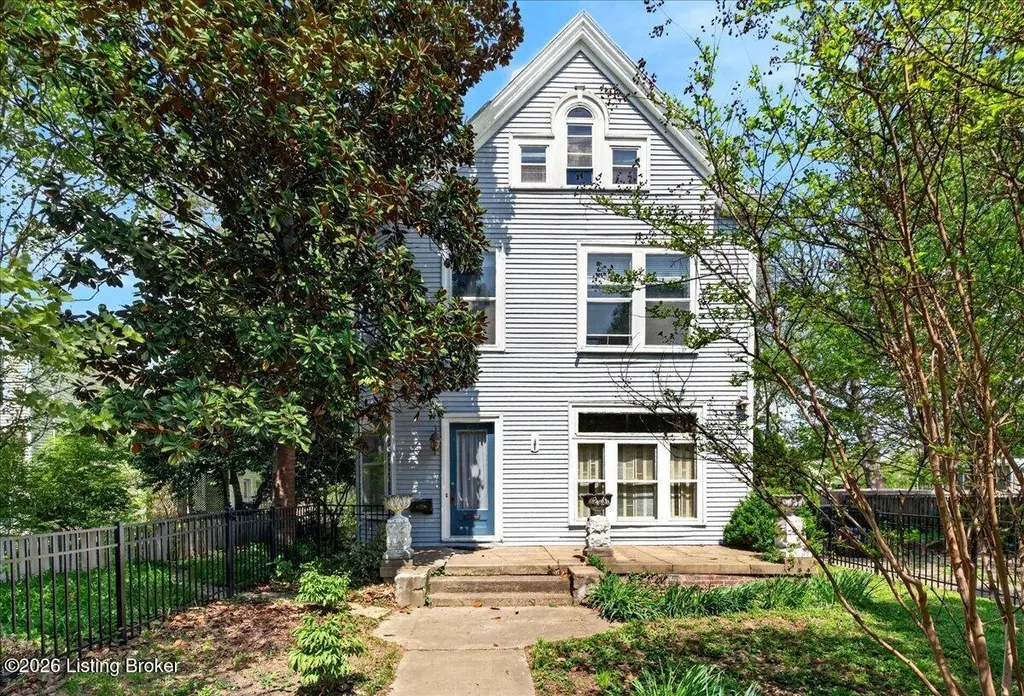
227 E Ormsby Ave · Louisville, KY
Flood risk 5/10 · Moderate
- FEMA flood zone
- X (unshaded)
- Chance of flooding over 30 yrs
- 0.53%
- Est. flood insurance / yr
- $507 – $1,088
Fire risk 1/10 · Minimal
- Est. fire insurance / yr
- $839 – $1,559
Heat risk 5/10 · Moderate
- Hot days now (above 105°F)
- 7 days/yr
- Hot days in 30 yrs
- 20 days/yr
Wind risk 2/10 · Minimal
- Chance of severe wind over 30 yrs
- 1.0%
Air-quality risk 2/10 · Minimal
- Unhealthy air days now
- 1 days/yr
- Unhealthy air days in 30 yrs
- 3 days/yr
Risk factors via First Street. Map © Google.
Why this score? — see what drove the C- grade
The composite is a weighted blend of 9 inputs, each scored 0–100. Each bar is that input's sub-score; the figure is the points it added to the 100-point composite (weight × sub-score).
- Cash flow +15.4/30.0
- ARV discount +15.0/15.0
- DSCR +4.7/10.0
- 1% rule +3.9/10.0
- Rent growth +3.4/5.0
- Livability +3.2/5.0
- Condition / age +2.5/5.0
- Schools +2.3/10.0
- Appreciation +0.0/10.0
$299,000
🖨 Deal sheet 📄 Offer letter ✓ Due diligence
Listing remarks
* NEW PRICE * Step into timeless character and endless potential in the heart of Old Louisville! This grand 3-story Victorian home is filled with charm, space, and opportunity for those ready to make it their own. From the moment you enter, you're welcomed by a stunning, statement-making staircase that sets the tone for the home's historic elegance. With three full bathrooms and a versatile layout, this home offers room to grow, create, and customize. The third-floor apartment provides a unique opportunity—perfect for an older child, guest suite, or even potential rental income. Outside, the fully fenced yard offers both privacy and function, while the spacious brick patio creates an
Key facts
- New paint
- Grand victorian home
- Spacious brick patio
Tags
Property features AI
Finance
- Other: Lot dimensions approximately 45 x 216.5; Lot area about 0.22 acres; Located in the Old Louisville subdivision
- HOA & community: No association fee
Exterior
- Utilities: Electricity connected; Natural gas available
- Home design: Single-family residence; Traditional style; 3 stories; Built in 1900
- Construction: Vinyl siding and wood frame construction; Metal roof; Living area above grade: 2,858
- Exterior features: Full wood fencing; Sidewalk; Cleared, level lot
Interior
- Kitchen: Kitchen on the third floor; Additional kitchen on the third floor (listed among rooms)
- Bedrooms: 5 bedrooms total; One bedroom on the first floor; Three bedrooms on the second floor; One bedroom on the third floor
- Bathrooms: 3 full bathrooms (including full bathrooms on the second and third levels)
- Heating & cooling: Mini-split/ductless heating; Forced air heating; Natural gas fuel; Central air conditioning
- Interior features: 11 total rooms; 5 closets; Foyer; Living room; Dining room; 1 fireplace (on first level); Basement: unfinished cellar with outside entry; Other room on second level
- Laundry & utility: Laundry on the second floor; No first-floor laundry
Neighborhood map
What this means for you Summary
Snapshot
- This is a 5-bed/3.0-bath single-family listed at $299k.
Deal economics
- At list price, monthly cash flow is $114 ($1k/yr) — positive.
- The deal already cash-flows at list — no discount required.
- To meet the 1% rule (rent ≥ 1% of price), the offer needs to be $266k (11.1% below list).
- Recommended offer: $266k (11.1% below list) — sets the bar for 1% rule.
- Cap rate 6.7% vs local median 5.0% in Louisville — top-decile yield for the area; either an underpriced asset or a hidden risk that comps aren't pricing in. Stress-test before assuming the spread holds.
Location & tenants
- Location reads 63/100 on livability (#333 in KY) — a middle-class / working-renter tenant base. Strengths: cost of living A+, housing A+; Watch: employment C-, health & safety D+, schools D-.
- Jefferson County (urban): math 19% / reading 35% proficiency, ranked #121 of 165 in KY (top 73%) — low school quality limits family demand, transient renter base, plan for 1-2y turnover.
- Market conditions: Rents rising (+3.7%/yr); 114 active listings in the ZIP; 3 comparable units currently listed for rent nearby; rentals at typical pace (median 24d on market — plan ~3-4 weeks tenant-placement turnaround); lower-income renter base — watch delinquency; 2,836 units permitted in Jefferson County in 2024 (1,558 in 5+ unit buildings).
- At $2,659/mo this rent would consume 104% of the median local household income ($31k/yr) (locally 1603% of renters already pay >50% of income on rent) — very limited rent-growth headroom before tenants either downsize or default.
Forward outlook
- Local home prices are declining (-3.0%/yr); year-one equity from $2k of loan paydown is wiped out by about $9k of value loss. Plan a longer hold.
- Jefferson County population projected at +13% by 2050 — modest demand growth; plan on rents tracking national, not racing it.
Negotiation context
- It's been on market 65 days — a 6% lower offer ($281k) is reasonable based on typical stale-listing flexibility.
- 9 sale attempts since 28y ago; this cycle's ask has dropped $41k (12%) from the opening price — seller is motivated, your offer sets the floor, not the list.
Risks & watch-outs
- Watch-outs: built in 1900 — expect roof / HVAC / electrical / plumbing capex.
- Climate carrying-cost: moderate flood risk; extreme-heat days projected 7→20/yr by 2055 (HVAC capex compounding) — expect insurance premiums to compound above CPI over the hold.
Questions for the listing agent
- It's been on market 65 days. Have you received any prior offers? Is the seller open to a 11% concession, seller financing, or rate buy-down credit?
- Built in 1900 — when were the roof, HVAC, electrical panel, plumbing, and water heater last replaced?
- Why hasn't it sold? Are there any deal-killer items the seller is aware of (foundation, flood, title, zoning, code violations)?
- Is there a deadline driving the sale (1031 exchange, divorce, estate, relocation)? That informs how much negotiation room exists.
- Schools are D-rated, which usually means shorter tenancies and higher turnover. Who's the typical renter profile here, and what's been the actual vacancy rate?
- Crime grade is F in this area — have there been break-ins, vandalism, or insurance claims at this property in the last 3 years? What carrier currently insures it and at what premium?
- What's the average days-on-market for RENTAL listings here right now (not sales)? A rising rental-DOM trend means longer vacancies and softer asking-rent achievability than the comps imply.
- What's the recent tenant-quality profile in this submarket — average credit score on applications, eviction rate, late-payment / NSF rate, and stable-employment percentage? A property-management company in the area should have these aggregated.
- How much new for-sale + rental construction is in the pipeline within 1–3 miles? Heavy new supply typically softens prices + rents 12–24 months out; constrained supply supports both.
Investment metrics
- 1% rule
- 0.89% ✗
- Cap rate
- 6.75%
- Cash-on-cash
- 1.63%
- DSCR
- 1.07
- GRM
- 9.4
CMA / ARV
- ARV (on-the-fly)
- $425,842
- Comps found
- 12
Show comp detail 12 sales within ~0.75 mi
| Address | Dist | Beds/Ba | Sqft | Sold | Price | $/sf | Match |
|---|---|---|---|---|---|---|---|
| 1315 S 1st St | 0.16mi | 4/4.0 (-1) | 2,875 (+1%) | 8mo | $585,000 | $203 | 76 |
| 1324 S 1st St | 0.18mi | 4/2.5 (-1) | 2,902 (+2%) | 10mo | $201,300 | $69 | 74 |
| 420 E Oak St | 0.29mi | 5/3.5 | 2,625 (-8%) | 13mo | $215,000 | $82 | 60 |
| 1332 S 2nd St | 0.28mi | 5/3.0 | 3,162 (+11%) | 12mo | $530,900 | $168 | 59 |
| 1476 S 2nd St | 0.51mi | 4/3.0 (-1) | 2,850 (-0%) | 15mo | $340,000 | $119 | 58 |
| 1380 Ouerbacker Ct | 0.25mi | 4/3.0 (-1) | 2,553 (-11%) | 9mo | $449,500 | $176 | 58 |
| 1307 S First St | 0.15mi | 4/3.5 (-1) | 3,189 (+12%) | 15mo | $475,000 | $149 | 54 |
| 1352 S 6th St | 0.64mi | 4/3.5 (-1) | 3,020 (+6%) | 1mo | $565,000 | $187 | 52 |
| 529 W St Catherine St | 0.65mi | 4/2.5 (-1) | 2,950 (+3%) | 6mo | $450,000 | $153 | 52 |
| 1014 S Brook St | 0.40mi | 4/2.0 (-1) | 2,549 (-11%) | 11mo | $120,000 | $47 | 45 |
| 1208 S 2nd St | 0.30mi | 4/2.0 (-1) | 3,261 (+14%) | 15mo | $455,000 | $140 | 41 |
| 1440 S 2nd St | 0.44mi | 4/3.5 (-1) | 3,219 (+13%) | 14mo | $460,000 | $143 | 40 |
Match score weights: distance 35% · size 25% · config 20% · recency 20%. Top-matched comps best support the ARV.
Projected returns pro-forma
-3.0% appreciation · 3.73% rent growth · sell at horizon
- IRR
- -12.9%
- Equity multiple
- 0.53×
- Total profit
- $-39,240
- Equity at exit
- $44,582
- IRR
- -2.9%
- Equity multiple
- 0.80×
- Total profit
- $-16,674
- Equity at exit
- $25,852
Cash invested: $83,720 (down + closing). Projections, not guarantees.
Landlord ↔ Tenant lean methodology
- Overall (STATE)
- 83 Strongly Landlord-Friendly
- State Kentucky
- 83 Strongly Landlord-Friendly · R+16
- County
- — inherits STATE
- City
- — inherits STATE
ZIP-level market 40203
- Home prices YoY
- -13.8%
- Rents YoY
- 3.7%
- Active inventory
- 114
- Price-to-rent
- 9.4×
Monthly cashflow live
- Estimated rent
- $2,659 medium interval (Pro) →
- Mortgage (P&I)
- −$1,568
- Tax from tax record
- −$294 /mo · $3,528/yr
- Insurance
- −$125
- HOA
- −$0
- Vacancy / Maint / Mgmt
- −$558
- Net cashflow
- $114
Break-even live
UW: 25.0% down · 7.5% · 30yr · 1.5% tax · 5.0% vac · 8.0% maint · 8.0% mgmt
Financing live
Cash to close
- Down payment
- $74,750
- Closing costs
- $8,970
- Reserves months
- —
- Total cash needed
- —
Loan-product check · same deal, 3 products live
Conventional
25% down · 7.5% · 30yr
- Down + closing
- —
- Monthly P&I
- —
- Monthly cashflow
- —
- DSCR
- —
- Eligible?
- —
Personal DTI + credit; lowest rate.
DSCR
20% down · 8.5% · 30yr
- Down + closing
- —
- Monthly P&I
- —
- Monthly cashflow
- —
- DSCR
- —
- Eligible?
- —
No personal income docs; deal must DSCR.
Hard money
10% down · 12.0% · 12mo
- Down + closing
- —
- Monthly P&I
- —
- Monthly cashflow
- —
- DSCR
- —
- Eligible?
- —
Short-term bridge; refi at stabilization.
Rent comps 3 comps
| Address | Beds | Baths | Sqft | Rent | $/sqft | DOM | Units | Dist |
|---|---|---|---|---|---|---|---|---|
| 1375 S 1st St Louisville, KY | 4.0 | 3.0 | 2470 | $2,400 | $0.97 | 24d | 1 | 0.26mi |
| 1451 S 2nd St Louisville, KY | 4.0 | 3.5 | 3983 | $4,200 | $1.05 | 24d | 1 | 0.45mi |
| 829 E Chestnut St Louisville, KY | 4.0 | 3.5 | 2268 | $3,300 | $1.46 | 10d | 1 | 1.33mi |
Listing history 37 events
-
2026-06-18days on market $299,000 Active 65 DOM
-
2026-06-17days on market $299,000 Active 64 DOM
-
2026-06-16days on market $299,000 Active 63 DOM
-
2026-06-15days on market $299,000 Active 62 DOM
-
2026-06-13pricestatusdays on market $299,000 Active 60 DOM
-
2026-06-10days on market $303,000 Active Under Contract 57 DOM
-
2026-06-09days on market $303,000 Active Under Contract 56 DOM
-
2026-06-08days on market $303,000 Active Under Contract 55 DOM
-
2026-06-07days on market $303,000 Active Under Contract 54 DOM
-
2026-06-03days on market $303,000 Active Under Contract 50 DOM
-
2026-06-02days on market $303,000 Active Under Contract 49 DOM
-
2026-06-01days on market $303,000 Active Under Contract 48 DOM
-
2026-05-31days on market $303,000 Active Under Contract 47 DOM
-
2026-05-20price $303,000
-
2026-05-12price $313,000
-
2026-05-04price $325,000
-
2026-04-14$339,900 Active
-
2024-08-19historical
-
2024-06-28status Active
-
2024-06-19historical Active Under Contract
-
2024-06-17$325,000 Active
-
2023-01-13historical
-
2022-11-21price $320,000
-
2022-11-21$299,999 Active
-
2022-11-21price $299,999
-
2020-12-29soldstatus $284,900
-
2020-12-18soldstatus $284,900 Closed
-
2020-11-19status Pending
-
2020-11-16$284,900 Active
-
2012-06-22soldstatus $46,000
-
2012-06-01historical
-
2012-06-01$45,000
-
2011-11-22$45,000
-
2011-11-16historical
-
2011-08-15$81,000
-
1998-08-14soldstatus $152,000
-
1998-06-20$157,900
ⓘ Source: listings_history table (triggers on properties + properties_extension) + one-shot
backfill from property_details.listing_events for pre-trigger history.
Tax reassessment forecast KY · Resets to sale price
- Current annual tax
- $3,528 · $294/mo
- Projected year-2 tax
- $3,528 · $294/mo
- Expected delta
- $0/yr ($0/mo · 0.0%)
ⓘ Screening estimate from a state-policy table — verify with the county assessor before closing.
Climate risk First Street
- Flood 5/10 Major FEMA zone X (unshaded) · 53% chance over 30 yrs
- Wildfire 1/10 Low
- Heat 5/10 Major 7 d/yr ≥105°F today · 20 d/yr by 30 yrs out
- Wind 2/10 Low 100% chance of damaging wind over 30 yrs
- Air quality 2/10 Low 1 unhealthy d/yr today · 3 by 30 yrs out
Nearby sold comps map
Loading sold comps map…
Walkable amenities ~0.75 mi
Loading nearby amenities…
Taxation est. · year 1
- Rental income
- $31,906
- − Mortgage interest
- −$16,749
- − Property taxes
- −$3,528
- − Insurance
- −$1,495
- − Repairs & maintenance
- −$2,552
- − Management
- −$2,552
- − Depreciation
- −$8,698
- Taxable loss
- −$3,669
- Est. tax savings @ 24.0%
- +$881
- After-tax cash flow
- $2,247/yr
For passive investors: Depreciation is non-cash, so a rental often shows a tax loss while cash-flowing — sheltering income. Rental losses are passive: they offset passive income freely, and up to $25,000/yr can offset ordinary (W-2) income if you actively participate and your MAGI is under $100k (phasing out to $0 by $150k); unused losses carry forward. On sale, claimed depreciation is recaptured at up to 25%, and gains may owe capital-gains tax (a 1031 exchange can defer both). Figures are a year-1 estimate at your 24.0% rate — not tax advice; consult a CPA.
Schools (NCES district)
- District
- Jefferson County
- NCES district ID
- 2102990
- Math proficiency
- 19% ▼ -17.00%
- Reading proficiency
- 35% ▼ -11.00%
- Median HH income
- $47,885
- Composite
- 23.45/100
- National rank
- #7884
- State rank
- #121 of 165 in KY
Livability — Louisville
- Score
- 63/100
- State rank
- #333
- US rank
- #15887
Category grades
Schools grade is shown separately in the Schools card above.
Census & demographics
- Census place
- Louisville, KY
- County
- Jefferson County · 790,184 people
- City population
- 769,292
- Metro
- Louisville/Jefferson County, KY-IN
- Population (ZIP)
- 17,742
- Household income
- $30,794
- Rent vs Own
- Severe rent burden
- 1603.0
Population outlook (Jefferson County) Hauer SSP2
- Today (2025)
- 823,112 people
- By 2030
- 849,343 · +3.2%
- By 2040
- 895,696 · +8.8%
- By 2050
- 933,630 · +13.4%
- By 2075
- 1,028,262 · +24.9%
- By 2100
- 1,072,675 · +30.3%
Race, ethnicity, and origin ACS 2023
- Neighborhood character
- Diverse neighborhood (Simpson 0.56)
- Race & ethnicity
- Black 49% White 44% Two or more races 4% Hispanic / Latino 3%
- Common ancestry
- Slovak 2% Lithuanian 2% Romanian 1%
- Foreign-born
- 3% · Canada
- Languages at home
- 97% English-only · Spanish 2%
Political lean MEDSL · Jefferson
- 2024 margin
- D (+16.6) · D 57.4% · R 40.9% · Other 1.7%
- 2008→2024 swing
- +4.5pp toward D · 2008: 12.0pp · 2024: 16.6pp
- All cycles
- 2024: D+16.6 2020: D+20.1 2016: D+13.3 2012: D+11.1 2008: D+12.0
Not yet ingested
- Civics
- —
Market trends
- HPI YoY
- ▼ -64.74%
- Current HPI
- 405.1872
- Rent YoY
- ▲ 3.73%
- Metro
- Louisville/Jefferson County, KY-IN
- State GDP YoY
- ▲ 1.81%
- F500 in state
- 4
Industry mix (Fortune 500 HQ in KY)
| Industry | F500 HQs | Revenue |
|---|---|---|
| Healthcare | 1 | $118B |
|
||
| Food / Beverage | 1 | $7B |
|
||
Price history
+91.9% since first listed24 events — show timeline
- 2026-05-20 Price Changed $303,000 Metro Search MLS
- 2026-05-12 Price Changed $313,000 Metro Search MLS
- 2026-05-04 Price Changed $325,000 Metro Search MLS
- 2026-04-14 Listed $339,900 Metro Search MLS
- 2024-08-19 Listing Removed — Metro Search MLS
- 2024-06-28 Relisted — Metro Search MLS
- 2024-06-19 Contingent — Metro Search MLS
- 2024-06-17 Listed $325,000 Metro Search MLS
- 2023-01-13 Listing Removed — Metro Search MLS
- 2022-11-21 Price Changed $299,999 Metro Search MLS
- 2022-11-21 Listed $299,999 Metro Search MLS
- 2022-11-21 Price Changed $320,000 Metro Search MLS
- 2020-12-29 Sold (Public Records) $284,900 Public Records
- 2020-12-18 Sold (MLS) $284,900 Metro Search MLS
- 2020-11-19 Pending — Metro Search MLS
- 2020-11-16 Listed $284,900 Metro Search MLS
- 2012-06-22 Sold (MLS) $46,000 Metro Search MLS
- 2012-06-01 Listed $45,000 Metro Search MLS
- 2012-06-01 Listing Removed — Metro Search MLS
- 2011-11-22 Listed $45,000 Metro Search MLS
- 2011-11-16 Listing Removed — Metro Search MLS
- 2011-08-15 Listed $81,000 Metro Search MLS
- 1998-08-14 Sold (MLS) $152,000 Metro Search MLS
- 1998-06-20 Listed $157,900 Metro Search MLS
Property tax history
+3.7%/yrLatest (2025): $3,528 · -1.9% YoY. Source: county tax records.
Cash-flow waterfall
monthlySold comps — $/sqft
last 12 mo · ≤1 miLoading sold comps…