 Multi-family
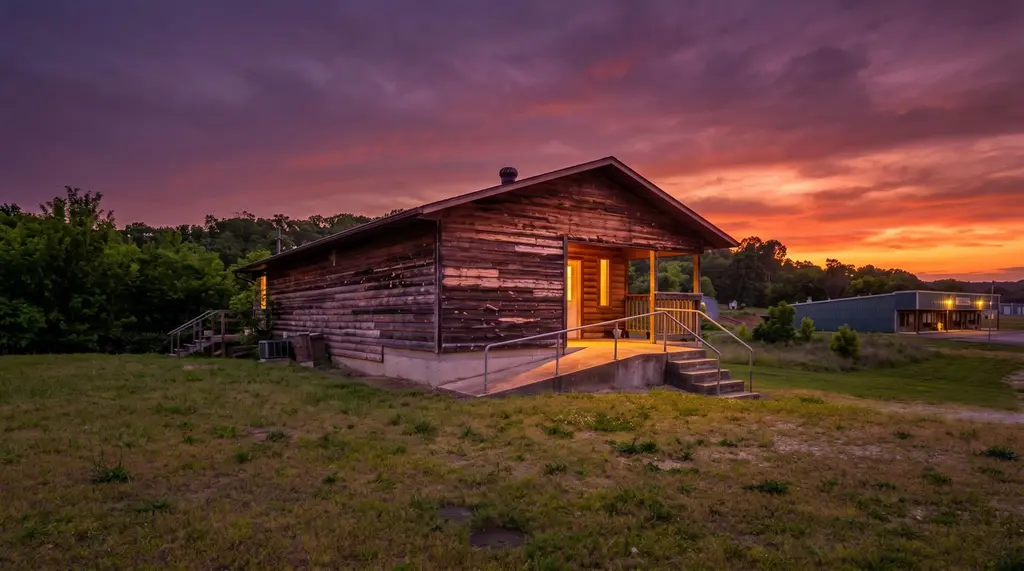
000 Highway 63 · Mammoth Spring, AR
Flood risk No data
- FEMA flood zone
- —
- Chance of flooding over 30 yrs
- —
- Est. flood insurance / yr
- —
Fire risk No data
- Est. fire insurance / yr
- —
Heat risk No data
- Hot days now (above threshold)
- —
- Hot days in 30 yrs
- —
Wind risk No data
- Chance of severe wind over 30 yrs
- —
Air-quality risk No data
- Unhealthy air days now
- —
- Unhealthy air days in 30 yrs
- —
Risk factors via First Street. Map © Google.
Why this score? — see what drove the C- grade
The composite is a weighted blend of 9 inputs, each scored 0–100. Each bar is that input's sub-score; the figure is the points it added to the 100-point composite (weight × sub-score).
- Cash flow +14.3/30.0
- Appreciation +8.5/10.0
- ARV discount +7.5/15.0
- DSCR +4.3/10.0
- 1% rule +4.0/10.0
- Livability +3.9/5.0
- Schools +2.9/10.0
- Rent growth +2.5/5.0
- Condition / age +2.2/5.0
$115,000
🖨 Deal sheet (PDF) 📄 Offer letter ✓ Due diligence
Multi-family units
County records classify this as Multi-Family (2-4 Unit). Listing-text estimate: 1 unit. estimate disagrees with records
Listing remarks MLS
5.25 +/- Acres with 200 +/- ft of US 63 frontage, community water available and approximately 1/4 of a mile from Spring River public access points! Property has nice large timber, several build sites and sits along US highway as well as gravel road access on the back side of property. Owner will consider owner financing with acceptable terms. Call today for more information!
Key facts
- Highway frontage
- Excellent visibility
- Flexible layout
Tags
Property features AI
Exterior
- Utilities: Public water; Public sewer; Propane
- Home design: Single-family residence; One level
- Construction: Wood siding and concrete construction; Asphalt roof; Finished partial basement; Basement present
- Exterior features: Front porch; Cleared lot; Has a view; Asphalt and gravel road access; Highway frontage
Interior
- Flooring: Carpet; Laminate
- Bathrooms: 1 full bathroom; 1 half bathroom
- Heating & cooling: Central heating; Propane heating; Central air conditioning; Has heating and cooling
- Interior features: High-speed internet available; Laminate countertops; Insulated double-pane windows
- Laundry & utility: Laundry located in the basement
Neighborhood map
What this means for you Summary
Snapshot
- This is a 2-bed/1.5-bath multifamily listed at $115k. Condition is rated fair.
Deal economics
- At list price, monthly cash flow is $20 ($244/yr) — positive.
- The deal already cash-flows at list — no discount required.
- To meet the 1% rule (rent ≥ 1% of price), the offer needs to be $103k (10.3% below list).
- Recommended offer: $103k (10.3% below list) — sets the bar for 1% rule.
- Cap rate 6.5% vs local median 2.8% in Mammoth Spring — top-decile yield for the area; either an underpriced asset or a hidden risk that comps aren't pricing in. Stress-test before assuming the spread holds.
Location & tenants
- Location reads 77/100 on livability (#7 in AR, #2,817 nationally) — a middle-class / working-renter tenant base. Strengths: crime A+, cost of living A+, housing A+; Watch: employment C-, amenities F, commute F.
- Mammoth Spring School District (town): math 31% / reading 39% proficiency, ranked #126 of 238 in AR (top 53%) — families likely to look elsewhere, expect single-tenant / working-renter base with shorter leases.
- Zoned schools: Mammoth Spring Elem. School (math 42% / reading 37%, grade F, #206 of 454 statewide, top 48%, 285 students, 100% FRL); Mammoth Spring High School (math 22% / reading 37%, grade F, #142 of 292 statewide, top 53%, 223 students, 100% FRL) — zoned schools average 100% FRL vs 55% district-wide (45 pts higher); higher-poverty schools than district average — tighter screening recommended.
- Market conditions: 88 active listings in the ZIP.
Forward outlook
- In year one you build about $9k of equity ($795 loan paydown + $8k appreciation (7.0% local appreciation)).
- Fulton County population projected at -17% by 2050 — secular population decline; favor cash flow + early exit over multi-decade hold.
- At projected returns (7.0% appreciation + 3.0% rent growth), your $32k cash investment doubles in ~4 years — after that, you're playing with house money.
- By year 4, paydown + projected appreciation supports a ~$30k cash-out refi (75% LTV) — recoverable capital for the next deal without selling this one.
Negotiation context
- It's been on market 23 days — a 2% lower offer ($113k) is reasonable based on typical stale-listing flexibility.
- 8 sale attempts since 8y ago with the ask held roughly flat each time — persistent listings suggest the price (not the market) is what's stuck; bring a comps-based counter.
Questions for the listing agent
- Have any recent inspections been done? Can we get a copy of the seller's disclosures and any deferred-maintenance estimates?
- Is there a deadline driving the sale (1031 exchange, divorce, estate, relocation)? That informs how much negotiation room exists.
- What's the average days-on-market for RENTAL listings here right now (not sales)? A rising rental-DOM trend means longer vacancies and softer asking-rent achievability than the comps imply.
- What's the recent tenant-quality profile in this submarket — average credit score on applications, eviction rate, late-payment / NSF rate, and stable-employment percentage? A property-management company in the area should have these aggregated.
- How much new apartment / multifamily construction is in the pipeline within 1–3 miles? Heavy new supply (>2% of stock underway) typically softens rents 12–24 months out; light construction supports rent growth.
Investment metrics
- 1% rule
- 0.90% ✗
- Cap rate
- 6.50%
- Cash-on-cash
- 0.76%
- DSCR
- 1.03
- GRM
- 9.3
CMA / ARV
No comps found within radius.
Projected returns pro-forma
6.95% appreciation · 3.0% rent growth · sell at horizon
- IRR
- 18.2%
- Equity multiple
- 2.28×
- Total profit
- $41,137
- Equity at exit
- $79,342
- IRR
- 17.5%
- Equity multiple
- 4.69×
- Total profit
- $118,668
- Equity at exit
- $150,397
Cash invested: $32,200 (down + closing). Projections, not guarantees.
Landlord ↔ Tenant lean methodology
- Overall (STATE)
- 92 Strongly Landlord-Friendly
- State Arkansas
- 92 Strongly Landlord-Friendly · R+14
- County
- — inherits STATE
- City
- — inherits STATE
ZIP-level market 72554
- Home prices YoY
- 3.3%
- Active inventory
- 88
- Price-to-rent
- 9.3×
Monthly cashflow live
- Estimated rent
- $1,032 medium interval (Pro) →
- Mortgage (P&I)
- −$603
- Tax est. 1.5%
- −$144 /mo · $1,725/yr
- Insurance
- −$48
- HOA
- −$0
- Vacancy / Maint / Mgmt
- −$217
- Net cashflow
- $20
Break-even live
Sensitivity live
| Price | -10% $100 | -5% $60 | +0% $20 | +5% $-19 | +10% $-59 |
|---|---|---|---|---|---|
| Rent | -10% $-61 | -5% $-20 | +0% $20 | +5% $61 | +10% $102 |
| Rate | -1.0pp $78 | -0.5pp $50 | base $20 | +0.5pp $-9 | +1.0pp $-40 |
UW: 25.0% down · 7.5% · 30yr · 1.5% tax · 5.0% vac · 8.0% maint · 8.0% mgmt
Financing live
Cash to close
- Down payment
- $28,750
- Closing costs
- $3,450
- Reserves months
- —
- Total cash needed
- —
Loan-product check · same deal, 3 products live
Conventional
25% down · 7.5% · 30yr
- Down + closing
- —
- Monthly P&I
- —
- Monthly cashflow
- —
- DSCR
- —
- Eligible?
- —
Personal DTI + credit; lowest rate.
DSCR
20% down · 8.5% · 30yr
- Down + closing
- —
- Monthly P&I
- —
- Monthly cashflow
- —
- DSCR
- —
- Eligible?
- —
No personal income docs; deal must DSCR.
Hard money
10% down · 12.0% · 12mo
- Down + closing
- —
- Monthly P&I
- —
- Monthly cashflow
- —
- DSCR
- —
- Eligible?
- —
Short-term bridge; refi at stabilization.
Listing history 29 events
-
2026-06-21days on market $115,000 Active 23 DOM
-
2026-06-19days on market $115,000 Active 21 DOM
-
2026-06-18days on market $115,000 Active 20 DOM
-
2026-06-17days on market $115,000 Active 19 DOM
-
2026-06-16days on market $115,000 Active 18 DOM
-
2026-06-15days on market $115,000 Active 17 DOM
-
2026-06-14days on market $115,000 Active 15 DOM
-
2026-06-12days on market $115,000 Active 14 DOM
-
2026-06-09days on market $115,000 Active 11 DOM
-
2026-06-08days on market $115,000 Active 10 DOM
-
2026-06-07days on market $115,000 Active 9 DOM
-
2026-06-07days on market $115,000 Active 8 DOM
-
2026-06-04days on market $115,000 Active 5 DOM
-
2026-06-02days on market $115,000 Active 4 DOM
-
2026-06-01days on market $115,000 Active 3 DOM
-
2026-05-31days on market $115,000 Active 2 DOM
-
2026-05-28$115,000 Active
-
2025-12-31$29,900 Active 377-char remark
Show marketing remark (377 chars)
5.25 +/- Acres with 200 +/- ft of US 63 frontage, community water available and approximately 1/4 of a mile from Spring River public access points! Property has nice large timber, several build sites and sits along US highway as well as gravel road access on the back side of property. Owner will consider owner financing with acceptable terms. Call today for more information!
-
2025-12-01$22,500 Active
-
2025-05-26$26,500 Active
-
2023-07-10soldstatus Closed
-
2023-06-22status Pending
-
2023-04-03price $25,000
-
2022-11-23$32,000 Active
-
2022-04-13soldstatus
-
2021-09-30$12,500
-
2021-06-22soldstatus
-
2021-05-19$13,500
-
2018-04-28$175,000
ⓘ Source: listings_history table (triggers on properties + properties_extension) + one-shot
backfill from property_details.listing_events for pre-trigger history.
Nearby sold comps map
Loading sold comps map…
Walkable amenities ~0.75 mi
Loading nearby amenities…
Taxation est. · year 1
- Rental income
- $12,380
- − Mortgage interest
- −$6,442
- − Property taxes
- −$1,725
- − Insurance
- −$575
- − Repairs & maintenance
- −$990
- − Management
- −$990
- − Depreciation
- −$3,345
- Taxable loss
- −$1,688
- Est. tax savings @ 24.0%
- +$405
- After-tax cash flow
- $649/yr
For passive investors: Depreciation is non-cash, so a rental often shows a tax loss while cash-flowing — sheltering income. Rental losses are passive: they offset passive income freely, and up to $25,000/yr can offset ordinary (W-2) income if you actively participate and your MAGI is under $100k (phasing out to $0 by $150k); unused losses carry forward. On sale, claimed depreciation is recaptured at up to 25%, and gains may owe capital-gains tax (a 1031 exchange can defer both). Figures are a year-1 estimate at your 24.0% rate — not tax advice; consult a CPA.
Condition & rehab AI · 13 photos
This property requires moderate repairs and maintenance to improve its condition and value. Painting the exterior and landscaping can significantly enhance its curb appeal, while updates to the kitchen and HVAC can boost both resale and rental potential.
Repairs flagged
- Moderate Kitchen cabinets — Worn condition
- Moderate Bathtub and fixtures — Signs of wear
- Moderate HVAC unit — Appears old and may need maintenance
Value-add opportunities
- Resale Painting exterior — Fresh paint can enhance curb appeal and property value.
- Resale Landscaping — Well-maintained landscaping can improve curb appeal and attract potential buyers.
- Both HVAC maintenance — Fresh HVAC can improve comfort and energy efficiency, benefiting both resale and rental value.
- Both Kitchen and bath updates — Fresh cabinets and fixtures can improve functionality and aesthetics, benefiting both resale and rental value.
Renovation cost estimate screening
| Repair item | Severity | Est. cost |
|---|---|---|
| Kitchen cabinets · Worn condition | Moderate | $3,000–15,000 |
| Bathtub and fixtures · Signs of wear | Moderate | $3,000–15,000 |
| HVAC unit · Appears old and may need maintenance | Moderate | $3,000–15,000 |
| Total estimated repair cost · 3 items | $9,000–45,000 |
Value-add ROI direction
- Resale Painting exterior — Fresh paint can enhance curb appeal and property value. ↑
- Resale Landscaping — Well-maintained landscaping can improve curb appeal and attract potential buyers. ↑
- Both HVAC maintenance — Fresh HVAC can improve comfort and energy efficiency, benefiting both resale and rental value. ↑
- Both Kitchen and bath updates — Fresh cabinets and fixtures can improve functionality and aesthetics, benefiting both resale and rental value. ↑
ⓘ Cost ranges are severity-bucket heuristics (US national rule-of-thumb). Get contractor quotes + a written scope before underwriting a rehab budget.
Schools (NCES district)
- District
- Mammoth Spring School District
- NCES district ID
- 0509270
- Math proficiency
- 31% ▼ -24.00%
- Reading proficiency
- 39% ▼ -10.00%
- Median HH income
- $32,157
- Composite
- 28.62/100
- National rank
- #6709
- State rank
- #126 of 238 in AR
Livability — Mammoth Spring
- Score
- 77/100
- State rank
- #7
- US rank
- #2817
Category grades
Schools grade is shown separately in the Schools card above.
Census & demographics
- Census place
- Mammoth Spring, AR
- Population (ZIP)
- 2,749
Population outlook (Fulton County) Hauer SSP2
- Today (2025)
- 11,739 people
- By 2030
- 11,330 · -3.5%
- By 2040
- 10,483 · -10.7%
- By 2050
- 9,717 · -17.2%
- By 2075
- 8,351 · -28.9%
- By 2100
- 6,853 · -41.6%
Race, ethnicity, and origin ACS 2023
- Neighborhood character
- Predominantly White (95%)
- Race & ethnicity
- White 95% Two or more races 5%
- Common ancestry
- Slovak 2% Serbian 1% Romanian 1%
Political lean MEDSL · Fulton
- 2024 margin
- Solid R (+62.1) · D 18.0% · R 80.1% · Other 1.9%
- 2008→2024 swing
- -43.3pp toward R · 2008: -18.9pp · 2024: -62.1pp
- All cycles
- 2024: R+62.1 2020: R+57.2 2016: R+50.7 2012: R+33.1 2008: R+18.9
Not yet ingested
- Civics
- —
Market trends
- HPI YoY
- ▲ 6.95%
- Current HPI
- 219.211
- Rent YoY
- —
- Metro
- —
- State GDP YoY
- ▲ 3.80%
- F500 in state
- 10
Industry mix (Fortune 500 HQ in AR)
| Industry | F500 HQs | Revenue |
|---|---|---|
| Retail | 1 | $681B |
|
||
| Food / Agriculture | 1 | $53B |
|
||
| Retail / Energy | 1 | $22B |
|
||
| Transportation / Logistics | 1 | $12B |
|
||
| Energy | 1 | $4B |
|
||
Price history
-34.3% since first listed13 events — show timeline
- 2026-05-28 Listed $115,000 SOMO
- 2025-12-31 Listed $29,900 SOMO
- 2025-12-01 Listed $22,500 SOMO
- 2025-05-26 Listed $26,500 SOMO
- 2023-07-10 Sold (MLS) — SOMO
- 2023-06-22 Pending — SOMO
- 2023-04-03 Price Changed $25,000 SOMO
- 2022-11-23 Listed $32,000 SOMO
- 2022-04-13 Sold (MLS) — SOMO
- 2021-09-30 Listed $12,500 SOMO
- 2021-06-22 Sold (MLS) — SOMO
- 2021-05-19 Listed $13,500 SOMO
- 2018-04-28 Listed $175,000 NEABOR MLS
Cash-flow waterfall
monthlySold comps — $/sqft
last 12 mo · ≤1 miLoading sold comps…