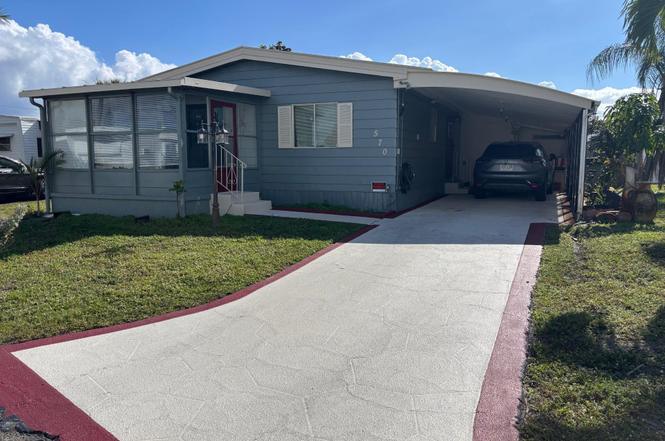
570 NE 47th Ct Lot#430 · Deerfield Beach, FL
Flood risk 4/10 · Minor
- FEMA flood zone
- X (shaded)
- Chance of flooding over 30 yrs
- 0.22%
- Est. flood insurance / yr
- $507 – $1,088
Fire risk 1/10 · Minimal
- Est. fire insurance / yr
- $947 – $1,759
Heat risk 9/10 · Severe
- Hot days now (above 107°F)
- 7 days/yr
- Hot days in 30 yrs
- 26 days/yr
Wind risk 10/10 · Severe
- Chance of severe wind over 30 yrs
- 99.0%
Air-quality risk 2/10 · Minimal
- Unhealthy air days now
- 1 days/yr
- Unhealthy air days in 30 yrs
- 3 days/yr
Risk factors via First Street. Map © Google.
Why this score? — see what drove the D+ grade
The composite is a weighted blend of 9 inputs, each scored 0–100. Each bar is that input's sub-score; the figure is the points it added to the 100-point composite (weight × sub-score).
- Cash flow +15.0/30.0
- ARV discount +7.5/15.0
- 1% rule +5.0/10.0
- DSCR +5.0/10.0
- Schools +4.1/10.0
- Livability +3.8/5.0
- Rent growth +2.9/5.0
- Condition / age +2.5/5.0
- Appreciation +0.0/10.0
$59,000
🖨 Deal sheet 📄 Offer letter ✓ Due diligence
Listing remarks
PRICE REDUCED!!! WELL MAINTAINED MANUFACTURED HOME WITH 3 BEDROOMS, 3 BATHS, 55+ COMMUNITY ONLY 3 MILES FROM DESIRABLE DEERFIELD BEACH!!! CLUBHOUSE WITH HEATED POOL AND SOCIAL ACTIVITIES. HOME IS BEING SOLD FURNISHED. LOT RENTAL $1.258.54 MONTHLY
Key facts
- Clubhouse
- Manufactured home
- Social activities
Tags
Property features AI
Finance
- Financial info: Pets allowed with breed restrictions
- HOA & community: Senior community
Exterior
- Parking: Garage (2 spaces); Attached covered carport (2 covered spaces); Carport
- Utilities: Public water; Public sewer; Sewer available; Water available
- Home design: Manufactured home; Single-story; Faces northeast; Resale condition
- Construction: Modular construction; Metal roof
- Exterior features: Porch; Not waterfront
Interior
- Kitchen: Dishwasher; Electric range; Microwave; Refrigerator
- Bedrooms: 3 bedrooms on the main level
- Flooring: Ceramic tile; Laminate
- Bathrooms: 3 full bathrooms on the main level
- Heating & cooling: Central heating; Electric cooling
- Interior features: Built-in features; Entrance foyer; Walk-in closets; Partially furnished
- Laundry & utility: Electric water heater
Neighborhood map
What this means for you Summary
Snapshot
- This is a 3-bed/3.0-bath manufactured listed at $59k.
Deal economics
- At list price, monthly cash flow is $2k ($23k/yr) — positive.
- The deal already cash-flows at list — no discount required.
- Meets the 1% rule at list price ($3k rent vs $59k).
- Recommended offer: $52k (12.0% below list) — sets the bar for market timing.
- Cap rate 46.0% vs local median 4.2% in Deerfield Beach — top-decile yield for the area; either an underpriced asset or a hidden risk that comps aren't pricing in. Stress-test before assuming the spread holds.
Location & tenants
- Location reads 75/100 on livability (#250 in FL, #3,970 nationally) — a middle-class / working-renter tenant base. Strengths: housing A+, health & safety A+, cost of living A; Watch: schools D-, amenities D-, employment D-.
- Broward (suburban): math 42% / reading 53% proficiency, ranked #46 of 73 in FL (top 63%) — families likely to look elsewhere, expect single-tenant / working-renter base with shorter leases.
- Market conditions: Rents rising (+1.8%/yr); 591 active listings in the ZIP; 40 comparable units currently listed for rent nearby; rentals at typical pace (median 18d on market — plan ~3-4 weeks tenant-placement turnaround); 2,111 units permitted in Broward County in 2024 (1,265 in 5+ unit buildings).
- At $2,990/mo this rent would consume 50% of the median local household income ($71k/yr) (locally 2907% of renters already pay >50% of income on rent) — very limited rent-growth headroom before tenants either downsize or default.
Forward outlook
- Local home prices are declining (-3.0%/yr); year-one equity from $408 of loan paydown is wiped out by about $2k of value loss. Plan a longer hold.
- Broward County population projected at +34% by 2050 — long-run rental-demand tailwind backs the buy-and-hold thesis.
- At projected returns (-3.0% appreciation + 1.8% rent growth), your $17k cash investment doubles in ~1 year — after that, you're playing with house money.
Negotiation context
- It's been on market 155 days — a 12% lower offer ($52k) is reasonable based on typical stale-listing flexibility.
- 2 sale attempts since 2y ago; this cycle's ask has dropped $9k (13%) from the opening price — seller is motivated, your offer sets the floor, not the list.
Risks & watch-outs
- Climate carrying-cost: severe wind risk, 99% chance of damaging wind over 30y; extreme-heat days projected 7→26/yr by 2055 (HVAC capex compounding) — expect insurance premiums to compound above CPI over the hold.
Questions for the listing agent
- It's been on market 155 days. Have you received any prior offers? Is the seller open to a 12% concession, seller financing, or rate buy-down credit?
- Why hasn't it sold? Are there any deal-killer items the seller is aware of (foundation, flood, title, zoning, code violations)?
- Is there a deadline driving the sale (1031 exchange, divorce, estate, relocation)? That informs how much negotiation room exists.
- Schools are D-rated, which usually means shorter tenancies and higher turnover. Who's the typical renter profile here, and what's been the actual vacancy rate?
- The area grade is low — what's the realistic commute time and amenity access for the typical tenant pool here? Any planned neighborhood developments (good or bad) we should know about?
- What's the average days-on-market for RENTAL listings here right now (not sales)? A rising rental-DOM trend means longer vacancies and softer asking-rent achievability than the comps imply.
- What's the recent tenant-quality profile in this submarket — average credit score on applications, eviction rate, late-payment / NSF rate, and stable-employment percentage? A property-management company in the area should have these aggregated.
- How much new for-sale + rental construction is in the pipeline within 1–3 miles? Heavy new supply typically softens prices + rents 12–24 months out; constrained supply supports both.
Investment metrics
- 1% rule
- 5.07% ✓
- Cap rate
- 46.04%
- Cash-on-cash
- 141.95%
- DSCR
- 7.32
- GRM
- 1.6
CMA / ARV
No comps found within radius.
Projected returns pro-forma
-3.0% appreciation · 1.75% rent growth · sell at horizon
- IRR
- —
- Equity multiple
- 7.73×
- Total profit
- $111,236
- Equity at exit
- $8,797
- IRR
- —
- Equity multiple
- 15.68×
- Total profit
- $242,453
- Equity at exit
- $5,101
Cash invested: $16,520 (down + closing). Projections, not guarantees.
Landlord ↔ Tenant lean methodology
- Overall (STATE)
- 87 Strongly Landlord-Friendly
- State Florida
- 87 Strongly Landlord-Friendly · R+3
- County
- — inherits STATE
- City
- — inherits STATE
ZIP-level market 33064
- Home prices YoY
- -18.7%
- Rents YoY
- 1.8%
- Active inventory
- 591
- Price-to-rent
- 1.6×
Monthly cashflow live
- Estimated rent
- $2,990 high interval (Pro) →
- Mortgage (P&I)
- −$309
- Tax est. 1.5%
- −$74 /mo · $885/yr
- Insurance
- −$25
- HOA
- −$0
- Vacancy / Maint / Mgmt
- −$628
- Net cashflow
- $1,954
Break-even live
UW: 25.0% down · 7.5% · 30yr · 1.5% tax · 5.0% vac · 8.0% maint · 8.0% mgmt
Financing live
Cash to close
- Down payment
- $14,750
- Closing costs
- $1,770
- Reserves months
- —
- Total cash needed
- —
Loan-product check · same deal, 3 products live
Conventional
25% down · 7.5% · 30yr
- Down + closing
- —
- Monthly P&I
- —
- Monthly cashflow
- —
- DSCR
- —
- Eligible?
- —
Personal DTI + credit; lowest rate.
DSCR
20% down · 8.5% · 30yr
- Down + closing
- —
- Monthly P&I
- —
- Monthly cashflow
- —
- DSCR
- —
- Eligible?
- —
No personal income docs; deal must DSCR.
Hard money
10% down · 12.0% · 12mo
- Down + closing
- —
- Monthly P&I
- —
- Monthly cashflow
- —
- DSCR
- —
- Eligible?
- —
Short-term bridge; refi at stabilization.
Rent comps 40 comps
| Address | Beds | Baths | Sqft | Rent | $/sqft | DOM | Units | Dist |
|---|---|---|---|---|---|---|---|---|
| 378 NE 47th Pl #378 Pompano Beach, FL | 3.0 | 2.5 | 1457 | $3,000 | $2.06 | 24d | 1 | 0.13mi |
| 265 NE 46th St Deerfield Beach, FL | 2.0 | 1.0 | 1335 | $2,250 | $1.69 | 17d | 1 | 0.32mi |
| 841 NE 51st Ct Deerfield Beach, FL | 4.0 | 2.0 | 1518 | $2,850 | $1.88 | 4d | 1 | 0.46mi |
| 9 NE 44th St Unit 9 Pompano Beach, FL | 4.0 | 2.0 | 1248 | $4,050 | $3.25 | 24d | 1 | 0.55mi |
| 4030 NE 2nd Ter Deerfield Beach, FL | 3.0 | 2.0 | 1740 | $3,650 | $2.10 | 12d | 1 | 0.69mi |
| 4030 NE 2nd Ter Deerfield Beach, FL | 3.0 | 2.0 | 1740 | $3,650 | $2.10 | 15d | 1 | 0.69mi |
| 220 NW 43rd Ct Deerfield Beach, FL | 3.0 | 2.0 | 1458 | $2,700 | $1.85 | 15d | 1 | 0.77mi |
| 4211 NE 13th Ave Unit 1332459P Pompano Beach, FL | 3.0 | 2.0 | 1291 | $10,288 | $7.97 | 22d | 1 | 0.77mi |
| 1320 SW 11th Ave Unit A Deerfield Beach, FL | 2.0 | 1.0 | 2266 | $2,000 | $0.88 | 24d | 1 | 0.77mi |
| 1410 NE 43rd Ct Pompano Beach, FL | 3.0 | 1.5 | 1244 | $2,476 | $1.99 | 24d | 1 | 0.79mi |
| 220 NW 43rd St Deerfield Beach, FL | 3.0 | 2.0 | 1458 | $2,800 | $1.92 | 24d | 1 | 0.79mi |
| 510 SW 13th Pl Deerfield Beach, FL | 4.0 | 2.0 | 1236 | $3,199 | $2.59 | 24d | 1 | 0.84mi |
| 223 SW 14th Pl Deerfield Beach, FL | 3.0 | 2.0 | 1550 | $2,950 | $1.90 | 5d | 1 | 0.85mi |
| 1330 NE 41st Dr Unit 1 Pompano Beach, FL | 2.0 | 2.0 | 1280 | $3,300 | $2.58 | 5d | 1 | 0.86mi |
| 1601 NE 47th St Pompano Beach, FL | 4.0 | 2.0 | 1416 | $2,999 | $2.12 | 10d | 1 | 0.89mi |
| 1433 NE 53rd Ct Pompano Beach, FL | 3.0 | 2.0 | 1225 | $3,950 | $3.22 | 24d | 1 | 0.89mi |
| 1230 SW 6th Ave Deerfield Beach, FL | 4.0 | 2.0 | 1236 | $2,965 | $2.40 | 3d | 1 | 0.92mi |
| 4771 NE 17th Ave Pompano Beach, FL | 3.0 | 1.0 | 1400 | $2,750 | $1.96 | 7d | 1 | 0.93mi |
| 4120 NW 3rd Way Deerfield Beach, FL | 4.0 | 2.0 | 1401 | $3,600 | $2.57 | 17d | 1 | 0.94mi |
| 3850 NE 12th Ter Pompano Beach, FL | 3.0 | 2.0 | 1528 | $4,200 | $2.75 | 15d | 1 | 0.95mi |
| 3850 NE 12th Ter Pompano Beach, FL | 3.0 | 2.0 | 1528 | $4,200 | $2.75 | 16d | 1 | 0.95mi |
| 1757 NE 49th Ct Pompano Beach, FL | 3.0 | 2.0 | 1671 | $2,150 | $1.29 | 3d | 1 | 0.98mi |
| 4313 NW 6th Ave Deerfield Beach, FL | 3.0 | 2.0 | 1348 | $2,850 | $2.11 | 22d | 1 | 1.00mi |
| 521 SW 11th Dr Deerfield Beach, FL | 3.0 | 2.0 | 1298 | $2,950 | $2.27 | 22d | 1 | 1.00mi |
| 1832 NE 49th St Pompano Beach, FL | 3.0 | 2.0 | 1400 | $2,600 | $1.86 | 24d | 1 | 1.08mi |
| 1741 NE 52nd St Pompano Beach, FL | 3.0 | 2.0 | 1243 | $2,500 | $2.01 | 24d | 1 | 1.09mi |
| 2246 Discovery Cir W Deerfield Beach, FL | 2.0 | 2.5 | 1300 | $2,650 | $2.04 | 24d | 1 | 1.16mi |
| 3951 NE 17th Ave #703 Pompano Beach, FL | 2.0 | 2.0 | 1250 | $2,500 | $2.00 | 7d | 1 | 1.17mi |
| 2149 Discovery Cir W Unit 1 Deerfield Beach, FL | 2.0 | 2.5 | 1300 | $2,850 | $2.19 | 22d | 1 | 1.18mi |
| 4344 NW 9th Ave Unit 10-2B Pompano Beach, FL | 2.0 | 2.0 | 1290 | $1,730 | $1.34 | 24d | 1 | 1.18mi |
| 4314 NW 9th Ave Deerfield Beach, FL | 1.0–2.0 | 1.5–2.0 | 992 | $1,940 | $1.95 | 15d | 2 | 1.18mi |
| 4411 N Federal Hwy Pompano Beach, FL | 1.0–3.0 | 1.0–2.0 | 1039 | $2,885 | $2.78 | 1d | 20 | 1.19mi |
| 4611 N Federal Hwy Pompano Beach, FL | 1.0–3.0 | 1.0–2.0 | 969 | $3,122 | $3.22 | 1d | 9 | 1.20mi |
| 1309 SE 1st Way Deerfield Beach, FL | 3.0 | 2.0 | 1273 | $3,500 | $2.75 | 24d | 1 | 1.21mi |
| 2217 Discovery Cir W Deerfield Beach, FL | 2.0 | 2.5 | 1429 | $2,400 | $1.68 | 15d | 1 | 1.22mi |
| 1100 S Military Trl Deerfield Beach, FL | 2.0–3.0 | 1.0–2.0 | 1119 | $2,828 | $2.53 | 24d | 2 | 1.23mi |
| 3743 NE 16th Ter Pompano Beach, FL | 3.0 | 2.0 | 1806 | $3,400 | $1.88 | 2d | 1 | 1.23mi |
| 1741 NE 39th St Pompano Beach, FL | 3.0 | 2.0 | 2072 | $3,500 | $1.69 | 24d | 1 | 1.24mi |
| 223 SE 14th Pl Deerfield Beach, FL | 3.0 | 2.0 | 1413 | $2,900 | $2.05 | 24d | 1 | 1.25mi |
| 223 SE 14th Pl Deerfield Beach, FL | 3.0 | 2.0 | 1413 | $2,900 | $2.05 | 4d | 1 | 1.25mi |
Listing history 16 events
-
2026-06-13statusdays on market $59,000 Pending 155 DOM
-
2026-06-09days on market $59,000 Active 153 DOM
-
2026-06-07days on market $59,000 Active 151 DOM
-
2026-06-04days on market $59,000 Active 148 DOM
-
2026-06-03days on market $59,000 Active 147 DOM
-
2026-06-02days on market $59,000 Active 146 DOM
-
2026-06-01days on market $59,000 Active 145 DOM
-
2026-05-31days on market $59,000 Active 144 DOM
-
2026-02-06price $59,000
-
2026-01-06$68,000 Active
-
2024-08-31historical
-
2024-07-30price $68,000
-
2024-06-21price $76,000
-
2024-04-16price $82,000
-
2024-03-07price $89,000
-
2024-02-28$98,000 Active
ⓘ Source: listings_history table (triggers on properties + properties_extension) + one-shot
backfill from property_details.listing_events for pre-trigger history.
Climate risk First Street
- Flood 4/10 Moderate FEMA zone X (shaded) · 22% chance over 30 yrs
- Wildfire 1/10 Low
- Heat 9/10 Extreme 7 d/yr ≥107°F today · 26 d/yr by 30 yrs out
- Wind 10/10 Extreme 99% chance of damaging wind over 30 yrs
- Air quality 2/10 Low 1 unhealthy d/yr today · 3 by 30 yrs out
Nearby sold comps map
Loading sold comps map…
Walkable amenities ~0.75 mi
Loading nearby amenities…
Taxation est. · year 1
- Rental income
- $35,878
- − Mortgage interest
- −$3,305
- − Property taxes
- −$885
- − Insurance
- −$295
- − Repairs & maintenance
- −$2,870
- − Management
- −$2,870
- − Depreciation
- −$1,716
- Taxable income
- $23,936
- Est. tax owed @ 24.0%
- −$5,745
- After-tax cash flow
- $17,706/yr
For passive investors: Depreciation is non-cash, so a rental often shows a tax loss while cash-flowing — sheltering income. Rental losses are passive: they offset passive income freely, and up to $25,000/yr can offset ordinary (W-2) income if you actively participate and your MAGI is under $100k (phasing out to $0 by $150k); unused losses carry forward. On sale, claimed depreciation is recaptured at up to 25%, and gains may owe capital-gains tax (a 1031 exchange can defer both). Figures are a year-1 estimate at your 24.0% rate — not tax advice; consult a CPA.
Schools (NCES district)
- District
- Broward
- NCES district ID
- 1200180
- Math proficiency
- 42% ▼ -18.00%
- Reading proficiency
- 53% ▼ -5.00%
- Median HH income
- $52,139
- Composite
- 40.88/100
- National rank
- #3621
- State rank
- #46 of 73 in FL
Livability — Deerfield Beach
- Score
- 75/100
- State rank
- #250
- US rank
- #3970
Category grades
Schools grade is shown separately in the Schools card above.
Census & demographics
- Census place
- Deerfield Beach, FL
- County
- Broward County · 1,963,430 people
- City population
- 61,449
- Metro
- Miami-Fort Lauderdale-Pompano Beach, FL
- Population (ZIP)
- 64,563
- Household income
- $71,301
- Rent vs Own
- Severe rent burden
- 2907.0
Population outlook (Broward County) Hauer SSP2
- Today (2025)
- 2,207,033 people
- By 2030
- 2,360,704 · +7.0%
- By 2040
- 2,661,208 · +20.6%
- By 2050
- 2,946,698 · +33.5%
- By 2075
- 3,602,273 · +63.2%
- By 2100
- 3,970,984 · +79.9%
Race, ethnicity, and origin ACS 2023
- Neighborhood character
- Highly diverse neighborhood (Simpson 0.75)
- Race & ethnicity
- White 34% Hispanic / Latino 27% Black 25% Two or more races 24% Asian 2%
- Hispanic origin (detail)
- Mexican 4% Puerto Rican 4% Cuban 4% Dominican 2%
- Common ancestry
- Hispanic 13% Estonian 10% Romanian 1%
- Foreign-born
- 43% · Canada, Jamaica, Dominican Republic
- Languages at home
- 45% English-only · Spanish 23% French/Haitian/Cajun 16% Other Indo-European 13%
Political lean MEDSL · Broward
- 2024 margin
- D (+17.0) · D 58.0% · R 41.0%
- 2008→2024 swing
- -17.8pp toward R · 2008: 34.7pp · 2024: 17.0pp
- All cycles
- 2024: D+17.0 2020: D+29.8 2016: D+35.0 2012: D+34.9 2008: D+34.7
Not yet ingested
- Civics
- —
Market trends
- HPI YoY
- ▼ -109.09%
- Current HPI
- 474.7007
- Rent YoY
- ▲ 1.75%
- Metro
- Miami-Fort Lauderdale-Pompano Beach, FL
- State GDP YoY
- ▲ 3.28%
- F500 in state
- 36
Industry mix (Fortune 500 HQ in FL)
| Industry | F500 HQs | Revenue |
|---|---|---|
| Industrial Technology | 2 | $29B |
|
||
| Insurance | 2 | $17B |
|
||
| Retail | 1 | $60B |
|
||
| Technology Distribution | 1 | $58B |
|
||
| Homebuilding | 1 | $35B |
|
||
| Technology Manufacturing | 1 | $35B |
|
||
Price history
-39.8% since first listed8 events — show timeline
- 2026-02-06 Price Changed $59,000 Beaches MLS
- 2026-01-06 Listed $68,000 Beaches MLS
- 2024-08-31 Listing Removed — Beaches MLS
- 2024-07-30 Price Changed $68,000 Beaches MLS
- 2024-06-21 Price Changed $76,000 Beaches MLS
- 2024-04-16 Price Changed $82,000 Beaches MLS
- 2024-03-07 Price Changed $89,000 Beaches MLS
- 2024-02-28 Listed $98,000 Beaches MLS
Cash-flow waterfall
monthlySold comps — $/sqft
last 12 mo · ≤1 miLoading sold comps…