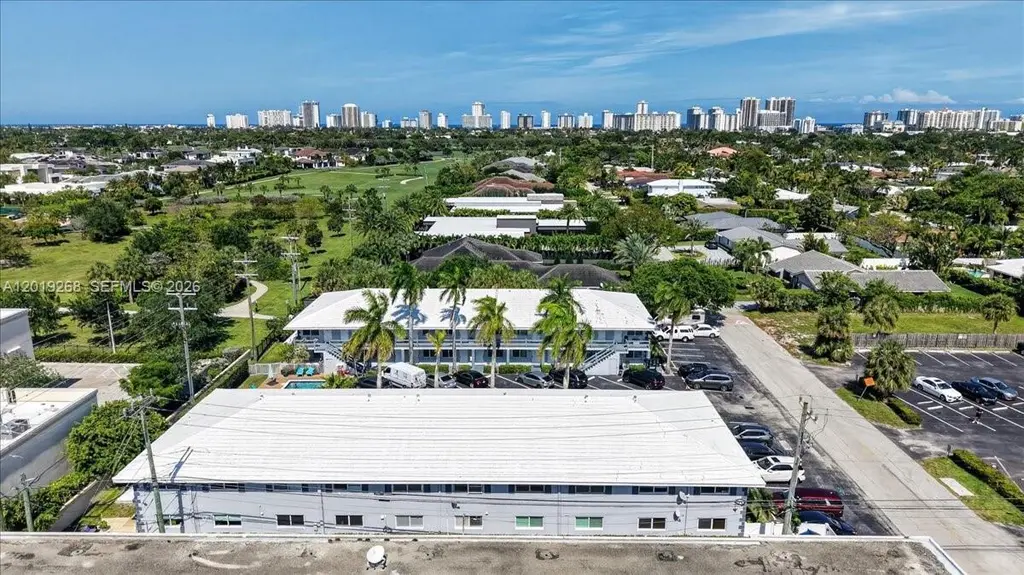
2115 NE 37th Dr #120 · Fort Lauderdale, FL
Flood risk 3/10 · Minor
- FEMA flood zone
- X (unshaded)
- Chance of flooding over 30 yrs
- 0.07%
- Est. flood insurance / yr
- $507 – $1,088
Fire risk 1/10 · Minimal
- Est. fire insurance / yr
- $947 – $1,759
Heat risk 10/10 · Severe
- Hot days now (above 105°F)
- 7 days/yr
- Hot days in 30 yrs
- 26 days/yr
Wind risk 10/10 · Severe
- Chance of severe wind over 30 yrs
- 99.0%
Air-quality risk 2/10 · Minimal
- Unhealthy air days now
- 1 days/yr
- Unhealthy air days in 30 yrs
- 2 days/yr
Risk factors via First Street. Map © Google.
Why this score? — see what drove the D+ grade
The composite is a weighted blend of 9 inputs, each scored 0–100. Each bar is that input's sub-score; the figure is the points it added to the 100-point composite (weight × sub-score).
- Cash flow +16.2/30.0
- ARV discount +7.5/15.0
- 1% rule +6.8/10.0
- DSCR +5.0/10.0
- Schools +4.1/10.0
- Livability +4.1/5.0
- Rent growth +3.4/5.0
- Condition / age +2.5/5.0
- Appreciation +0.0/10.0
$310,000
🖨 Deal sheet (PDF) 📄 Offer letter ✓ Due diligence
Listing remarks
Tucked away in the prestigious Coral Ridge enclave, 2115 NE 37 Drive presents an exceptional blend of refined coastal living and effortless sophistication. This beautifully residence showcases designer finishes throughout, featuring an expansive open-concept layout, custom cabinetry, quartz countertops, stainless steel appliances, and spa-inspired bathrooms crafted with timeless elegance. Bathed in natural light, the interiors are enhanced by sleek flooring, contemporary lighting, and thoughtfully curated details that create a warm yet elevated ambiance. Spacious bedrooms, generous storage, and in-unit laundry add comfort and convenience to this impeccably maintained home. Positioned east o
Key facts
- Custom cabinetry
- Quartz countertops
- Natural light
Tags
Property features AI
Finance
- Financial info: Monthly association fee of $550; Pets allowed with size limit (maximum 20 lbs)
- HOA & community: Monthly HOA fee; HOA covers hot water, insurance, grounds maintenance, structure maintenance, parking, and recreation facilities; Community amenities include clubhouse, golf course, barbecue area, picnic area, and pool; Located in a golf course community
Exterior
- Parking: 1 covered parking space; 1-car garage
- Security: Secured lobby
- Utilities: Cooling: Central air; Heating: Central
- Home design: Attached property; 2 stories; Entry level: 1; Effective year built
- Construction: Block construction
- Exterior features: Barbecue; Association pool
Interior
- Kitchen: Dishwasher
- Flooring: Ceramic tile
- Bathrooms: 2 full bathrooms
- Heating & cooling: Central heating; Central air conditioning
- Interior features: First-floor entry; Bedroom on main level
- Laundry & utility: Dryer; Electric water heater
Neighborhood map
What this means for you Summary
Snapshot
- This is a 2-bed/2.0-bath condo listed at $310k.
Deal economics
- At list price, monthly cash flow is $166 ($2k/yr) — positive.
- The deal already cash-flows at list — no discount required.
- Meets the 1% rule at list price ($4k rent vs $310k).
- Recommended offer: $301k (3.0% below list) — sets the bar for market timing.
- Cap rate 6.9% vs local median 2.2% in Fort Lauderdale — top-decile yield for the area; either an underpriced asset or a hidden risk that comps aren't pricing in. Stress-test before assuming the spread holds.
Location & tenants
- Location reads 82/100 on livability (#78 in FL, #1,293 nationally) — a professional / high-income tenant draw. Strengths: crime A+, amenities A+, health & safety A+; Watch: cost of living D-.
- Broward (suburban): math 42% / reading 53% proficiency, ranked #46 of 73 in FL (top 63%) — families likely to look elsewhere, expect single-tenant / working-renter base with shorter leases.
- Market conditions: Rents rising (+3.6%/yr); 739 active listings in the ZIP; 40 comparable units currently listed for rent nearby; rentals at typical pace (median 23d on market — plan ~3-4 weeks tenant-placement turnaround); solid renter incomes; 2,111 units permitted in Broward County in 2024 (1,265 in 5+ unit buildings).
- At $3,648/mo this rent would consume 47% of the median local household income ($94k/yr) (locally 912% of renters already pay >50% of income on rent) — very limited rent-growth headroom before tenants either downsize or default.
Forward outlook
- Local home prices are declining (-3.0%/yr); year-one equity from $2k of loan paydown is wiped out by about $9k of value loss. Plan a longer hold.
- Broward County population projected at +34% by 2050 — long-run rental-demand tailwind backs the buy-and-hold thesis.
Negotiation context
- It's been on market 35 days — a 3% lower offer ($301k) is reasonable based on typical stale-listing flexibility.
- Current owner paid $60k; list at $310k implies a 417% gain — meaningful room to come down on a strong offer.
Risks & watch-outs
- Climate carrying-cost: severe wind risk, 99% chance of damaging wind over 30y; extreme-heat days projected 7→26/yr by 2055 (HVAC capex compounding) — expect insurance premiums to compound above CPI over the hold.
Questions for the listing agent
- It's been on market 35 days. Have you received any prior offers? Is the seller open to a 3% concession, seller financing, or rate buy-down credit?
- Built in 1963 — when were the roof, HVAC, electrical panel, plumbing, and water heater last replaced?
- What does the HOA fee cover, when was the last increase, and are there any pending special assessments or reserve-fund shortfalls?
- Any open or pending special assessments — roof, HVAC, plumbing, elevator, façade? What's the per-unit balance and payoff schedule, and is the seller paying it off at close or rolling it to the buyer?
- Is there a deadline driving the sale (1031 exchange, divorce, estate, relocation)? That informs how much negotiation room exists.
- Schools are B-rated — typically a magnet for longer-tenancy family renters. What's the average tenant stay here, and is there a school-zone premium baked into asking?
- The area grade is low — what's the realistic commute time and amenity access for the typical tenant pool here? Any planned neighborhood developments (good or bad) we should know about?
- What's the average days-on-market for RENTAL listings here right now (not sales)? A rising rental-DOM trend means longer vacancies and softer asking-rent achievability than the comps imply.
- What's the recent tenant-quality profile in this submarket — average credit score on applications, eviction rate, late-payment / NSF rate, and stable-employment percentage? A property-management company in the area should have these aggregated.
- How much new apartment / multifamily construction is in the pipeline within 1–3 miles? Heavy new supply (>2% of stock underway) typically softens rents 12–24 months out; light construction supports rent growth.
Investment metrics
- 1% rule
- 1.18% ✓
- Cap rate
- 6.94%
- Cash-on-cash
- 2.30%
- DSCR
- 1.10
- GRM
- 7.1
CMA / ARV
No comps found within radius.
Projected returns pro-forma
-3.0% appreciation · 3.63% rent growth · sell at horizon
- IRR
- -11.6%
- Equity multiple
- 0.57×
- Total profit
- $-36,902
- Equity at exit
- $46,222
- IRR
- -1.2%
- Equity multiple
- 0.92×
- Total profit
- $-7,160
- Equity at exit
- $26,803
Cash invested: $86,800 (down + closing). Projections, not guarantees.
Landlord ↔ Tenant lean methodology
- Overall (STATE)
- 87 Strongly Landlord-Friendly
- State Florida
- 87 Strongly Landlord-Friendly · R+3
- County
- — inherits STATE
- City
- — inherits STATE
ZIP-level market 33308
- Rents YoY
- 3.6%
- Active inventory
- 739
- Price-to-rent
- 7.1×
Monthly cashflow live
- Estimated rent
- $3,648 high interval (Pro) →
- Mortgage (P&I)
- −$1,626
- Tax from tax record
- −$411 /mo · $4,932/yr
- Insurance
- −$129
- HOA
- −$550
- Vacancy / Maint / Mgmt
- −$766
- Net cashflow
- $166
Break-even live
Sensitivity live
| Price | -10% $342 | -5% $254 | +0% $166 | +5% $79 | +10% $-9 |
|---|---|---|---|---|---|
| Rent | -10% $-122 | -5% $22 | +0% $166 | +5% $310 | +10% $455 |
| Rate | -1.0pp $322 | -0.5pp $245 | base $166 | +0.5pp $86 | +1.0pp $4 |
UW: 25.0% down · 7.5% · 30yr · 1.5% tax · 5.0% vac · 8.0% maint · 8.0% mgmt
Financing live
Cash to close
- Down payment
- $77,500
- Closing costs
- $9,300
- Reserves months
- —
- Total cash needed
- —
Loan-product check · same deal, 3 products live
Conventional
25% down · 7.5% · 30yr
- Down + closing
- —
- Monthly P&I
- —
- Monthly cashflow
- —
- DSCR
- —
- Eligible?
- —
Personal DTI + credit; lowest rate.
DSCR
20% down · 8.5% · 30yr
- Down + closing
- —
- Monthly P&I
- —
- Monthly cashflow
- —
- DSCR
- —
- Eligible?
- —
No personal income docs; deal must DSCR.
Hard money
10% down · 12.0% · 12mo
- Down + closing
- —
- Monthly P&I
- —
- Monthly cashflow
- —
- DSCR
- —
- Eligible?
- —
Short-term bridge; refi at stabilization.
Rent comps 40 comps
| Address | Beds | Baths | Sqft | Rent | $/sqft | DOM | Units | Dist |
|---|---|---|---|---|---|---|---|---|
| 3411 N Federal Hwy Fort Lauderdale, FL | 2.0 | 1.0–2.0 | 754 | $3,545 | $4.70 | 3d | 59 | 0.26mi |
| 3333 N Federal Hwy Fort Lauderdale, FL | 2.0 | 1.0–2.0 | 736 | $3,228 | $4.38 | 2d | 13 | 0.42mi |
| 1680 NE 34th Ln Unit B Oakland Park, FL | 2.0 | 2.0 | 1084 | $3,100 | $2.86 | 20d | 1 | 0.49mi |
| 3781 NE 13th Ave Oakland Park, FL | 2.0 | 1.0 | 869 | $3,900 | $4.49 | 25d | 1 | 0.67mi |
| 2100 NE 45th St #1 Fort Lauderdale, FL | 3.0 | 3.5 | 1340 | $9,500 | $7.09 | 25d | 1 | 0.67mi |
| 1421 NE 41st St Oakland Park, FL | 2.0 | 2.0 | 1366 | $4,000 | $2.93 | 25d | 1 | 0.68mi |
| 3320 NE 13th Ave Unit 3320 Oakland Park, FL | 3.0 | 2.5 | 1433 | $3,600 | $2.51 | 25d | 1 | 0.73mi |
| 3801 Dixie Hwy Oakland Park, FL | 2.0 | 1.0–2.0 | 944 | $3,584 | $3.80 | 15d | 45 | 0.82mi |
| 4360 NE 13th Ave Oakland Park, FL | 3.0 | 2.0 | 1459 | $3,700 | $2.54 | 6d | 1 | 0.83mi |
| 4360 NE 13th Ave Oakland Park, FL | 3.0 | 2.0 | 1269 | $3,700 | $2.92 | 25d | 1 | 0.83mi |
| 4360 NE 13th Ave Unit Main Oakland Park, FL | 3.0 | 2.0 | 1269 | $4,500 | $3.55 | 22d | 1 | 0.83mi |
| 4804 NE 21st Ave #4804 Fort Lauderdale, FL | 2.0 | 2.0 | 1400 | $4,500 | $3.21 | 25d | 1 | 0.88mi |
| 1575 NE 47th St Oakland Park, FL | 3.0 | 2.0 | 1358 | $3,700 | $2.72 | 25d | 1 | 0.89mi |
| 4764 NE 15th Way Oakland Park, FL | 3.0 | 2.0 | 1218 | $3,500 | $2.87 | 25d | 1 | 0.92mi |
| 2741 NE 16th Ave Wilton Manors, FL | 2.0 | 2.0 | 1400 | $3,500 | $2.50 | 25d | 1 | 0.93mi |
| 4511 NE 13th Ave Oakland Park, FL | 3.0 | 3.0 | 1416 | $4,300 | $3.04 | 4d | 1 | 0.97mi |
| 4511 NE 13th Ave Oakland Park, FL | 3.0 | 3.0 | 1416 | $4,300 | $3.04 | 25d | 1 | 0.97mi |
| 4511 NE 13th Ave Oakland Park, FL | 2.0 | 2.0 | 1400 | $3,200 | $2.29 | 8d | 1 | 0.97mi |
| 3605 NE 32nd Ave Unit 209A Fort Lauderdale, FL | 2.0 | 2.0 | 1000 | $3,300 | $3.30 | 2d | 1 | 0.99mi |
| 3605 NE 32nd Ave Unit 209A Fort Lauderdale, FL | 2.0 | 2.0 | 1000 | $3,300 | $3.30 | 20d | 1 | 0.99mi |
| 2900 NE 30th St Unit H6 Fort Lauderdale, FL | 2.0 | 2.0 | 1040 | $3,200 | $3.08 | 25d | 1 | 1.03mi |
| 3020 NE 32nd Ave Fort Lauderdale, FL | 1.0–2.0 | 1.0–2.0 | 920 | $4,300 | $4.67 | 5d | 4 | 1.13mi |
| 3020 NE 32nd Ave Fort Lauderdale, FL | 2.0 | 2.0 | 1185 | $3,875 | $3.27 | 8d | 3 | 1.13mi |
| 3031 N Ocean Blvd Fort Lauderdale, FL | 2.0–3.0 | 2.0 | 1290 | $3,200 | $2.48 | 5d | 4 | 1.20mi |
| 3031 N Ocean Blvd Fort Lauderdale, FL | 2.0–3.0 | 2.0 | 1325 | $3,475 | $2.62 | 18d | 3 | 1.20mi |
| 3031 N Ocean Blvd Fort Lauderdale, FL | 2.0–3.0 | 2.0 | 1290 | $3,400 | $2.63 | 8d | 3 | 1.20mi |
| 2816 NE 9th Ter Wilton Manors, FL | 2.0 | 1.0 | 1146 | $3,800 | $3.32 | 25d | 1 | 1.22mi |
| 4800 Bayview Dr #303 Fort Lauderdale, FL | 2.0 | 2.0 | 1032 | $3,500 | $3.39 | 25d | 1 | 1.25mi |
| 2841 N Ocean Blvd Fort Lauderdale, FL | 2.0 | 2.0 | 1150 | $3,700 | $3.22 | 15d | 3 | 1.28mi |
| 3750 Galt Ocean Dr #209 Fort Lauderdale, FL | 1.0 | 1.5 | 1187 | $4,000 | $3.37 | 25d | 1 | 1.29mi |
| 2831 N Ocean Blvd Unit 702N Fort Lauderdale, FL | 2.0 | 2.0 | 1274 | $5,200 | $4.08 | 4d | 1 | 1.30mi |
| 2831 N Ocean Blvd Unit 801N Fort Lauderdale, FL | 2.0 | 2.0 | 1468 | $6,000 | $4.09 | 25d | 1 | 1.30mi |
| 2831 N Ocean Blvd Unit 702N Fort Lauderdale, FL | 2.0 | 2.0 | 1274 | $5,200 | $4.08 | 25d | 1 | 1.30mi |
| 3430 Galt Ocean Dr Fort Lauderdale, FL | 1.0–4.0 | 1.5–4.5 | 2873 | $6,320 | $2.20 | 8d | 4 | 1.30mi |
| 3430 Galt Ocean Dr Fort Lauderdale, FL | 1.0–2.0 | 1.5–2.0 | 1343 | $4,980 | $3.71 | 16d | 4 | 1.30mi |
| 2821 N Ocean Blvd Unit 401S Fort Lauderdale, FL | 2.0 | 2.0 | 1468 | $5,750 | $3.92 | 25d | 1 | 1.31mi |
| 2821 N Ocean Blvd Unit 401S Fort Lauderdale, FL | 2.0 | 2.0 | 1468 | $5,500 | $3.75 | 11d | 1 | 1.31mi |
| 2821 N Ocean Blvd Unit 1102S Fort Lauderdale, FL | 2.0 | 2.0 | 1274 | $4,500 | $3.53 | 25d | 1 | 1.31mi |
| 2821 N Ocean Blvd Unit 806S Fort Lauderdale, FL | 2.0 | 2.0 | 1274 | $5,900 | $4.63 | 19d | 1 | 1.31mi |
| 3500 Galt Ocean Dr #2314 Fort Lauderdale, FL | 1.0 | 1.5 | 1088 | $4,500 | $4.14 | 25d | 1 | 1.31mi |
HOA detail condo
- Monthly dues
- $550 · $6,600/yr
- Assessments
- None detected in remarks — confirm with the listing agent.
Listing history 16 events
-
2026-06-18days on market $310,000 Active 35 DOM
-
2026-06-17days on market $310,000 Active 34 DOM
-
2026-06-16days on market $310,000 Active 33 DOM
-
2026-06-15days on market $310,000 Active 32 DOM
-
2026-06-13days on market $310,000 Active 30 DOM
-
2026-06-09days on market $310,000 Active 26 DOM
-
2026-06-08days on market $310,000 Active 25 DOM
-
2026-06-07days on market $310,000 Active 24 DOM
-
2026-06-04days on market $310,000 Active 21 DOM
-
2026-06-03days on market $310,000 Active 20 DOM
-
2026-06-02days on market $310,000 Active 19 DOM
-
2026-06-01days on market $310,000 Active 18 DOM
-
2026-05-31days on market $310,000 Active 17 DOM
-
2026-05-14$310,000 Active
-
1998-02-24soldstatus $60,000
-
1987-12-01soldstatus $67,500
ⓘ Source: listings_history table (triggers on properties + properties_extension) + one-shot
backfill from property_details.listing_events for pre-trigger history.
Tax reassessment forecast FL · Resets to sale price
- Current annual tax
- $4,932 · $411/mo
- Projected year-2 tax
- $4,932 · $411/mo
- Expected delta
- $0/yr ($0/mo · 0.0%)
ⓘ Screening estimate from a state-policy table — verify with the county assessor before closing.
Climate risk First Street
- Flood 3/10 Moderate FEMA zone X (unshaded) · 7% chance over 30 yrs
- Wildfire 1/10 Low
- Heat 10/10 Extreme 7 d/yr ≥105°F today · 26 d/yr by 30 yrs out
- Wind 10/10 Extreme 99% chance of damaging wind over 30 yrs
- Air quality 2/10 Low 1 unhealthy d/yr today · 2 by 30 yrs out
Nearby sold comps map
Loading sold comps map…
Walkable amenities ~0.75 mi
Loading nearby amenities…
Taxation est. · year 1
- Rental income
- $43,781
- − Mortgage interest
- −$17,365
- − Property taxes
- −$4,932
- − Insurance
- −$1,550
- − Repairs & maintenance
- −$3,502
- − Management
- −$3,502
- − HOA
- −$6,600
- − Depreciation
- −$9,018
- Taxable loss
- −$2,689
- Est. tax savings @ 24.0%
- +$645
- After-tax cash flow
- $2,642/yr
For passive investors: Depreciation is non-cash, so a rental often shows a tax loss while cash-flowing — sheltering income. Rental losses are passive: they offset passive income freely, and up to $25,000/yr can offset ordinary (W-2) income if you actively participate and your MAGI is under $100k (phasing out to $0 by $150k); unused losses carry forward. On sale, claimed depreciation is recaptured at up to 25%, and gains may owe capital-gains tax (a 1031 exchange can defer both). Figures are a year-1 estimate at your 24.0% rate — not tax advice; consult a CPA.
Schools (NCES district)
- District
- Broward
- NCES district ID
- 1200180
- Math proficiency
- 42% ▼ -18.00%
- Reading proficiency
- 53% ▼ -5.00%
- Median HH income
- $52,139
- Composite
- 40.88/100
- National rank
- #3621
- State rank
- #46 of 73 in FL
Livability — Fort Lauderdale
- Score
- 82/100
- State rank
- #78
- US rank
- #1293
Category grades
Schools grade is shown separately in the Schools card above.
Census & demographics
- Census place
- Fort Lauderdale, FL
- County
- Broward County · 1,963,430 people
- City population
- 235,769
- Metro
- Miami-Fort Lauderdale-Pompano Beach, FL
- Population (ZIP)
- 27,935
- Household income
- $93,879
- Rent vs Own
- Severe rent burden
- 912.0
Population outlook (Broward County) Hauer SSP2
- Today (2025)
- 2,207,033 people
- By 2030
- 2,360,704 · +7.0%
- By 2040
- 2,661,208 · +20.6%
- By 2050
- 2,946,698 · +33.5%
- By 2075
- 3,602,273 · +63.2%
- By 2100
- 3,970,984 · +79.9%
Race, ethnicity, and origin ACS 2023
- Neighborhood character
- Predominantly White (75%)
- Race & ethnicity
- White 75% Hispanic / Latino 16% Two or more races 14% Asian 3% Black 2%
- Hispanic origin (detail)
- Puerto Rican 2% Cuban 3%
- Common ancestry
- Romanian 4% Lithuanian 3% Scotch-Irish 3%
- Foreign-born
- 24% · Canada, Jamaica, Dominican Republic
- Languages at home
- 75% English-only · Spanish 14% Other Indo-European 5% Russian/Polish/Slavic 2%
Political lean MEDSL · Broward
- 2024 margin
- D (+17.0) · D 58.0% · R 41.0%
- 2008→2024 swing
- -17.8pp toward R · 2008: 34.7pp · 2024: 17.0pp
- All cycles
- 2024: D+17.0 2020: D+29.8 2016: D+35.0 2012: D+34.9 2008: D+34.7
Not yet ingested
- Civics
- —
Market trends
- HPI YoY
- ▼ -417.95%
- Current HPI
- 325.3902
- Rent YoY
- ▲ 3.63%
- Metro
- Miami-Fort Lauderdale-Pompano Beach, FL
- State GDP YoY
- ▲ 3.28%
- F500 in state
- 36
Industry mix (Fortune 500 HQ in FL)
| Industry | F500 HQs | Revenue |
|---|---|---|
| Industrial Technology | 2 | $29B |
|
||
| Insurance | 2 | $17B |
|
||
| Retail | 1 | $60B |
|
||
| Technology Distribution | 1 | $58B |
|
||
| Homebuilding | 1 | $35B |
|
||
| Technology Manufacturing | 1 | $35B |
|
||
Price history
+359.3% since first listed3 events — show timeline
- 2026-05-14 Listed $310,000 MARMLS
- 1998-02-24 Sold (Public Records) $60,000 Public Records
- 1987-12-01 Sold (Public Records) $67,500 Public Records
Property tax history
+14.0%/yrLatest (2025): $4,932 · +414.1% YoY. Source: county tax records.
Cash-flow waterfall
monthlySold comps — $/sqft
last 12 mo · ≤1 miLoading sold comps…