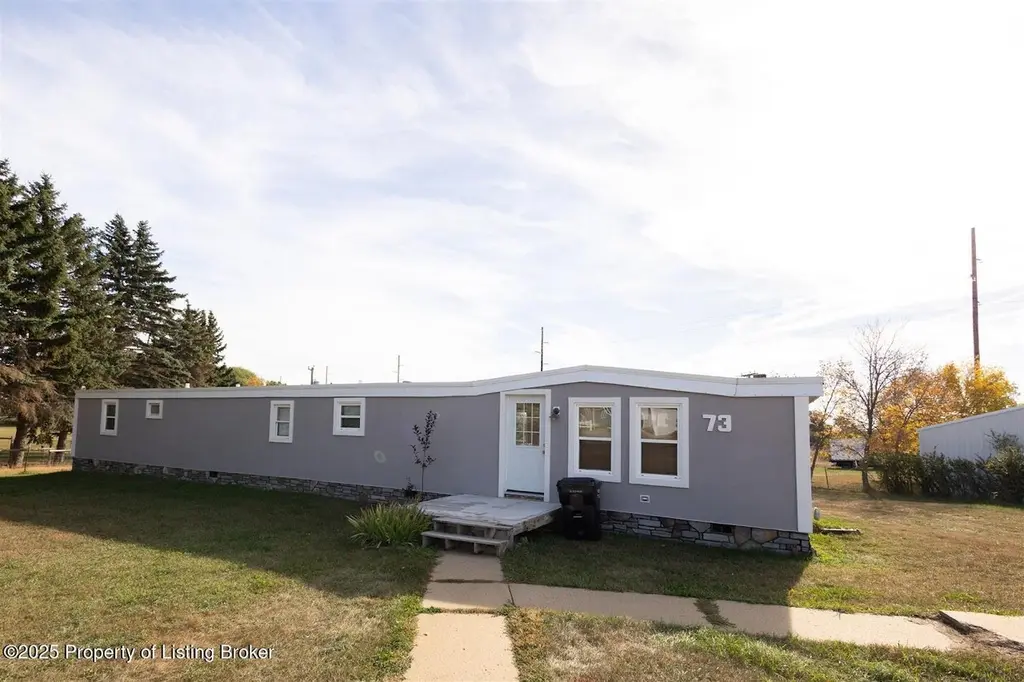
73 29th Ave SW · Dickinson, ND
Flood risk 1/10 · Minimal
- FEMA flood zone
- X (unshaded)
- Chance of flooding over 30 yrs
- 0.0%
- Est. flood insurance / yr
- $473 – $860
Fire risk 3/10 · Minor
- Est. fire insurance / yr
- $1,289 – $2,393
Heat risk 2/10 · Minimal
- Hot days now (above 96°F)
- 7 days/yr
- Hot days in 30 yrs
- 14 days/yr
Wind risk 2/10 · Minimal
- Chance of severe wind over 30 yrs
- —
Air-quality risk 4/10 · Minor
- Unhealthy air days now
- 4 days/yr
- Unhealthy air days in 30 yrs
- 5 days/yr
Risk factors via First Street. Map © Google.
Why this score? — see what drove the B grade
The composite is a weighted blend of 9 inputs, each scored 0–100. Each bar is that input's sub-score; the figure is the points it added to the 100-point composite (weight × sub-score).
- Cash flow +30.0/30.0
- DSCR +10.0/10.0
- 1% rule +9.9/10.0
- ARV discount +7.5/15.0
- Livability +3.8/5.0
- Schools +3.5/10.0
- Rent growth +3.0/5.0
- Condition / age +2.5/5.0
- Appreciation +0.0/10.0
$100,000
🖨 Deal sheet 📄 Offer letter ✓ Due diligence
Listing remarks MLS
This manufactured home has almost a half acre of land (. 46). Plenty of room to build a garage. There is a shed. Includes Southwest water. There is a well but has not been used since SWW came in. Electric forced air and central air. Work in progress with some new windows and stucco siding on the home. Buying 'AS IS' with materials included in the home. For the future only Modular or stick built homes can replace this home.
Key facts
- 0.46 acre lot
- Built 1975
- Listed 13 days
Property features AI
Exterior
- Utilities: Septic tank sewer
- Home design: Single-family residential property
- Construction: Crawl space foundation
- Exterior features: Rural residential lot; Approximately 0.46 acre lot
Interior
- Kitchen: Dishwasher; Microwave; Range; Refrigerator
- Bathrooms: 1 full bathroom
- Heating & cooling: Forced air heating; Cooling system present
- Interior features: Eat-in kitchen; 10 total rooms; Crawl space (no full basement)
- Laundry & utility: Washer; Dryer
Neighborhood map
What this means for you Summary
Snapshot
- This is a 3-bed/1.0-bath manufactured listed at $100k.
Deal economics
- At list price, monthly cash flow is $568 ($7k/yr) — positive.
- The deal already cash-flows at list — no discount required.
- Meets the 1% rule at list price ($1k rent vs $100k).
- Cap rate 13.1% vs local median 2.9% in Dickinson — top-decile yield for the area; either an underpriced asset or a hidden risk that comps aren't pricing in. Stress-test before assuming the spread holds.
Location & tenants
- Location reads 76/100 on livability (#12 in ND, #3,334 nationally) — a middle-class / working-renter tenant base. Strengths: cost of living A+, housing A+, health & safety A+; Watch: amenities F, commute F.
- Dickinson 1 (town): math 35% / reading 43% proficiency, ranked #29 of 53 in ND (top 55%) — families likely to look elsewhere, expect single-tenant / working-renter base with shorter leases.
- Market conditions: Rents rising (+1.9%/yr); 235 active listings in the ZIP; solid renter incomes; 20 units permitted in Stark County in 2024 (0 in 5+ unit buildings).
Forward outlook
- Local home prices are declining (-3.0%/yr); year-one equity from $691 of loan paydown is wiped out by about $3k of value loss. Plan a longer hold.
- Stark County population projected at +120% by 2050 — long-run rental-demand tailwind backs the buy-and-hold thesis.
- At projected returns (-3.0% appreciation + 1.9% rent growth), your $28k cash investment doubles in ~6 years — after that, you're playing with house money.
Negotiation context
- Only 14 days on market — expect competitive offers; lowballing is unlikely to land.
- 6 sale attempts since 5y ago with the ask held roughly flat each time — persistent listings suggest the price (not the market) is what's stuck; bring a comps-based counter.
- Current owner paid $75k; 33% above their basis — modest negotiation headroom, anchor on the comps not their cost.
Questions for the listing agent
- Built in 1975 — when were the roof, HVAC, electrical panel, plumbing, and water heater last replaced?
- Is there a deadline driving the sale (1031 exchange, divorce, estate, relocation)? That informs how much negotiation room exists.
- Schools are B-rated — typically a magnet for longer-tenancy family renters. What's the average tenant stay here, and is there a school-zone premium baked into asking?
- What's the average days-on-market for RENTAL listings here right now (not sales)? A rising rental-DOM trend means longer vacancies and softer asking-rent achievability than the comps imply.
- What's the recent tenant-quality profile in this submarket — average credit score on applications, eviction rate, late-payment / NSF rate, and stable-employment percentage? A property-management company in the area should have these aggregated.
- How much new for-sale + rental construction is in the pipeline within 1–3 miles? Heavy new supply typically softens prices + rents 12–24 months out; constrained supply supports both.
Investment metrics
- 1% rule
- 1.49% ✓
- Cap rate
- 13.11%
- Cash-on-cash
- 24.35%
- DSCR
- 2.08
- GRM
- 5.6
CMA / ARV
No comps found within radius.
Projected returns pro-forma
-3.0% appreciation · 1.95% rent growth · sell at horizon
- IRR
- 16.5%
- Equity multiple
- 1.66×
- Total profit
- $18,400
- Equity at exit
- $14,910
- IRR
- 24.3%
- Equity multiple
- 3.01×
- Total profit
- $56,258
- Equity at exit
- $8,646
Cash invested: $28,000 (down + closing). Projections, not guarantees.
Landlord ↔ Tenant lean methodology
- Overall (STATE)
- 82 Strongly Landlord-Friendly
- State North Dakota
- 82 Strongly Landlord-Friendly · R+20
- County
- — inherits STATE
- City
- — inherits STATE
ZIP-level market 58601
- Rents YoY
- 1.9%
- Active inventory
- 235
- Price-to-rent
- 5.6×
Monthly cashflow live
- Estimated rent
- $1,485 medium interval (Pro) →
- Mortgage (P&I)
- −$524
- Tax from tax record
- −$39 /mo · $468/yr
- Insurance
- −$42
- HOA
- −$0
- Vacancy / Maint / Mgmt
- −$312
- Net cashflow
- $568
Break-even live
UW: 25.0% down · 7.5% · 30yr · 1.5% tax · 5.0% vac · 8.0% maint · 8.0% mgmt
Financing live
Cash to close
- Down payment
- $25,000
- Closing costs
- $3,000
- Reserves months
- —
- Total cash needed
- —
Loan-product check · same deal, 3 products live
Conventional
25% down · 7.5% · 30yr
- Down + closing
- —
- Monthly P&I
- —
- Monthly cashflow
- —
- DSCR
- —
- Eligible?
- —
Personal DTI + credit; lowest rate.
DSCR
20% down · 8.5% · 30yr
- Down + closing
- —
- Monthly P&I
- —
- Monthly cashflow
- —
- DSCR
- —
- Eligible?
- —
No personal income docs; deal must DSCR.
Hard money
10% down · 12.0% · 12mo
- Down + closing
- —
- Monthly P&I
- —
- Monthly cashflow
- —
- DSCR
- —
- Eligible?
- —
Short-term bridge; refi at stabilization.
Listing history 10 events
-
2026-06-19days on market $100,000 Active 14 DOM
-
2026-06-18days on market $100,000 Active 13 DOM
-
2026-06-17days on market $100,000 Active 12 DOM
-
2026-06-16days on market $100,000 Active 11 DOM
-
2026-06-15days on market $100,000 Active 10 DOM
-
2026-06-14days on market $100,000 Active 8 DOM
-
2026-06-12days on market $100,000 Active 7 DOM
-
2026-06-09days on market $100,000 Active 4 DOM
-
2026-06-08days on market $100,000 Active 3 DOM
-
2026-06-07$100,000 Active 2 DOM
ⓘ Source: listings_history table (triggers on properties + properties_extension) + one-shot
backfill from property_details.listing_events for pre-trigger history.
Tax reassessment forecast ND · Resets to sale price
- Current annual tax
- $468 · $39/mo
- Projected year-2 tax
- $980 · $82/mo
- Expected delta
- +$512/yr (+$43/mo · 109.2%)
ⓘ Screening estimate from a state-policy table — verify with the county assessor before closing.
Climate risk First Street
- Flood 1/10 Low FEMA zone X (unshaded) · 0% chance over 30 yrs
- Wildfire 3/10 Moderate
- Heat 2/10 Low 7 d/yr ≥96°F today · 14 d/yr by 30 yrs out
- Wind 2/10 Low
- Air quality 4/10 Moderate 4 unhealthy d/yr today · 5 by 30 yrs out
Nearby sold comps map
Loading sold comps map…
Walkable amenities ~0.75 mi
Loading nearby amenities…
Taxation est. · year 1
- Rental income
- $17,822
- − Mortgage interest
- −$5,602
- − Property taxes
- −$468
- − Insurance
- −$500
- − Repairs & maintenance
- −$1,426
- − Management
- −$1,426
- − Depreciation
- −$2,909
- Taxable income
- $5,492
- Est. tax owed @ 24.0%
- −$1,318
- After-tax cash flow
- $5,500/yr
For passive investors: Depreciation is non-cash, so a rental often shows a tax loss while cash-flowing — sheltering income. Rental losses are passive: they offset passive income freely, and up to $25,000/yr can offset ordinary (W-2) income if you actively participate and your MAGI is under $100k (phasing out to $0 by $150k); unused losses carry forward. On sale, claimed depreciation is recaptured at up to 25%, and gains may owe capital-gains tax (a 1031 exchange can defer both). Figures are a year-1 estimate at your 24.0% rate — not tax advice; consult a CPA.
Schools (NCES district)
- District
- Dickinson 1
- NCES district ID
- 3800038
- Math proficiency
- 35% ▼ -12.00%
- Reading proficiency
- 43% ▼ -7.00%
- Median HH income
- $63,270
- Composite
- 34.9/100
- National rank
- #5080
- State rank
- #29 of 53 in ND
Livability — Dickinson
- Score
- 76/100
- State rank
- #12
- US rank
- #3334
Category grades
Schools grade is shown separately in the Schools card above.
Census & demographics
- County
- Stark County · 29,916 people
- City population
- 29,916
- Metro
- Dickinson, ND
- Population (ZIP)
- 29,916
- Household income
- $85,821
- Rent vs Own
- Severe rent burden
- 813.0
Population outlook (Stark County) Hauer SSP2
- Today (2025)
- 50,426 people
- By 2030
- 60,812 · +20.6%
- By 2040
- 84,155 · +66.9%
- By 2050
- 110,718 · +119.6%
- By 2075
- 186,710 · +270.3%
- By 2100
- 264,902 · +425.3%
Race, ethnicity, and origin ACS 2023
- Neighborhood character
- Predominantly White (85%)
- Race & ethnicity
- White 85% Hispanic / Latino 7% Two or more races 5% Black 3% Asian 1%
- Hispanic origin (detail)
- Mexican 5%
- Common ancestry
- Portuguese 9% Scotch-Irish 2% Lithuanian 2%
- Foreign-born
- 4% · Canada, China
- Languages at home
- 92% English-only · Spanish 4% German/W. Germanic 1% Arabic 1%
Political lean MEDSL · Stark
- 2024 margin
- Solid R (+65.6) · D 16.5% · R 82.1% · Other 1.5%
- 2008→2024 swing
- -36.5pp toward R · 2008: -29.1pp · 2024: -65.6pp
- All cycles
- 2024: R+65.6 2020: R+63.9 2016: R+65.8 2012: R+49.4 2008: R+29.1
Not yet ingested
- Civics
- —
Market trends
- HPI YoY
- ▼ -133.57%
- Current HPI
- 188.1029
- Rent YoY
- ▲ 1.95%
- Metro
- Dickinson, ND
- State GDP YoY
- ▲ 2.09%
- F500 in state
- 2
Industry mix (Fortune 500 HQ in ND)
| Industry | F500 HQs | Revenue |
|---|---|---|
| Utilities / Construction | 1 | $6B |
|
||
Price history
+53.8% since first listed17 events — show timeline
- 2026-06-05 Price Changed $100,000 GNMLS
- 2026-06-04 Listed $100,000 Badlands BOR MLS
- 2026-06-04 Listed $125,000 GNMLS
- 2025-11-10 Price Changed $125,000 GNMLS
- 2025-11-10 Price Changed $125,000 Badlands BOR MLS
- 2025-10-03 Listed $150,000 Badlands BOR MLS
- 2024-07-01 Sold (Public Records) $75,000 Public Records
- 2024-07-01 Sold (MLS) — Badlands BOR MLS
- 2024-06-06 Contingent — Badlands BOR MLS
- 2024-03-26 Listed $89,900 Badlands BOR MLS
- 2024-01-27 Price Changed $89,900 Badlands BOR MLS
- 2023-11-01 Price Changed $99,900 Badlands BOR MLS
- 2023-09-06 Delisted — Badlands BOR MLS
- 2023-05-17 Listed $110,000 Badlands BOR MLS
- 2022-02-15 Price Changed $910 RENT.
- 2021-05-11 Sold (Public Records) $55,000 Public Records
- 2021-01-11 Listed $65,000 Badlands BOR MLS
Property tax history
+6.0%/yrLatest (2025): $468 · -3.4% YoY. Source: county tax records.
Cash-flow waterfall
monthlySold comps — $/sqft
last 12 mo · ≤1 miLoading sold comps…