905 E 1st St · Salem, MO
Flood risk 1/10 · Minimal
- FEMA flood zone
- X (unshaded)
- Chance of flooding over 30 yrs
- 0.0%
- Est. flood insurance / yr
- $507 – $1,088
Fire risk 5/10 · Moderate
- Est. fire insurance / yr
- $1,054 – $1,958
Heat risk 5/10 · Moderate
- Hot days now (above 106°F)
- 7 days/yr
- Hot days in 30 yrs
- 20 days/yr
Wind risk 2/10 · Minimal
- Chance of severe wind over 30 yrs
- 1.0%
Air-quality risk 1/10 · Minimal
- Unhealthy air days now
- 0 days/yr
- Unhealthy air days in 30 yrs
- 0 days/yr
Risk factors via First Street. Map © Google.
Why this score? — see what drove the C- grade
The composite is a weighted blend of 9 inputs, each scored 0–100. Each bar is that input's sub-score; the figure is the points it added to the 100-point composite (weight × sub-score).
- Cash flow +18.1/30.0
- Appreciation +7.8/10.0
- ARV discount +7.5/15.0
- DSCR +5.7/10.0
- 1% rule +3.7/10.0
- Livability +3.5/5.0
- Schools +2.7/10.0
- Rent growth +2.5/5.0
- Condition / age +2.5/5.0
$85,000
🖨 Deal sheet 📄 Offer letter ✓ Due diligence
Listing remarks
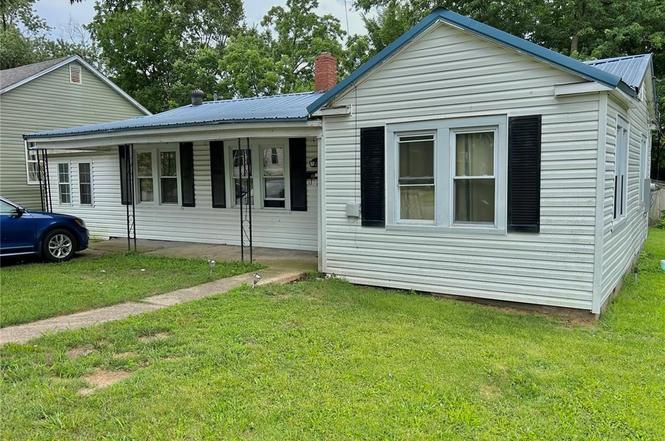
Call to schedule your private showing today. 1134 sq. ft. , 3 bedroom 2 bath home with one bedroom being non-conforming. Luxury vinyl plank flooring in the master bedroom and bathroom. Bedroom and bathroom have been recently updated. Vinyl siding, metal roof and vinyl windows. Concrete driveway, sidewalk and covered front porch. 10x10 covered back porch overlooking a nice back yard with a 14x14 garden shed with concrete floor. Large shade trees in the back yard. This property is located in a quiet area close to all of Salem's amenities. Within a 20 minute drive to Montauk State Park, Current River, Meramec River & Indian Trail.
Key facts
- Vinyl windows
- Metal roof
- Recently updated
Tags
Property features AI
Finance
- Other: Living area reported by owner; Above-grade finished area reported
Exterior
- Parking: Off-street parking; On-site parking; Additional parking; Concrete parking surface
- Utilities: Public water; Public sewer; Electricity connected (single phase, 220 volts); Natural gas available; Cable and phone available; Sewer and water connected
- Home design: Single-family residence; One-story house; Private ownership; Main entry and all living spaces on the main level
- Construction: Frame construction with vinyl siding; Metal roof
- Exterior features: Covered front and rear porches; Deck; Partial fencing; Shed(s) on the property; City lot with rectangular shape; Asphalt road frontage on a city street
Interior
- Kitchen: Electric oven; Refrigerator
- Bedrooms: Three bedrooms on the main level (all bedrooms located on main level); Bedroom sizes include 13x8, 10x11 and one additional main-level bedroom
- Flooring: Carpet; Combination flooring; Linoleum; Vinyl
- Bathrooms: Two full bathrooms (both on the main level); Master bathroom
- Heating & cooling: Electric heating; Oil heating; Electric cooling with multiple units
- Interior features: Electric water heater; Combination of carpet, linoleum and vinyl flooring
- Laundry & utility: Washer and dryer; Utility room on main level (10x9)
Neighborhood map
What this means for you Summary
Snapshot
- This is a 2-bed/2.0-bath other listed at $85k.
Deal economics
- At list price, monthly cash flow is $75 ($905/yr) — positive.
- The deal already cash-flows at list — no discount required.
- To meet the 1% rule (rent ≥ 1% of price), the offer needs to be $74k (12.6% below list).
- Recommended offer: $74k (12.6% below list) — sets the bar for 1% rule.
- Cap rate 7.4% vs local median 2.7% in Salem — top-decile yield for the area; either an underpriced asset or a hidden risk that comps aren't pricing in. Stress-test before assuming the spread holds.
Location & tenants
- Location reads 69/100 on livability (#157 in MO) — a middle-class / working-renter tenant base. Strengths: cost of living A+, health & safety A+, crime B; Watch: amenities C-, commute F, employment F.
- Salem R-80 (town): math 25% / reading 41% proficiency, ranked #253 of 324 in MO (top 78%) — families likely to look elsewhere, expect single-tenant / working-renter base with shorter leases.
- Zoned schools: Salem Upper Elem. (math 28% / reading 40%, grade F, #739 of 1,115 statewide, top 67%, 336 students, 62% FRL); Salem Sr. High (math 8% / reading 47%, grade F, #417 of 521 statewide, top 80%, 616 students, 46% FRL).
- Market conditions: 169 active listings in the ZIP; 3 units permitted in Dent County in 2024 (0 in 5+ unit buildings).
Forward outlook
- In year one you build about $5k of equity ($588 loan paydown + $5k appreciation (5.7% local appreciation)).
- Dent County population projected at -14% by 2050 — secular population decline; favor cash flow + early exit over multi-decade hold.
- At projected returns (5.7% appreciation + 3.0% rent growth), your $24k cash investment doubles in ~4 years — after that, you're playing with house money.
- By year 7, paydown + projected appreciation supports a ~$35k cash-out refi (75% LTV) — recoverable capital for the next deal without selling this one.
Negotiation context
- Only 1 days on market — expect competitive offers; lowballing is unlikely to land.
Risks & watch-outs
- Watch-outs: built in 1950 — expect roof / HVAC / electrical / plumbing capex.
- Climate carrying-cost: moderate wildfire risk; extreme-heat days projected 7→20/yr by 2055 (HVAC capex compounding) — expect insurance premiums to compound above CPI over the hold.
Questions for the listing agent
- Built in 1950 — when were the roof, HVAC, electrical panel, plumbing, and water heater last replaced?
- Is there a deadline driving the sale (1031 exchange, divorce, estate, relocation)? That informs how much negotiation room exists.
- Schools are D-rated, which usually means shorter tenancies and higher turnover. Who's the typical renter profile here, and what's been the actual vacancy rate?
- What's the average days-on-market for RENTAL listings here right now (not sales)? A rising rental-DOM trend means longer vacancies and softer asking-rent achievability than the comps imply.
- What's the recent tenant-quality profile in this submarket — average credit score on applications, eviction rate, late-payment / NSF rate, and stable-employment percentage? A property-management company in the area should have these aggregated.
- How much new for-sale + rental construction is in the pipeline within 1–3 miles? Heavy new supply typically softens prices + rents 12–24 months out; constrained supply supports both.
Investment metrics
- 1% rule
- 0.87% ✗
- Cap rate
- 7.36%
- Cash-on-cash
- 3.80%
- DSCR
- 1.17
- GRM
- 9.5
CMA / ARV
No comps found within radius.
Projected returns pro-forma
5.66% appreciation · 3.0% rent growth · sell at horizon
- IRR
- 17.7%
- Equity multiple
- 2.16×
- Total profit
- $27,583
- Equity at exit
- $51,597
- IRR
- 17.5%
- Equity multiple
- 4.27×
- Total profit
- $77,794
- Equity at exit
- $92,023
Cash invested: $23,800 (down + closing). Projections, not guarantees.
Landlord ↔ Tenant lean methodology
- Overall (STATE)
- 81 Strongly Landlord-Friendly
- State Missouri
- 81 Strongly Landlord-Friendly · R+10
- County
- — inherits STATE
- City
- — inherits STATE
ZIP-level market 65560
- Home prices YoY
- 2.4%
- Active inventory
- 169
- Price-to-rent
- 9.5×
Monthly cashflow live
- Estimated rent
- $743 medium interval (Pro) →
- Mortgage (P&I)
- −$446
- Tax from tax record
- −$30 /mo · $364/yr
- Insurance
- −$35
- HOA
- −$0
- Vacancy / Maint / Mgmt
- −$156
- Net cashflow
- $75
Break-even live
UW: 25.0% down · 7.5% · 30yr · 1.5% tax · 5.0% vac · 8.0% maint · 8.0% mgmt
Financing live
Cash to close
- Down payment
- $21,250
- Closing costs
- $2,550
- Reserves months
- —
- Total cash needed
- —
Loan-product check · same deal, 3 products live
Conventional
25% down · 7.5% · 30yr
- Down + closing
- —
- Monthly P&I
- —
- Monthly cashflow
- —
- DSCR
- —
- Eligible?
- —
Personal DTI + credit; lowest rate.
DSCR
20% down · 8.5% · 30yr
- Down + closing
- —
- Monthly P&I
- —
- Monthly cashflow
- —
- DSCR
- —
- Eligible?
- —
No personal income docs; deal must DSCR.
Hard money
10% down · 12.0% · 12mo
- Down + closing
- —
- Monthly P&I
- —
- Monthly cashflow
- —
- DSCR
- —
- Eligible?
- —
Short-term bridge; refi at stabilization.
Listing history 2 events
-
2026-06-17remarks 637-char remark
-
2026-06-17$85,000 Active 1 DOM
ⓘ Source: listings_history table (triggers on properties + properties_extension) + one-shot
backfill from property_details.listing_events for pre-trigger history.
Tax reassessment forecast MO · Resets to sale price
- Current annual tax
- $364 · $30/mo
- Projected year-2 tax
- $824 · $69/mo
- Expected delta
- +$460/yr (+$38/mo · 126.2%)
ⓘ Screening estimate from a state-policy table — verify with the county assessor before closing.
Climate risk First Street
- Flood 1/10 Low FEMA zone X (unshaded) · 0% chance over 30 yrs
- Wildfire 5/10 Major
- Heat 5/10 Major 7 d/yr ≥106°F today · 20 d/yr by 30 yrs out
- Wind 2/10 Low 100% chance of damaging wind over 30 yrs
- Air quality 1/10 Low 0 unhealthy d/yr today · 0 by 30 yrs out
Nearby sold comps map
Loading sold comps map…
Walkable amenities ~0.75 mi
Loading nearby amenities…
Taxation est. · year 1
- Rental income
- $8,916
- − Mortgage interest
- −$4,761
- − Property taxes
- −$364
- − Insurance
- −$425
- − Repairs & maintenance
- −$713
- − Management
- −$713
- − Depreciation
- −$2,473
- Taxable loss
- −$534
- Est. tax savings @ 24.0%
- +$128
- After-tax cash flow
- $1,033/yr
For passive investors: Depreciation is non-cash, so a rental often shows a tax loss while cash-flowing — sheltering income. Rental losses are passive: they offset passive income freely, and up to $25,000/yr can offset ordinary (W-2) income if you actively participate and your MAGI is under $100k (phasing out to $0 by $150k); unused losses carry forward. On sale, claimed depreciation is recaptured at up to 25%, and gains may owe capital-gains tax (a 1031 exchange can defer both). Figures are a year-1 estimate at your 24.0% rate — not tax advice; consult a CPA.
Schools (NCES district)
- District
- Salem R-80
- NCES district ID
- 2927090
- Math proficiency
- 25% ▼ -6.00%
- Reading proficiency
- 41% ▼ -2.00%
- Median HH income
- $32,306
- Composite
- 26.94/100
- National rank
- #7082
- State rank
- #253 of 324 in MO
Livability — Salem
- Score
- 69/100
- State rank
- #157
- US rank
- #8725
Category grades
Schools grade is shown separately in the Schools card above.
Census & demographics
- Census place
- Salem, MO
- Population (ZIP)
- 13,634
Population outlook (Dent County) Hauer SSP2
- Today (2025)
- 15,149 people
- By 2030
- 14,734 · -2.7%
- By 2040
- 13,862 · -8.5%
- By 2050
- 12,959 · -14.5%
- By 2075
- 11,217 · -26.0%
- By 2100
- 9,399 · -38.0%
Race, ethnicity, and origin ACS 2023
- Neighborhood character
- Predominantly White (92%)
- Race & ethnicity
- White 92% Two or more races 5% Hispanic / Latino 2%
- Common ancestry
- Italian 2% Lithuanian 2% Slovak 2%
- Foreign-born
- 2% · China
Political lean MEDSL · Dent
- 2024 margin
- Solid R (+70.2) · D 14.4% · R 84.7%
- 2008→2024 swing
- -32.4pp toward R · 2008: -37.8pp · 2024: -70.2pp
- All cycles
- 2024: R+70.2 2020: R+69.0 2016: R+68.2 2012: R+49.6 2008: R+37.8
Not yet ingested
- Civics
- —
Market trends
- HPI YoY
- ▲ 5.66%
- Current HPI
- 238.9175
- Rent YoY
- —
- Metro
- —
- State GDP YoY
- ▲ 1.84%
- F500 in state
- 20
Industry mix (Fortune 500 HQ in MO)
| Industry | F500 HQs | Revenue |
|---|---|---|
| Healthcare | 1 | $163B |
|
||
| Insurance | 1 | $21B |
|
||
| Industrial Technology | 1 | $17B |
|
||
| Retail | 1 | $16B |
|
||
| Industrial Distribution | 1 | $10B |
|
||
| Utilities | 1 | $9B |
|
||
Price history
+63.5% since first listed3 events — show timeline
- 2026-06-17 Listed $85,000 MARIS as Distributed by MLS Grid
- 2017-03-30 Price Changed $52,000 MARIS as Distributed by MLS Grid
- 2005-07-01 Sold (Public Records) — Public Records
Property tax history
+0.5%/yrLatest (2025): $364 · +4.9% YoY. Source: county tax records.
Cash-flow waterfall
monthlySold comps — $/sqft
last 12 mo · ≤1 miLoading sold comps…