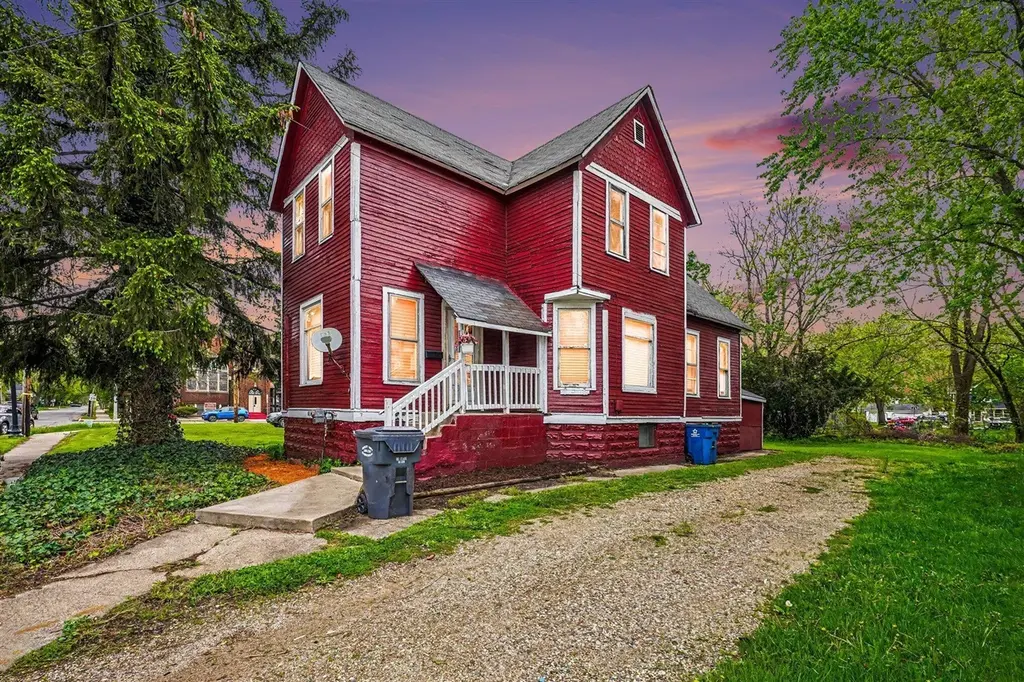
1216 N Park St · Kalamazoo, MI
Flood risk 1/10 · Minimal
- FEMA flood zone
- X (unshaded)
- Chance of flooding over 30 yrs
- 0.0%
- Est. flood insurance / yr
- $507 – $1,088
Fire risk 1/10 · Minimal
- Est. fire insurance / yr
- $784 – $1,456
Heat risk 2/10 · Minimal
- Hot days now (above 100°F)
- 7 days/yr
- Hot days in 30 yrs
- 16 days/yr
Wind risk 2/10 · Minimal
- Chance of severe wind over 30 yrs
- —
Air-quality risk 2/10 · Minimal
- Unhealthy air days now
- 1 days/yr
- Unhealthy air days in 30 yrs
- 2 days/yr
Risk factors via First Street. Map © Google.
Why this score? — see what drove the B+ grade
The composite is a weighted blend of 9 inputs, each scored 0–100. Each bar is that input's sub-score; the figure is the points it added to the 100-point composite (weight × sub-score).
- Cash flow +30.0/30.0
- ARV discount +15.0/15.0
- 1% rule +10.0/10.0
- DSCR +10.0/10.0
- Schools +4.7/10.0
- Livability +3.8/5.0
- Condition / age +2.5/5.0
- Rent growth +2.3/5.0
- Appreciation +0.0/10.0
$105,000
🖨 Deal sheet 📄 Offer letter ✓ Due diligence
Listing remarks MLS
Welcome to an exceptional investment opportunity that seamlessly blends comfort, convenience, and income potential. This duplex features two thoughtfully designed units, making it ideal for owner-occupants or savvy investors looking to grow their portfolio. The lower unit offers a spacious 3-bedroom, 1-bath layout filled with natural light and generous living space--perfect for everyday living and entertaining. The upper unit features a well-designed 2-bedroom, 1-bath floor plan with a cozy yet functional feel, offering great flow and inviting charm for tenants or extended living arrangements. Perfectly positioned just minutes from downtown, this property provides unbeatable access to public transportation, making commuting effortless. Enjoy the convenience of nearby grocery stores, restaurants, shopping, and everyday amenities--all within close reach. Adding to its value, the property is city certified through August 2027, providing peace of mind and confidence.
Key facts
- Natural light
- Two units
- Upper unit
Tags
Property features AI
Finance
- Other: Lot approximately 0.17 acres (49 x 150)
- Financial info: Two-unit income property with rents listed: $850 for the 2-bedroom unit and $1,050 for the 3-bedroom unit
Exterior
- Parking: 4 total parking spaces
- Utilities: Public water; Public sewer; Natural gas connected; Sewer available/connected
- Home design: Residential income property; Multi-family
- Construction: Wood siding construction
- Exterior features: Composition roof
Interior
- Bedrooms: Two-bedroom unit; Three-bedroom unit
- Bathrooms: One bathroom in the two-bedroom unit; One bathroom in the three-bedroom unit
- Heating & cooling: Natural gas heating; Steam heating
- Interior features: Has basement; Laundry located in basement
- Laundry & utility: Laundry in basement
Neighborhood map
What this means for you Summary
Snapshot
- This is a 4-bed/2.0-bath single-family listed at $105k.
Deal economics
- At list price, monthly cash flow is $460 ($6k/yr) — positive.
- The deal already cash-flows at list — no discount required.
- Meets the 1% rule at list price ($2k rent vs $105k).
- Recommended offer: $102k (3.0% below list) — sets the bar for market timing.
- Cap rate 11.6% vs local median 4.1% in Kalamazoo — top-decile yield for the area; either an underpriced asset or a hidden risk that comps aren't pricing in. Stress-test before assuming the spread holds.
Location & tenants
- Location reads 76/100 on livability (#141 in MI, #3,492 nationally) — a middle-class / working-renter tenant base. Strengths: commute A+, cost of living A+, housing A+; Watch: crime F, employment D-.
- Kalamazoo Public Schools (urban): math 43% / reading 72% proficiency, ranked #71 of 540 in MI (top 13%) — acceptable for families but not a draw, mixed tenant base, ~2y average lease; 66% free/reduced lunch — lower-income household profile, screen leases tightly.
- Market conditions: Rents soft (-0.8%/yr); 77 active listings in the ZIP; 5 comparable units currently listed for rent nearby; rentals leasing fast (median 13d on market — plan ~1-2 weeks tenant-placement turnaround); lower-income renter base — watch delinquency; 339 units permitted in Kalamazoo County in 2024 (22 in 5+ unit buildings).
- At $1,571/mo this rent would consume 48% of the median local household income ($39k/yr) (locally 816% of renters already pay >50% of income on rent) — very limited rent-growth headroom before tenants either downsize or default.
Forward outlook
- Local home prices are declining (-3.0%/yr); year-one equity from $726 of loan paydown is wiped out by about $3k of value loss. Plan a longer hold.
- Kalamazoo County population projected at +18% by 2050 — long-run rental-demand tailwind backs the buy-and-hold thesis.
- At projected returns (-3.0% appreciation + 0.0% rent growth), your $29k cash investment doubles in ~9 years — after that, you're playing with house money.
Negotiation context
- It's been on market 34 days — a 3% lower offer ($102k) is reasonable based on typical stale-listing flexibility.
- 3 sale attempts since 36y ago; this cycle's ask has dropped $20k (16%) from the opening price — seller is motivated, your offer sets the floor, not the list.
Risks & watch-outs
- Watch-outs: built in 1905 — expect roof / HVAC / electrical / plumbing capex.
Questions for the listing agent
- It's been on market 34 days. Have you received any prior offers? Is the seller open to a 3% concession, seller financing, or rate buy-down credit?
- Built in 1905 — when were the roof, HVAC, electrical panel, plumbing, and water heater last replaced?
- Is there a deadline driving the sale (1031 exchange, divorce, estate, relocation)? That informs how much negotiation room exists.
- Crime grade is F in this area — have there been break-ins, vandalism, or insurance claims at this property in the last 3 years? What carrier currently insures it and at what premium?
- What's the average days-on-market for RENTAL listings here right now (not sales)? A rising rental-DOM trend means longer vacancies and softer asking-rent achievability than the comps imply.
- What's the recent tenant-quality profile in this submarket — average credit score on applications, eviction rate, late-payment / NSF rate, and stable-employment percentage? A property-management company in the area should have these aggregated.
- How much new for-sale + rental construction is in the pipeline within 1–3 miles? Heavy new supply typically softens prices + rents 12–24 months out; constrained supply supports both.
Investment metrics
- 1% rule
- 1.50% ✓
- Cap rate
- 11.55%
- Cash-on-cash
- 18.78%
- DSCR
- 1.84
- GRM
- 5.6
CMA / ARV
- ARV (on-the-fly)
- $138,678
- Comps found
- 12
Show comp detail 12 sales within ~0.75 mi
| Address | Dist | Beds/Ba | Sqft | Sold | Price | $/sf | Match |
|---|---|---|---|---|---|---|---|
| 1005 N Park St | 0.14mi | 4/1.5 | 1,587 (-0%) | 2mo | $131,500 | $83 | 89 |
| 1349 Krom St | 0.28mi | 4/1.5 | 1,612 (+1%) | 1mo | $125,000 | $78 | 82 |
| 1328 Krom St | 0.28mi | 4/2.0 | 1,550 (-3%) | 2mo | $145,900 | $94 | 80 |
| 410 W Paterson St | 0.06mi | 3/2.0 (-1) | 1,486 (-7%) | 1mo | $129,900 | $87 | 80 |
| 403 Drexel Pl Pl | 0.24mi | 4/1.0 | 1,638 (+3%) | 10mo | $130,000 | $79 | 72 |
| 1018 N Rose St | 0.17mi | 4/2.0 | 1,398 (-12%) | 2mo | $135,000 | $97 | 70 |
| 302 W Frank St | 0.27mi | 3/1.5 (-1) | 1,465 (-8%) | 0mo | $176,000 | $120 | 67 |
| 116 Martin St | 0.41mi | 4/2.0 | 1,440 (-10%) | 7mo | $190,000 | $132 | 59 |
| 731 Mabel St | 0.40mi | 4/1.5 | 1,386 (-13%) | 1mo | $63,000 | $45 | 56 |
| 816 Stuart Ave | 0.59mi | 3/1.0 (-1) | 1,716 (+8%) | 0mo | $145,000 | $84 | 50 |
| 608 W Ransom St | 0.48mi | 3/1.0 (-1) | 1,464 (-8%) | 8mo | $111,900 | $76 | 48 |
| 1111 Woodward Ave | 0.47mi | 3/1.0 (-1) | 1,356 (-15%) | 10mo | $137,000 | $101 | 36 |
Match score weights: distance 35% · size 25% · config 20% · recency 20%. Top-matched comps best support the ARV.
Projected returns pro-forma
-3.0% appreciation · 0.0% rent growth · sell at horizon
- IRR
- 7.0%
- Equity multiple
- 1.26×
- Total profit
- $7,738
- Equity at exit
- $15,656
- IRR
- 13.4%
- Equity multiple
- 1.92×
- Total profit
- $26,906
- Equity at exit
- $9,078
Cash invested: $29,400 (down + closing). Projections, not guarantees.
Landlord ↔ Tenant lean methodology
- Overall (STATE)
- 62 Landlord-Friendly
- State Michigan
- 62 Landlord-Friendly · EVEN
- County
- — inherits STATE
- City
- — inherits STATE
ZIP-level market 49007
- Rents YoY
- -0.8%
- Active inventory
- 77
- Price-to-rent
- 5.6×
Monthly cashflow live
- Estimated rent
- $1,571 medium interval (Pro) →
- Mortgage (P&I)
- −$551
- Tax from tax record
- −$187 /mo · $2,241/yr
- Insurance
- −$44
- HOA
- −$0
- Vacancy / Maint / Mgmt
- −$330
- Net cashflow
- $460
Break-even live
UW: 25.0% down · 7.5% · 30yr · 1.5% tax · 5.0% vac · 8.0% maint · 8.0% mgmt
Financing live
Cash to close
- Down payment
- $26,250
- Closing costs
- $3,150
- Reserves months
- —
- Total cash needed
- —
Loan-product check · same deal, 3 products live
Conventional
25% down · 7.5% · 30yr
- Down + closing
- —
- Monthly P&I
- —
- Monthly cashflow
- —
- DSCR
- —
- Eligible?
- —
Personal DTI + credit; lowest rate.
DSCR
20% down · 8.5% · 30yr
- Down + closing
- —
- Monthly P&I
- —
- Monthly cashflow
- —
- DSCR
- —
- Eligible?
- —
No personal income docs; deal must DSCR.
Hard money
10% down · 12.0% · 12mo
- Down + closing
- —
- Monthly P&I
- —
- Monthly cashflow
- —
- DSCR
- —
- Eligible?
- —
Short-term bridge; refi at stabilization.
Rent comps 5 comps
| Address | Beds | Baths | Sqft | Rent | $/sqft | DOM | Units | Dist |
|---|---|---|---|---|---|---|---|---|
| 708 Elizabeth St Kalamazoo, MI | 3.0 | 1.5 | 1128 | $1,250 | $1.11 | 13d | 1 | 0.37mi |
| 722 W Kalamazoo Ave Unit 2 Kalamazoo, MI | 3.0 | 1.0 | 1800 | $1,600 | $0.89 | 20d | 1 | 0.67mi |
| 2004 Woodward Ave Kalamazoo, MI | 4.0 | 2.0 | 1710 | $1,500 | $0.88 | 13d | 1 | 0.71mi |
| 838 W Main St Kalamazoo, MI | 4.0 | 1.0 | 1470 | $1,300 | $0.88 | 20d | 1 | 0.88mi |
| 807 Central Park Cir Kalamazoo, MI | 1.0–3.0 | 1.0–2.0 | 1089 | $2,345 | $2.15 | 13d | 12 | 1.33mi |
Listing history 11 events
-
2026-06-07statusdays on market $105,000 Pending 34 DOM
-
2026-06-05days on market $105,000 Active 32 DOM
-
2026-06-03days on market $105,000 Active 31 DOM
-
2026-06-02days on market $105,000 Active 30 DOM
-
2026-06-01days on market $105,000 Active 29 DOM
-
2026-05-31days on market $105,000 Active 28 DOM
-
2026-05-30days on market $105,000 Active 27 DOM
-
2026-05-03$125,000 Active
Show marketing remark (977 chars)
Welcome to an exceptional investment opportunity that seamlessly blends comfort, convenience, and income potential. This duplex features two thoughtfully designed units, making it ideal for owner-occupants or savvy investors looking to grow their portfolio. The lower unit offers a spacious 3-bedroom, 1-bath layout filled with natural light and generous living space--perfect for everyday living and entertaining. The upper unit features a well-designed 2-bedroom, 1-bath floor plan with a cozy yet functional feel, offering great flow and inviting charm for tenants or extended living arrangements. Perfectly positioned just minutes from downtown, this property provides unbeatable access to public transportation, making commuting effortless. Enjoy the convenience of nearby grocery stores, restaurants, shopping, and everyday amenities--all within close reach. Adding to its value, the property is city certified through August 2027, providing peace of mind and confidence.
-
2026-05-03$125,000 Active 977-char remark
Show marketing remark (977 chars)
Welcome to an exceptional investment opportunity that seamlessly blends comfort, convenience, and income potential. This duplex features two thoughtfully designed units, making it ideal for owner-occupants or savvy investors looking to grow their portfolio. The lower unit offers a spacious 3-bedroom, 1-bath layout filled with natural light and generous living space--perfect for everyday living and entertaining. The upper unit features a well-designed 2-bedroom, 1-bath floor plan with a cozy yet functional feel, offering great flow and inviting charm for tenants or extended living arrangements. Perfectly positioned just minutes from downtown, this property provides unbeatable access to public transportation, making commuting effortless. Enjoy the convenience of nearby grocery stores, restaurants, shopping, and everyday amenities--all within close reach. Adding to its value, the property is city certified through August 2027, providing peace of mind and confidence.
-
2014-10-17historical
-
1990-10-26$19,900
ⓘ Source: listings_history table (triggers on properties + properties_extension) + one-shot
backfill from property_details.listing_events for pre-trigger history.
Tax reassessment forecast MI · Partial reset (capped growth)
- Current annual tax
- $2,241 · $187/mo
- Projected year-2 tax
- $2,241 · $187/mo
- Expected delta
- $0/yr ($0/mo · 0.0%)
ⓘ Screening estimate from a state-policy table — verify with the county assessor before closing.
Climate risk First Street
- Flood 1/10 Low FEMA zone X (unshaded) · 0% chance over 30 yrs
- Wildfire 1/10 Low
- Heat 2/10 Low 7 d/yr ≥100°F today · 16 d/yr by 30 yrs out
- Wind 2/10 Low
- Air quality 2/10 Low 1 unhealthy d/yr today · 2 by 30 yrs out
Nearby sold comps map
Loading sold comps map…
Walkable amenities ~0.75 mi
Loading nearby amenities…
Taxation est. · year 1
- Rental income
- $18,852
- − Mortgage interest
- −$5,882
- − Property taxes
- −$2,241
- − Insurance
- −$525
- − Repairs & maintenance
- −$1,508
- − Management
- −$1,508
- − Depreciation
- −$3,055
- Taxable income
- $4,134
- Est. tax owed @ 24.0%
- −$992
- After-tax cash flow
- $4,528/yr
For passive investors: Depreciation is non-cash, so a rental often shows a tax loss while cash-flowing — sheltering income. Rental losses are passive: they offset passive income freely, and up to $25,000/yr can offset ordinary (W-2) income if you actively participate and your MAGI is under $100k (phasing out to $0 by $150k); unused losses carry forward. On sale, claimed depreciation is recaptured at up to 25%, and gains may owe capital-gains tax (a 1031 exchange can defer both). Figures are a year-1 estimate at your 24.0% rate — not tax advice; consult a CPA.
Schools (NCES district)
- District
- Kalamazoo Public Schools
- NCES district ID
- 2619950
- Math proficiency
- 43% ▲ 13.00%
- Reading proficiency
- 72% ▲ 33.00%
- Median HH income
- $35,291
- Composite
- 47.48/100
- National rank
- #2275
- State rank
- #71 of 540 in MI
Livability — Kalamazoo
- Score
- 76/100
- State rank
- #141
- US rank
- #3492
Category grades
Schools grade is shown separately in the Schools card above.
Census & demographics
- Census place
- Kalamazoo, MI
- County
- Kalamazoo County · 224,317 people
- City population
- 121,397
- Metro
- Kalamazoo-Portage, MI
- Population (ZIP)
- 9,836
- Household income
- $39,344
- Rent vs Own
- Severe rent burden
- 816.0
Population outlook (Kalamazoo County) Hauer SSP2
- Today (2025)
- 280,982 people
- By 2030
- 292,068 · +3.9%
- By 2040
- 312,191 · +11.1%
- By 2050
- 331,196 · +17.9%
- By 2075
- 379,021 · +34.9%
- By 2100
- 396,579 · +41.1%
Race, ethnicity, and origin ACS 2023
- Neighborhood character
- Diverse neighborhood (Simpson 0.61)
- Race & ethnicity
- White 44% Black 44% Two or more races 7% Hispanic / Latino 3%
- Common ancestry
- Iranian 3% Romanian 2% Lithuanian 1%
- Foreign-born
- 3% · Canada
- Languages at home
- 94% English-only · Spanish 4% French/Haitian/Cajun 1% Arabic 1%
Political lean MEDSL · Kalamazoo
- 2024 margin
- D (+17.7) · D 58.0% · R 40.3% · Other 1.7%
- 2008→2024 swing
- -1.8pp toward R · 2008: 19.5pp · 2024: 17.7pp
- All cycles
- 2024: D+17.7 2020: D+18.7 2016: D+12.8 2012: D+13.3 2008: D+19.5
Not yet ingested
- Civics
- —
Market trends
- HPI YoY
- ▼ -68.80%
- Current HPI
- 112.4973
- Rent YoY
- ▼ -0.85%
- Metro
- Kalamazoo-Portage, MI
- State GDP YoY
- ▲ 1.37%
- F500 in state
- 28
Industry mix (Fortune 500 HQ in MI)
| Industry | F500 HQs | Revenue |
|---|---|---|
| Automotive Parts | 3 | $48B |
|
||
| Automotive | 2 | $372B |
|
||
| Chemicals | 1 | $45B |
|
||
| Automotive Retail | 1 | $29B |
|
||
| Healthcare / Medical Devices | 1 | $23B |
|
||
| Automotive Technology | 1 | $20B |
|
||
Price history
+528.1% since first listed4 events — show timeline
- 2026-05-03 Listed $125,000 REALCOMP
- 2026-05-03 Listed $125,000 MiRealSource-MiMLS
- 2014-10-17 Listing Removed — SW Michigan MLS
- 1990-10-26 Listed $19,900 SW Michigan MLS
Property tax history
+22.4%/yrLatest (2025): $2,241 · +2.3% YoY. Source: county tax records.
Cash-flow waterfall
monthlySold comps — $/sqft
last 12 mo · ≤1 miLoading sold comps…