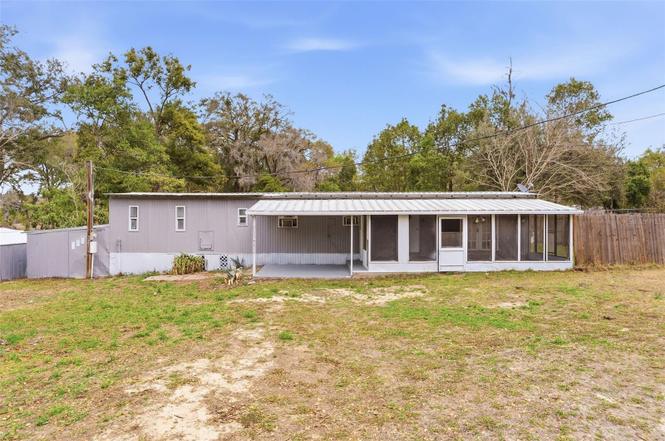
37421 Marcy Ln · Zephyrhills West, FL
Flood risk 1/10 · Minimal
- FEMA flood zone
- X (unshaded)
- Chance of flooding over 30 yrs
- 0.0%
- Est. flood insurance / yr
- $507 – $1,088
Fire risk 4/10 · Minor
- Est. fire insurance / yr
- $947 – $1,759
Heat risk 9/10 · Severe
- Hot days now (above 108°F)
- 7 days/yr
- Hot days in 30 yrs
- 21 days/yr
Wind risk 9/10 · Severe
- Chance of severe wind over 30 yrs
- 99.0%
Air-quality risk 2/10 · Minimal
- Unhealthy air days now
- 1 days/yr
- Unhealthy air days in 30 yrs
- 2 days/yr
Risk factors via First Street. Map © Google.
Why this score? — see what drove the C- grade
The composite is a weighted blend of 9 inputs, each scored 0–100. Each bar is that input's sub-score; the figure is the points it added to the 100-point composite (weight × sub-score).
- Cash flow +20.6/30.0
- ARV discount +7.5/15.0
- DSCR +6.5/10.0
- 1% rule +4.9/10.0
- Schools +4.3/10.0
- Livability +3.1/5.0
- Condition / age +2.5/5.0
- Rent growth +1.6/5.0
- Appreciation +0.0/10.0
$129,900
🖨 Deal sheet 📄 Offer letter ✓ Due diligence
Listing remarks
Escape the hustle and bustle and discover peace and tranquility in this charming 2-bedroom, 1-bath home—perfect for anyone seeking a serene, nature-filled lifestyle. Featuring an open-concept living room and kitchen combo, this layout offers a bright and versatile space with endless possibilities to design and personalize to your taste. Whether you envision cozy evenings at home or an inviting space to entertain, this blank canvas is ready for your creative touch. Enjoy the freedom of no HOA, no CDD fees, and no flood insurance required, giving you flexibility and long-term savings. Ideally located, you’ll appreciate the balance of being close to everyday conveniences while stil
Key facts
- No flood insurance
- No cdd fees
- Countryside setting
Tags
Property features AI
Finance
- Other: Property type: Residential; Property sub-type: Mobile Home; Zoning: RMH; Lot size approximately 0.16 acres; Total living area approximately 720 square feet
- HOA & community: No association; No association approval required
Exterior
- Utilities: Well water; Septic tank; Public utilities available
- Home design: Residential mobile home (single wide); One story; Faces south; Entry level: One
- Construction: Vinyl siding; Metal roof; Crawlspace foundation; Built as a single-wide mobile home
- Exterior features: Private mailbox; Dirt road access
Interior
- Kitchen: Cooktop; Range; Refrigerator
- Bedrooms: 2 bedrooms
- Flooring: Vinyl flooring
- Bathrooms: 1 full bathroom
- Heating & cooling: Ductless heating; Wall/window air conditioning units
- Interior features: Kitchen/family room combo; 6 total rooms
- Laundry & utility: Outdoor laundry area
Neighborhood map
What this means for you Summary
Snapshot
- This is a 2-bed/2.0-bath manufactured listed at $130k.
Deal economics
- At list price, monthly cash flow is $173 ($2k/yr) — positive.
- The deal already cash-flows at list — no discount required.
- To meet the 1% rule (rent ≥ 1% of price), the offer needs to be $128k (1.5% below list).
- Recommended offer: $118k (9.0% below list) — sets the bar for market timing.
Location & tenants
- Location reads 61/100 on livability (#772 in FL) — a middle-class / working-renter tenant base. Strengths: cost of living A+, housing A+; Watch: schools D-, amenities F, commute F.
- Pasco (suburban): math 50% / reading 52% proficiency, ranked #32 of 73 in FL (top 44%) — acceptable for families but not a draw, mixed tenant base, ~2y average lease.
- Market conditions: Rents falling (-3.6%/yr); 294 active listings in the ZIP; 16 comparable units currently listed for rent nearby; rentals at typical pace (median 25d on market — plan ~3-4 weeks tenant-placement turnaround); 6,765 units permitted in Pasco County in 2024 (1,250 in 5+ unit buildings).
- This rent runs 31% of the median local income ($49k/yr) — at the standard rent-burdened threshold; future hikes will face affordability resistance.
Forward outlook
- Local home prices are declining (-3.0%/yr); year-one equity from $898 of loan paydown is wiped out by about $4k of value loss. Plan a longer hold.
- Pasco County population projected at +29% by 2050 — long-run rental-demand tailwind backs the buy-and-hold thesis.
Negotiation context
- It's been on market 105 days — a 9% lower offer ($118k) is reasonable based on typical stale-listing flexibility.
- Current owner paid $14k; list at $130k implies a 824% gain — meaningful room to come down on a strong offer.
Risks & watch-outs
- Climate carrying-cost: severe wind risk, 99% chance of damaging wind over 30y; extreme-heat days projected 7→21/yr by 2055 (HVAC capex compounding) — expect insurance premiums to compound above CPI over the hold.
Questions for the listing agent
- It's been on market 105 days. Have you received any prior offers? Is the seller open to a 9% concession, seller financing, or rate buy-down credit?
- Built in 1973 — when were the roof, HVAC, electrical panel, plumbing, and water heater last replaced?
- Why hasn't it sold? Are there any deal-killer items the seller is aware of (foundation, flood, title, zoning, code violations)?
- Is there a deadline driving the sale (1031 exchange, divorce, estate, relocation)? That informs how much negotiation room exists.
- Schools are D-rated, which usually means shorter tenancies and higher turnover. Who's the typical renter profile here, and what's been the actual vacancy rate?
- What's the average days-on-market for RENTAL listings here right now (not sales)? A rising rental-DOM trend means longer vacancies and softer asking-rent achievability than the comps imply.
- What's the recent tenant-quality profile in this submarket — average credit score on applications, eviction rate, late-payment / NSF rate, and stable-employment percentage? A property-management company in the area should have these aggregated.
- How much new for-sale + rental construction is in the pipeline within 1–3 miles? Heavy new supply typically softens prices + rents 12–24 months out; constrained supply supports both.
Investment metrics
- 1% rule
- 0.99% ✗
- Cap rate
- 7.89%
- Cash-on-cash
- 5.71%
- DSCR
- 1.25
- GRM
- 8.5
CMA / ARV
- ARV (on-the-fly)
- $57,600
- Comps found
- 8
Show comp detail 8 sales within ~0.75 mi
| Address | Dist | Beds/Ba | Sqft | Sold | Price | $/sf | Match |
|---|---|---|---|---|---|---|---|
| 6109 Creston St | 0.40mi | 2/2.0 | 704 (-2%) | 1mo | $55,500 | $79 | 77 |
| 6124 Crestview Ln | 0.16mi | 2/1.5 | 672 (-7%) | 12mo | $44,500 | $66 | 70 |
| 6049 Minerva St | 0.38mi | 2/2.0 | 672 (-7%) | 15mo | $52,500 | $78 | 59 |
| 5509 Barbara St | 0.57mi | 2/1.0 | 720 (0%) | 18mo | $85,000 | $118 | 54 |
| 6044 Alpine Dr | 0.18mi | 1/1.0 (-1) | 624 (-13%) | 8mo | $45,000 | $72 | 54 |
| 37235 Eileen Ave | 0.74mi | 2/2.0 | 784 (+9%) | 6mo | $128,000 | $163 | 46 |
| 37302 Carol Ave | 0.66mi | 1/1.0 (-1) | 684 (-5%) | 7mo | $55,000 | $80 | 46 |
| 5346 Vera St | 0.72mi | 2/2.0 | 816 (+13%) | 18mo | $120,000 | $147 | 29 |
Match score weights: distance 35% · size 25% · config 20% · recency 20%. Top-matched comps best support the ARV.
Projected returns pro-forma
-3.0% appreciation · 0.0% rent growth · sell at horizon
- IRR
- -10.7%
- Equity multiple
- 0.62×
- Total profit
- $-13,803
- Equity at exit
- $19,369
- IRR
- -6.1%
- Equity multiple
- 0.66×
- Total profit
- $-12,401
- Equity at exit
- $11,231
Cash invested: $36,372 (down + closing). Projections, not guarantees.
Landlord ↔ Tenant lean methodology
- Overall (STATE)
- 87 Strongly Landlord-Friendly
- State Florida
- 87 Strongly Landlord-Friendly · R+3
- County
- — inherits STATE
- City
- — inherits STATE
ZIP-level market 33542
- Home prices YoY
- -20.6%
- Rents YoY
- -3.6%
- Active inventory
- 294
- Price-to-rent
- 8.5×
Monthly cashflow live
- Estimated rent
- $1,280 high interval (Pro) →
- Mortgage (P&I)
- −$681
- Tax from tax record
- −$103 /mo · $1,234/yr
- Insurance
- −$54
- HOA
- −$0
- Vacancy / Maint / Mgmt
- −$269
- Net cashflow
- $173
Break-even live
UW: 25.0% down · 7.5% · 30yr · 1.5% tax · 5.0% vac · 8.0% maint · 8.0% mgmt
Financing live
Cash to close
- Down payment
- $32,475
- Closing costs
- $3,897
- Reserves months
- —
- Total cash needed
- —
Loan-product check · same deal, 3 products live
Conventional
25% down · 7.5% · 30yr
- Down + closing
- —
- Monthly P&I
- —
- Monthly cashflow
- —
- DSCR
- —
- Eligible?
- —
Personal DTI + credit; lowest rate.
DSCR
20% down · 8.5% · 30yr
- Down + closing
- —
- Monthly P&I
- —
- Monthly cashflow
- —
- DSCR
- —
- Eligible?
- —
No personal income docs; deal must DSCR.
Hard money
10% down · 12.0% · 12mo
- Down + closing
- —
- Monthly P&I
- —
- Monthly cashflow
- —
- DSCR
- —
- Eligible?
- —
Short-term bridge; refi at stabilization.
Rent comps 16 comps
| Address | Beds | Baths | Sqft | Rent | $/sqft | DOM | Units | Dist |
|---|---|---|---|---|---|---|---|---|
| 6302 Abbott Station Dr Zephyrhills, FL | 3.0 | 1.0–2.5 | 855 | $1,732 | $2.02 | 2d | 142 | 0.33mi |
| 5611 1st St Zephyrhills, FL | 1.0 | 1.0 | 600 | $1,095 | $1.82 | 16d | 1 | 0.64mi |
| 38010 14th Ave Apt 3 Zephyrhills, FL | 1.0 | 1.0 | 537 | $1,195 | $2.23 | 24d | 1 | 0.64mi |
| 6052 10th St Zephyrhills, FL | 2.0 | 1.0 | 644 | $1,200 | $1.86 | 24d | 1 | 0.94mi |
| 6991 Fort King Rd Zephyrhills, FL | 1.0 | 1.0 | 500 | $899 | $1.80 | 24d | 1 | 0.96mi |
| 5168 Crooked Ln Zephyrhills, FL | 2.0 | 1.0 | 600 | $1,645 | $2.74 | 22d | 1 | 1.00mi |
| 38044 6th Ave Unit 38044 Zephyrhills, FL | 1.0 | 1.0 | 494 | $950 | $1.92 | 24d | 1 | 1.07mi |
| 5426 8th St #1 Zephyrhills, FL | 1.0 | 1.0 | 432 | $1,150 | $2.66 | 24d | 1 | 1.14mi |
| 5150 6th St Zephyrhills, FL | 1.0 | 1.0 | 600 | $925 | $1.54 | 24d | 1 | 1.23mi |
| 4833 Royal Palm Dr Zephyrhills, FL | 2.0 | 1.0 | 672 | $1,090 | $1.62 | 24d | 1 | 1.26mi |
| 5208 7th St Zephyrhills, FL | 1.0 | 1.0 | 550 | $950 | $1.73 | 5d | 1 | 1.29mi |
| 5214 7th St Zephyrhills, FL | 1.0 | 1.0 | 550 | $950 | $1.73 | 5d | 1 | 1.30mi |
| 5214 7th St Zephyrhills, FL | 1.0 | 1.0 | 550 | $1,100 | $2.00 | 16d | 1 | 1.30mi |
| 5206 7th St Zephyrhills, FL | 1.0 | 1.0 | 550 | $950 | $1.73 | 5d | 1 | 1.30mi |
| 38748 Calumet Ave Zephyrhills, FL | 2.0 | 1.0 | 750 | $1,100 | $1.47 | 5d | 1 | 1.37mi |
| 38112 Townview Ave Zephyrhills, FL | 1.0 | 1.0 | 700 | $1,100 | $1.57 | 24d | 1 | 1.40mi |
Listing history 18 events
-
2026-06-18days on market $129,900 Active 105 DOM
-
2026-06-17days on market $129,900 Active 104 DOM
-
2026-06-16days on market $129,900 Active 103 DOM
-
2026-06-15days on market $129,900 Active 102 DOM
-
2026-06-13days on market $129,900 Active 100 DOM
-
2026-06-09days on market $129,900 Active 96 DOM
-
2026-06-08days on market $129,900 Active 95 DOM
-
2026-06-07days on market $129,900 Active 94 DOM
-
2026-06-04days on market $129,900 Active 91 DOM
-
2026-06-03days on market $129,900 Active 90 DOM
-
2026-06-02days on market $129,900 Active 89 DOM
-
2026-06-01days on market $129,900 Active 88 DOM
-
2026-05-31days on market $129,900 Active 87 DOM
-
2026-04-21price $129,900
-
2026-03-05$139,900 Active
-
2014-08-04soldstatus $14,053
-
2007-06-06soldstatus $39,000
-
2000-04-27soldstatus $23,500
ⓘ Source: listings_history table (triggers on properties + properties_extension) + one-shot
backfill from property_details.listing_events for pre-trigger history.
Tax reassessment forecast FL · Resets to sale price
- Current annual tax
- $1,234 · $103/mo
- Projected year-2 tax
- $1,234 · $103/mo
- Expected delta
- $0/yr ($0/mo · 0.0%)
ⓘ Screening estimate from a state-policy table — verify with the county assessor before closing.
Climate risk First Street
- Flood 1/10 Low FEMA zone X (unshaded) · 0% chance over 30 yrs
- Wildfire 4/10 Moderate
- Heat 9/10 Extreme 7 d/yr ≥108°F today · 21 d/yr by 30 yrs out
- Wind 9/10 Extreme 99% chance of damaging wind over 30 yrs
- Air quality 2/10 Low 1 unhealthy d/yr today · 2 by 30 yrs out
Nearby sold comps map
Loading sold comps map…
Walkable amenities ~0.75 mi
Loading nearby amenities…
Taxation est. · year 1
- Rental income
- $15,358
- − Mortgage interest
- −$7,276
- − Property taxes
- −$1,234
- − Insurance
- −$650
- − Repairs & maintenance
- −$1,229
- − Management
- −$1,229
- − Depreciation
- −$3,779
- Taxable loss
- −$38
- Est. tax savings @ 24.0%
- +$9
- After-tax cash flow
- $2,084/yr
For passive investors: Depreciation is non-cash, so a rental often shows a tax loss while cash-flowing — sheltering income. Rental losses are passive: they offset passive income freely, and up to $25,000/yr can offset ordinary (W-2) income if you actively participate and your MAGI is under $100k (phasing out to $0 by $150k); unused losses carry forward. On sale, claimed depreciation is recaptured at up to 25%, and gains may owe capital-gains tax (a 1031 exchange can defer both). Figures are a year-1 estimate at your 24.0% rate — not tax advice; consult a CPA.
Schools (NCES district)
- District
- Pasco
- NCES district ID
- 1201530
- Math proficiency
- 50% ▼ -10.00%
- Reading proficiency
- 52% ▼ -5.00%
- Median HH income
- $45,039
- Composite
- 43.14/100
- National rank
- #3074
- State rank
- #32 of 73 in FL
Livability — Zephyrhills West
- Score
- 61/100
- State rank
- #772
- US rank
- #17403
Category grades
Schools grade is shown separately in the Schools card above.
Census & demographics
- Census place
- Zephyrhills West, FL
- County
- Pasco County · 524,098 people
- Metro
- Tampa-St. Petersburg-Clearwater, FL
- Population (ZIP)
- 23,612
- Household income
- $49,316
- Rent vs Own
- Severe rent burden
- 831.0
Population outlook (Pasco County) Hauer SSP2
- Today (2025)
- 570,045 people
- By 2030
- 605,844 · +6.3%
- By 2040
- 674,806 · +18.4%
- By 2050
- 736,022 · +29.1%
- By 2075
- 862,900 · +51.4%
- By 2100
- 906,364 · +59.0%
Race, ethnicity, and origin ACS 2023
- Neighborhood character
- Predominantly White (76%)
- Race & ethnicity
- White 76% Hispanic / Latino 17% Two or more races 8% Black 4% Asian 1%
- Hispanic origin (detail)
- Mexican 2% Puerto Rican 10%
- Common ancestry
- Lithuanian 3% Romanian 2% Iranian 2%
- Foreign-born
- 5% · Canada, Jamaica
- Languages at home
- 86% English-only · Spanish 12% Other Indo-European 1% Russian/Polish/Slavic 1%
Political lean MEDSL · Pasco
- 2024 margin
- Strong R (+25.2) · D 36.9% · R 62.1% · Other 1.0%
- 2008→2024 swing
- -21.6pp toward R · 2008: -3.6pp · 2024: -25.2pp
- All cycles
- 2024: R+25.2 2020: R+20.1 2016: R+21.6 2012: R+6.7 2008: R+3.6
Not yet ingested
- Civics
- —
Market trends
- HPI YoY
- ▼ -81.25%
- Current HPI
- 313.3993
- Rent YoY
- ▼ -3.56%
- Metro
- Tampa-St. Petersburg-Clearwater, FL
- State GDP YoY
- ▲ 3.28%
- F500 in state
- 36
Industry mix (Fortune 500 HQ in FL)
| Industry | F500 HQs | Revenue |
|---|---|---|
| Industrial Technology | 2 | $29B |
|
||
| Insurance | 2 | $17B |
|
||
| Retail | 1 | $60B |
|
||
| Technology Distribution | 1 | $58B |
|
||
| Homebuilding | 1 | $35B |
|
||
| Technology Manufacturing | 1 | $35B |
|
||
Price history
+452.8% since first listed5 events — show timeline
- 2026-04-21 Price Changed $129,900 Stellar MLS as Distributed by MLS Grid
- 2026-03-05 Listed $139,900 Stellar MLS as Distributed by MLS Grid
- 2014-08-04 Sold (Public Records) $14,053 Public Records
- 2007-06-06 Sold (Public Records) $39,000 Public Records
- 2000-04-27 Sold (Public Records) $23,500 Public Records
Property tax history
+20.5%/yrLatest (2025): $1,234 · +4.8% YoY. Source: county tax records.
Cash-flow waterfall
monthlySold comps — $/sqft
last 12 mo · ≤1 miLoading sold comps…