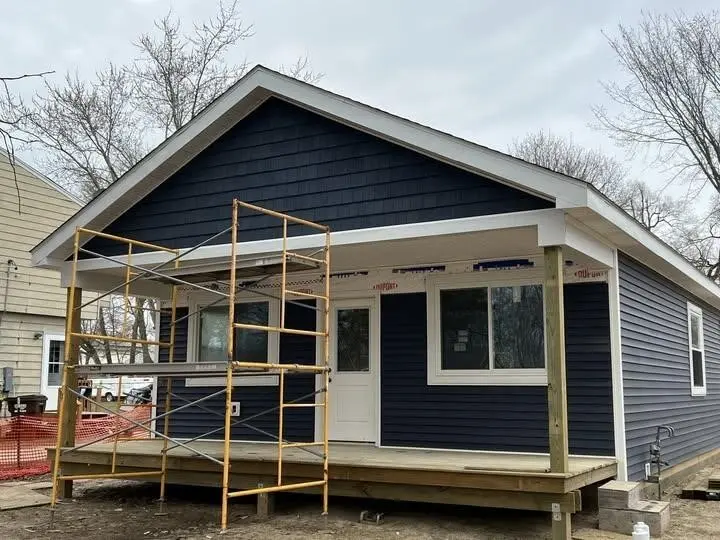
815 Howell Ave · Adrian, MI
Flood risk 1/10 · Minimal
- FEMA flood zone
- X (unshaded)
- Chance of flooding over 30 yrs
- 0.0%
- Est. flood insurance / yr
- $473 – $860
Fire risk 1/10 · Minimal
- Est. fire insurance / yr
- $784 – $1,456
Heat risk 3/10 · Minor
- Hot days now (above 98°F)
- 7 days/yr
- Hot days in 30 yrs
- 16 days/yr
Wind risk 2/10 · Minimal
- Chance of severe wind over 30 yrs
- —
Air-quality risk 2/10 · Minimal
- Unhealthy air days now
- 1 days/yr
- Unhealthy air days in 30 yrs
- 1 days/yr
Risk factors via First Street. Map © Google.
Why this score? — see what drove the C grade
The composite is a weighted blend of 9 inputs, each scored 0–100. Each bar is that input's sub-score; the figure is the points it added to the 100-point composite (weight × sub-score).
- Cash flow +25.8/30.0
- DSCR +8.6/10.0
- 1% rule +6.8/10.0
- ARV discount +4.5/15.0
- Livability +3.5/5.0
- Rent growth +2.5/5.0
- Schools +2.5/10.0
- Condition / age +2.5/5.0
- Appreciation +0.0/10.0
$160,000
🖨 Deal sheet (PDF) 📄 Offer letter ✓ Due diligence
Listing remarks MLS
Another fabulous home built by Habitat for Humanity of Lenawee County. Every attention to detail in this energy efficient new construction with a practical floor plan. This home was listed and sold same day and program is for owner occupants that qualify for the Habitat program.
Key facts
- 6,098 sq ft lot
- Built 2026
Neighborhood map
What this means for you Summary
Snapshot
- This is a 3-bed/2.0-bath single-family listed at $160k.
Deal economics
- At list price, monthly cash flow is $389 ($5k/yr) — positive.
- The deal already cash-flows at list — no discount required.
- Meets the 1% rule at list price ($2k rent vs $160k).
- Cap rate 9.2% vs local median 5.6% in Adrian — top-decile yield for the area; either an underpriced asset or a hidden risk that comps aren't pricing in. Stress-test before assuming the spread holds.
Location & tenants
- Location reads 69/100 on livability (#342 in MI) — a middle-class / working-renter tenant base. Strengths: cost of living A+, housing A+, health & safety A+; Watch: amenities D, crime F, commute F.
- Adrian School District (town): math 25% / reading 35% proficiency, ranked #370 of 540 in MI (top 68%) — families likely to look elsewhere, expect single-tenant / working-renter base with shorter leases.
- Zoned schools: Michener Elementary School (math 17% / reading 17%, grade F, #1,149 of 1,397 statewide, top 84%, 284 students, 92% FRL); Springbrook Middle School (math 29% / reading 38%, grade F, #303 of 493 statewide, top 62%, 641 students, 71% FRL); Adrian High School (math 22% / reading 42%, grade F, #405 of 713 statewide, top 59%, 781 students, 63% FRL) — zoned schools average 75% FRL vs 58% district-wide (17 pts higher); higher-poverty schools than district average — tighter screening recommended.
- Market conditions: 212 active listings in the ZIP; 2 comparable units currently listed for rent nearby; 137 units permitted in Lenawee County in 2024 (0 in 5+ unit buildings).
Forward outlook
- Local home prices are declining (-3.0%/yr); year-one equity from $1k of loan paydown is wiped out by about $5k of value loss. Plan a longer hold.
- Lenawee County population projected at -18% by 2050 — secular population decline; favor cash flow + early exit over multi-decade hold.
Negotiation context
- Only 0 days on market — expect competitive offers; lowballing is unlikely to land.
- 9 sale attempts since 21y ago with the ask held roughly flat each time — persistent listings suggest the price (not the market) is what's stuck; bring a comps-based counter.
- Current owner paid $10k; list at $160k implies a 1500% gain — meaningful room to come down on a strong offer.
Questions for the listing agent
- Is there a deadline driving the sale (1031 exchange, divorce, estate, relocation)? That informs how much negotiation room exists.
- Crime grade is F in this area — have there been break-ins, vandalism, or insurance claims at this property in the last 3 years? What carrier currently insures it and at what premium?
- What's the average days-on-market for RENTAL listings here right now (not sales)? A rising rental-DOM trend means longer vacancies and softer asking-rent achievability than the comps imply.
- What's the recent tenant-quality profile in this submarket — average credit score on applications, eviction rate, late-payment / NSF rate, and stable-employment percentage? A property-management company in the area should have these aggregated.
- How much new for-sale + rental construction is in the pipeline within 1–3 miles? Heavy new supply typically softens prices + rents 12–24 months out; constrained supply supports both.
Investment metrics
- 1% rule
- 1.18% ✓
- Cap rate
- 9.21%
- Cash-on-cash
- 10.42%
- DSCR
- 1.46
- GRM
- 7.0
CMA / ARV
- ARV (on-the-fly)
- $150,000
- Comps found
- 12
Show comp detail 12 sales within ~0.75 mi
| Address | Dist | Beds/Ba | Sqft | Sold | Price | $/sf | Match |
|---|---|---|---|---|---|---|---|
| 736 State St | 0.21mi | 3/1.0 | 1,225 (+2%) | 11mo | $168,000 | $137 | 73 |
| 415 W Beecher St | 0.17mi | 2/1.0 (-1) | 1,140 (-5%) | 6mo | $135,574 | $119 | 70 |
| 424 W Summit St | 0.14mi | 3/2.0 | 1,078 (-10%) | 9mo | $135,000 | $125 | 69 |
| 734 S Winter St | 0.09mi | 3/2.0 | 1,378 (+15%) | 4mo | $204,000 | $148 | 68 |
| 322 Lawrence Ave | 0.41mi | 3/1.0 | 1,244 (+4%) | 4mo | $134,900 | $108 | 68 |
| 956 Howell Ave | 0.20mi | 3/1.0 | 1,296 (+8%) | 7mo | $140,000 | $108 | 67 |
| 980 State St | 0.31mi | 3/2.0 | 1,094 (-9%) | 6mo | $142,000 | $130 | 66 |
| 810 Division St | 0.29mi | 2/1.0 (-1) | 1,160 (-3%) | 11mo | $135,000 | $116 | 63 |
| 318 Merrick St | 0.42mi | 4/2.0 (+1) | 1,309 (+9%) | 8mo | $50,000 | $38 | 54 |
| 1162 July Dr | 0.70mi | 3/1.0 | 1,073 (-11%) | 0mo | $177,000 | $165 | 46 |
| 422 March Dr | 0.63mi | 3/1.0 | 1,073 (-11%) | 8mo | $155,000 | $144 | 42 |
| 334 Erie St | 0.61mi | 3/1.0 | 1,375 (+15%) | 10mo | $85,000 | $62 | 35 |
Match score weights: distance 35% · size 25% · config 20% · recency 20%. Top-matched comps best support the ARV.
Projected returns pro-forma
-3.0% appreciation · 3.0% rent growth · sell at horizon
- IRR
- -0.7%
- Equity multiple
- 0.98×
- Total profit
- $-1,113
- Equity at exit
- $23,857
- IRR
- 9.0%
- Equity multiple
- 1.69×
- Total profit
- $31,062
- Equity at exit
- $13,834
Cash invested: $44,800 (down + closing). Projections, not guarantees.
Landlord ↔ Tenant lean methodology
- Overall (STATE)
- 62 Landlord-Friendly
- State Michigan
- 62 Landlord-Friendly · EVEN
- County
- — inherits STATE
- City
- — inherits STATE
ZIP-level market 49221
- Active inventory
- 212
- Price-to-rent
- 7.0×
Monthly cashflow live
- Estimated rent
- $1,892 medium interval (Pro) →
- Mortgage (P&I)
- −$839
- Tax est. 1.5%
- −$200 /mo · $2,400/yr
- Insurance
- −$67
- HOA
- −$0
- Vacancy / Maint / Mgmt
- −$397
- Net cashflow
- $389
Break-even live
Sensitivity live
| Price | -10% $500 | -5% $444 | +0% $389 | +5% $334 | +10% $279 |
|---|---|---|---|---|---|
| Rent | -10% $240 | -5% $314 | +0% $389 | +5% $464 | +10% $539 |
| Rate | -1.0pp $470 | -0.5pp $430 | base $389 | +0.5pp $348 | +1.0pp $306 |
UW: 25.0% down · 7.5% · 30yr · 1.5% tax · 5.0% vac · 8.0% maint · 8.0% mgmt
Financing live
Cash to close
- Down payment
- $40,000
- Closing costs
- $4,800
- Reserves months
- —
- Total cash needed
- —
Loan-product check · same deal, 3 products live
Conventional
25% down · 7.5% · 30yr
- Down + closing
- —
- Monthly P&I
- —
- Monthly cashflow
- —
- DSCR
- —
- Eligible?
- —
Personal DTI + credit; lowest rate.
DSCR
20% down · 8.5% · 30yr
- Down + closing
- —
- Monthly P&I
- —
- Monthly cashflow
- —
- DSCR
- —
- Eligible?
- —
No personal income docs; deal must DSCR.
Hard money
10% down · 12.0% · 12mo
- Down + closing
- —
- Monthly P&I
- —
- Monthly cashflow
- —
- DSCR
- —
- Eligible?
- —
Short-term bridge; refi at stabilization.
Rent comps 2 comps
| Address | Beds | Baths | Sqft | Rent | $/sqft | DOM | Units | Dist |
|---|---|---|---|---|---|---|---|---|
| 413 E Maple Ave Unit 1 Adrian, MI | 2.0 | 1.0 | 826 | $1,500 | $1.82 | 25d | 1 | 1.09mi |
| 1962 W Cadmus Rd Adrian, MI | 3.0 | 2.0 | 1170 | $2,250 | $1.92 | 23d | 1 | 1.40mi |
Listing history 21 events
-
2026-04-02historical 279-char remark
Show marketing remark (279 chars)
Another fabulous home built by Habitat for Humanity of Lenawee County. Every attention to detail in this energy efficient new construction with a practical floor plan. This home was listed and sold same day and program is for owner occupants that qualify for the Habitat program.
-
2026-04-02$160,000 279-char remark
Show marketing remark (279 chars)
Another fabulous home built by Habitat for Humanity of Lenawee County. Every attention to detail in this energy efficient new construction with a practical floor plan. This home was listed and sold same day and program is for owner occupants that qualify for the Habitat program.
-
2026-04-02$160,000
Show marketing remark (279 chars)
Another fabulous home built by Habitat for Humanity of Lenawee County. Every attention to detail in this energy efficient new construction with a practical floor plan. This home was listed and sold same day and program is for owner occupants that qualify for the Habitat program.
-
2026-04-02historical
Show marketing remark (279 chars)
Another fabulous home built by Habitat for Humanity of Lenawee County. Every attention to detail in this energy efficient new construction with a practical floor plan. This home was listed and sold same day and program is for owner occupants that qualify for the Habitat program.
-
2017-04-03soldstatus $10,000
-
2017-04-03soldstatus $10,000 Closed
-
2017-03-27historical Keep Showing-Contgcy Appl
-
2017-03-17price $9,600
-
2017-02-14historical
-
2017-02-13historical
-
2017-02-11price $10,600
-
2017-02-10$10,600,000 Active
-
2017-02-10$9,600
-
2017-02-01$10,600 Active
-
2017-02-01$10,600 Active
-
2010-04-16historical
-
2010-04-15historical
-
2005-07-21$55,000
-
2005-07-21$55,000
ⓘ Source: listings_history table (triggers on properties + properties_extension) + one-shot
backfill from property_details.listing_events for pre-trigger history.
Climate risk First Street
- Flood 1/10 Low FEMA zone X (unshaded) · 0% chance over 30 yrs
- Wildfire 1/10 Low
- Heat 3/10 Moderate 7 d/yr ≥98°F today · 16 d/yr by 30 yrs out
- Wind 2/10 Low
- Air quality 2/10 Low 1 unhealthy d/yr today · 1 by 30 yrs out
Nearby sold comps map
Loading sold comps map…
Walkable amenities ~0.75 mi
Loading nearby amenities…
Taxation est. · year 1
- Rental income
- $22,707
- − Mortgage interest
- −$8,962
- − Property taxes
- −$2,400
- − Insurance
- −$800
- − Repairs & maintenance
- −$1,817
- − Management
- −$1,817
- − Depreciation
- −$4,655
- Taxable income
- $2,257
- Est. tax owed @ 24.0%
- −$542
- After-tax cash flow
- $4,128/yr
For passive investors: Depreciation is non-cash, so a rental often shows a tax loss while cash-flowing — sheltering income. Rental losses are passive: they offset passive income freely, and up to $25,000/yr can offset ordinary (W-2) income if you actively participate and your MAGI is under $100k (phasing out to $0 by $150k); unused losses carry forward. On sale, claimed depreciation is recaptured at up to 25%, and gains may owe capital-gains tax (a 1031 exchange can defer both). Figures are a year-1 estimate at your 24.0% rate — not tax advice; consult a CPA.
Schools (NCES district)
- District
- Adrian School District
- NCES district ID
- 2601950
- Math proficiency
- 25% ▼ -1.00%
- Reading proficiency
- 35% ▼ -2.00%
- Median HH income
- $41,288
- Composite
- 25.33/100
- National rank
- #7480
- State rank
- #370 of 540 in MI
Livability — Adrian
- Score
- 69/100
- State rank
- #342
- US rank
- #8722
Category grades
Schools grade is shown separately in the Schools card above.
Census & demographics
- Census place
- Adrian, MI
- City population
- 41,041
- Population (ZIP)
- 41,041
Population outlook (Lenawee County) Hauer SSP2
- Today (2025)
- 95,497 people
- By 2030
- 92,722 · -2.9%
- By 2040
- 85,641 · -10.3%
- By 2050
- 77,971 · -18.4%
- By 2075
- 60,043 · -37.1%
- By 2100
- 41,468 · -56.6%
Race, ethnicity, and origin ACS 2023
- Neighborhood character
- Predominantly White (77%)
- Race & ethnicity
- White 77% Hispanic / Latino 14% Two or more races 8% Black 4%
- Hispanic origin (detail)
- Mexican 12%
- Common ancestry
- Romanian 3% Lithuanian 3% Italian 2%
- Foreign-born
- 3% · Canada
- Languages at home
- 93% English-only · Spanish 6% Arabic 1%
Political lean MEDSL · Lenawee
- 2024 margin
- Strong R (+23.0) · D 37.8% · R 60.8% · Other 1.4%
- 2008→2024 swing
- -28.1pp toward R · 2008: 5.1pp · 2024: -23.0pp
- All cycles
- 2024: R+23.0 2020: R+19.9 2016: R+21.1 2012: R+1.3 2008: D+5.1
Not yet ingested
- Civics
- —
Market trends
- HPI YoY
- ▼ -143.64%
- Current HPI
- 237.3796
- Rent YoY
- —
- Metro
- —
- State GDP YoY
- ▲ 1.37%
- F500 in state
- 28
Industry mix (Fortune 500 HQ in MI)
| Industry | F500 HQs | Revenue |
|---|---|---|
| Automotive Parts | 3 | $48B |
|
||
| Automotive | 2 | $372B |
|
||
| Chemicals | 1 | $45B |
|
||
| Automotive Retail | 1 | $29B |
|
||
| Healthcare / Medical Devices | 1 | $23B |
|
||
| Automotive Technology | 1 | $20B |
|
||
Price history
+190.9% since first listed21 events — show timeline
- 2026-04-02 Listing Removed — SW Michigan MLS
- 2026-04-02 Listed $160,000 SW Michigan MLS
- 2026-04-02 Listed $160,000 MiRealSource-MiMLS
- 2026-04-02 Listing Removed — MiRealSource-MiMLS
- 2026-04-02 Listed $160,000 REALCOMP
- 2026-04-02 Listing Removed — REALCOMP
- 2017-04-03 Sold (MLS) $10,000 MiRealSource-MiMLS
- 2017-04-03 Sold (MLS) $10,000 REALCOMP
- 2017-03-27 Contingent — MiRealSource-MiMLS
- 2017-03-17 Price Changed $9,600 MiRealSource-MiMLS
- 2017-02-14 Listing Removed — MiRealSource-MiMLS
- 2017-02-13 Listing Removed — REALCOMP
- 2017-02-11 Price Changed $10,600 MiRealSource-MiMLS
- 2017-02-10 Listed $10,600,000 MiRealSource-MiMLS
- 2017-02-10 Listed $9,600 REALCOMP
- 2017-02-01 Listed $10,600 MiRealSource-MiMLS
- 2017-02-01 Listed $10,600 REALCOMP
- 2010-04-16 Listing Removed — REALCOMP
- 2010-04-15 Listing Removed — MiRealSource-MiMLS
- 2005-07-21 Listed $55,000 MiRealSource-MiMLS
- 2005-07-21 Listed $55,000 REALCOMP
Property tax history
-10.7%/yrLatest (2023): $242 · -50.9% YoY. Source: county tax records.
Cash-flow waterfall
monthlySold comps — $/sqft
last 12 mo · ≤1 miLoading sold comps…