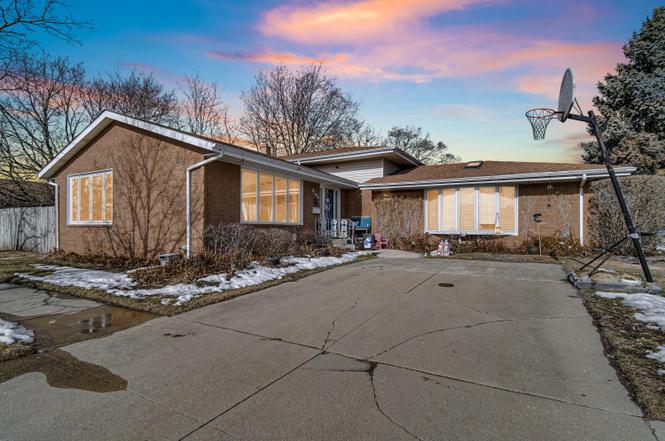
8796 Madison Ave · Munster, IN
Flood risk 6/10 · Moderate
- FEMA flood zone
- X (unshaded)
- Chance of flooding over 30 yrs
- 0.67%
- Est. flood insurance / yr
- $473 – $860
Fire risk 1/10 · Minimal
- Est. fire insurance / yr
- $717 – $1,331
Heat risk 3/10 · Minor
- Hot days now (above 102°F)
- 7 days/yr
- Hot days in 30 yrs
- 15 days/yr
Wind risk 2/10 · Minimal
- Chance of severe wind over 30 yrs
- 0.0%
Air-quality risk 4/10 · Minor
- Unhealthy air days now
- 5 days/yr
- Unhealthy air days in 30 yrs
- 6 days/yr
Risk factors via First Street. Map © Google.
Why this score? — see what drove the F grade
The composite is a weighted blend of 9 inputs, each scored 0–100. Each bar is that input's sub-score; the figure is the points it added to the 100-point composite (weight × sub-score).
- Cash flow +8.3/30.0
- Schools +5.7/10.0
- Livability +4.0/5.0
- Rent growth +2.5/5.0
- Condition / age +2.5/5.0
- DSCR +2.3/10.0
- 1% rule +2.2/10.0
- ARV discount +2.2/15.0
- Appreciation +0.0/10.0
$420,000
🖨 Deal sheet (PDF) 📄 Offer letter ✓ Due diligence
Listing remarks
Within walking distance to Munster's excellent High school and Middle school, this 4 bedroom 2 bathroom Quad is well-maintained and spacious. The home offers a thoughtful layout with exceptional indoor and outdoor living spaces. Highlights include a large game room with its own dedicated furnace and central air, also located in the game room is a hot tub and ping pong table included with the sale. The family room has a gas fireplace, and oversized windows throughout that provide abundant natural light. The home features four bedrooms and 2 bathrooms, with luxury vinyl flooring in the bedrooms installed approximately 1 year ago. Living spaces include a formal dining room, living room, family
Key facts
- Hot tub
- Ping pong table
- Gas fireplace
Tags
Neighborhood map
What this means for you Summary
Snapshot
- This is a 3-bed/2.0-bath single-family listed at $420k.
Deal economics
- At list price, monthly cash flow is $-385 ($-5k/yr) — negative.
- To cash-flow at today's rent, offer at most $352k (16.2% below list).
- To meet the 1% rule (rent ≥ 1% of price), the offer needs to be $303k (27.9% below list).
- Recommended offer: $303k (27.9% below list) — sets the bar for 1% rule.
Location & tenants
- Location reads 81/100 on livability (#17 in IN, #1,427 nationally) — a professional / high-income tenant draw. Strengths: crime A+, employment A+, cost of living A+; Watch: amenities F, commute F.
- School Town Of Munster (suburban): math 65% / reading 64% proficiency, ranked #6 of 301 in IN (top 2%) — acceptable for families but not a draw, mixed tenant base, ~2y average lease; only 14% free/reduced lunch — higher-income household profile.
- Zoned schools: James B Eads Elementary School (math 75% / reading 57%, grade B+, #71 of 994 statewide, top 7%, 507 students, 33% FRL); Wilbur Wright Middle School (math 51% / reading 59%, grade B-, #26 of 330 statewide, top 8%, 908 students, 24% FRL); Munster High School (math 71% / reading 91%, grade A, #4 of 369 statewide, top 1%, 1,564 students, 23% FRL).
- Market conditions: 116 active listings in the ZIP; 4 comparable units currently listed for rent nearby; rentals leasing fast (median 12d on market — plan ~1-2 weeks tenant-placement turnaround); high-income renter base; 1,642 units permitted in Lake County in 2024 (14 in 5+ unit buildings).
- This rent runs 33% of the median local income ($110k/yr) — at the standard rent-burdened threshold; future hikes will face affordability resistance.
Forward outlook
- Local home prices are declining (-3.0%/yr); year-one equity from $3k of loan paydown is wiped out by about $13k of value loss. Plan a longer hold.
- Lake County population projected to shrink 7% by 2050 — rents likely to lag national; underwrite the cash flow, not the appreciation.
Negotiation context
- It's been on market 61 days — a 6% lower offer ($395k) is reasonable based on typical stale-listing flexibility.
Risks & watch-outs
- Climate carrying-cost: major flood risk — expect insurance premiums to compound above CPI over the hold.
Questions for the listing agent
- What do current leases actually rent for vs. the listed asking? Can we see a recent rent roll and the last 12 months of T-12 income?
- It's been on market 61 days. Have you received any prior offers? Is the seller open to a 28% concession, seller financing, or rate buy-down credit?
- Built in 1976 — when were the roof, HVAC, electrical panel, plumbing, and water heater last replaced?
- Why hasn't it sold? Are there any deal-killer items the seller is aware of (foundation, flood, title, zoning, code violations)?
- Is there a deadline driving the sale (1031 exchange, divorce, estate, relocation)? That informs how much negotiation room exists.
- Schools are A-rated — typically a magnet for longer-tenancy family renters. What's the average tenant stay here, and is there a school-zone premium baked into asking?
- The area grade is low — what's the realistic commute time and amenity access for the typical tenant pool here? Any planned neighborhood developments (good or bad) we should know about?
- What's the average days-on-market for RENTAL listings here right now (not sales)? A rising rental-DOM trend means longer vacancies and softer asking-rent achievability than the comps imply.
- What's the recent tenant-quality profile in this submarket — average credit score on applications, eviction rate, late-payment / NSF rate, and stable-employment percentage? A property-management company in the area should have these aggregated.
- How much new for-sale + rental construction is in the pipeline within 1–3 miles? Heavy new supply typically softens prices + rents 12–24 months out; constrained supply supports both.
Investment metrics
- 1% rule
- 0.72% ✗
- Cap rate
- 5.19%
- Cash-on-cash
- -3.93%
- DSCR
- 0.83
- GRM
- 11.6
CMA / ARV
- ARV (on-the-fly)
- $375,772
- Comps found
- 12
Show comp detail 12 sales within ~0.75 mi
| Address | Dist | Beds/Ba | Sqft | Sold | Price | $/sf | Match |
|---|---|---|---|---|---|---|---|
| 8760 Madison Ave | 0.07mi | 3/2.0 | 2,508 (-1%) | 6mo | $368,000 | $147 | 90 |
| 8778 Madison Ave | 0.03mi | 4/3.0 (+1) | 2,600 (+2%) | 4mo | $385,000 | $148 | 82 |
| 8706 Madison Ave | 0.18mi | 4/3.5 (+1) | 2,448 (-4%) | 6mo | $389,706 | $159 | 69 |
| 218 Lawndale Dr | 0.58mi | 4/2.0 (+1) | 2,544 (+0%) | 1mo | $360,000 | $142 | 67 |
| 9031 Columbia Ave | 0.49mi | 4/2.5 (+1) | 2,565 (+1%) | 2mo | $540,000 | $211 | 67 |
| 1004 Fran-lin Pkwy | 0.61mi | 3/2.5 | 2,480 (-2%) | 1mo | $424,900 | $171 | 65 |
| 8749 Monroe Ave | 0.09mi | 4/3.0 (+1) | 2,192 (-14%) | 4mo | $388,000 | $177 | 61 |
| 8549 Forest Ave | 0.71mi | 3/2.5 | 2,626 (+3%) | 7mo | $375,000 | $143 | 54 |
| 8639 Linden Ave | 0.72mi | 3/1.5 | 2,378 (-6%) | 2mo | $355,000 | $149 | 52 |
| 8719 Linden Ave | 0.70mi | 4/2.5 (+1) | 2,712 (+7%) | 0mo | $383,000 | $141 | 48 |
| 901 Ridgeway Ave | 0.72mi | 4/2.0 (+1) | 2,732 (+8%) | 3mo | $372,000 | $136 | 46 |
| 8612 Hohman Ave | 0.60mi | 4/2.5 (+1) | 2,844 (+12%) | 2mo | $374,900 | $132 | 43 |
Match score weights: distance 35% · size 25% · config 20% · recency 20%. Top-matched comps best support the ARV.
Projected returns pro-forma
-3.0% appreciation · 3.0% rent growth · sell at horizon
- IRR
- -22.9%
- Equity multiple
- 0.21×
- Total profit
- $-92,597
- Equity at exit
- $62,623
- IRR
- -17.4%
- Equity multiple
- 0.04×
- Total profit
- $-112,317
- Equity at exit
- $36,314
Cash invested: $117,600 (down + closing). Projections, not guarantees.
Landlord ↔ Tenant lean methodology
- Overall (STATE)
- 90 Strongly Landlord-Friendly
- State Indiana
- 90 Strongly Landlord-Friendly · R+11
- County
- — inherits STATE
- City
- — inherits STATE
ZIP-level market 46321
- Active inventory
- 116
- Price-to-rent
- 11.6×
Monthly cashflow live
- Estimated rent
- $3,028 medium interval (Pro) →
- Mortgage (P&I)
- −$2,203
- Tax from tax record
- −$399 /mo · $4,791/yr
- Insurance
- −$175
- HOA
- −$0
- Vacancy / Maint / Mgmt
- −$636
- Net cashflow
- $-385
Break-even live
Sensitivity live
| Price | -10% $-147 | -5% $-266 | +0% $-385 | +5% $-504 | +10% $-623 |
|---|---|---|---|---|---|
| Rent | -10% $-624 | -5% $-504 | +0% $-385 | +5% $-265 | +10% $-146 |
| Rate | -1.0pp $-173 | -0.5pp $-278 | base $-385 | +0.5pp $-494 | +1.0pp $-604 |
UW: 25.0% down · 7.5% · 30yr · 1.5% tax · 5.0% vac · 8.0% maint · 8.0% mgmt
Financing live
Cash to close
- Down payment
- $105,000
- Closing costs
- $12,600
- Reserves months
- —
- Total cash needed
- —
Loan-product check · same deal, 3 products live
Conventional
25% down · 7.5% · 30yr
- Down + closing
- —
- Monthly P&I
- —
- Monthly cashflow
- —
- DSCR
- —
- Eligible?
- —
Personal DTI + credit; lowest rate.
DSCR
20% down · 8.5% · 30yr
- Down + closing
- —
- Monthly P&I
- —
- Monthly cashflow
- —
- DSCR
- —
- Eligible?
- —
No personal income docs; deal must DSCR.
Hard money
10% down · 12.0% · 12mo
- Down + closing
- —
- Monthly P&I
- —
- Monthly cashflow
- —
- DSCR
- —
- Eligible?
- —
Short-term bridge; refi at stabilization.
Rent comps 4 comps
| Address | Beds | Baths | Sqft | Rent | $/sqft | DOM | Units | Dist |
|---|---|---|---|---|---|---|---|---|
| 548 South St Munster, IN | 4.0 | 2.0 | 2300 | $3,300 | $1.43 | 6d | 1 | 0.52mi |
| 8016 Monaldi Dr Munster, IN | 4.0 | 2.0 | 2000 | $2,999 | $1.50 | 12d | 1 | 1.11mi |
| 18006 Wentworth Ave #3553 Lansing, IL | 2.0 | 1.0 | 1900 | $1,950 | $1.03 | 2d | 1 | 1.39mi |
| 7741 Hohman Ave Munster, IN | 4.0 | 2.0 | 2200 | $3,200 | $1.45 | 12d | 1 | 1.43mi |
Listing history 2 events
-
2026-04-13status Pending
-
2026-02-11$420,000 Active
ⓘ Source: listings_history table (triggers on properties + properties_extension) + one-shot
backfill from property_details.listing_events for pre-trigger history.
Tax reassessment forecast IN · Partial reset (capped growth)
- Current annual tax
- $4,791 · $399/mo
- Projected year-2 tax
- $4,791 · $399/mo
- Expected delta
- $0/yr ($0/mo · 0.0%)
ⓘ Screening estimate from a state-policy table — verify with the county assessor before closing.
Climate risk First Street
- Flood 6/10 Major FEMA zone X (unshaded) · 67% chance over 30 yrs
- Wildfire 1/10 Low
- Heat 3/10 Moderate 7 d/yr ≥102°F today · 15 d/yr by 30 yrs out
- Wind 2/10 Low 0% chance of damaging wind over 30 yrs
- Air quality 4/10 Moderate 5 unhealthy d/yr today · 6 by 30 yrs out
Nearby sold comps map
Loading sold comps map…
Walkable amenities ~0.75 mi
Loading nearby amenities…
Taxation est. · year 1
- Rental income
- $36,334
- − Mortgage interest
- −$23,527
- − Property taxes
- −$4,791
- − Insurance
- −$2,100
- − Repairs & maintenance
- −$2,907
- − Management
- −$2,907
- − Depreciation
- −$12,218
- Taxable loss
- −$12,115
- Est. tax savings @ 24.0%
- +$2,908
- After-tax cash flow
- $-1,710/yr
For passive investors: Depreciation is non-cash, so a rental often shows a tax loss while cash-flowing — sheltering income. Rental losses are passive: they offset passive income freely, and up to $25,000/yr can offset ordinary (W-2) income if you actively participate and your MAGI is under $100k (phasing out to $0 by $150k); unused losses carry forward. On sale, claimed depreciation is recaptured at up to 25%, and gains may owe capital-gains tax (a 1031 exchange can defer both). Figures are a year-1 estimate at your 24.0% rate — not tax advice; consult a CPA.
Schools (NCES district)
- District
- School Town Of Munster
- NCES district ID
- 1807350
- Math proficiency
- 65% ▼ -1.00%
- Reading proficiency
- 64% ▼ -4.00%
- Median HH income
- $71,901
- Composite
- 56.91/100
- National rank
- #1115
- State rank
- #6 of 301 in IN
Livability — Munster
- Score
- 81/100
- State rank
- #17
- US rank
- #1427
Category grades
Schools grade is shown separately in the Schools card above.
Census & demographics
- Census place
- Munster, IN
- County
- Lake County · 422,878 people
- City population
- 23,733
- Metro
- Chicago-Naperville-Elgin, IL-IN-WI
- Population (ZIP)
- 23,733
- Household income
- $110,187
- Rent vs Own
- Severe rent burden
- 338.0
Population outlook (Lake County) Hauer SSP2
- Today (2025)
- 484,026 people
- By 2030
- 478,091 · -1.2%
- By 2040
- 462,974 · -4.3%
- By 2050
- 449,894 · -7.1%
- By 2075
- 436,169 · -9.9%
- By 2100
- 426,607 · -11.9%
Race, ethnicity, and origin ACS 2023
- Neighborhood character
- Predominantly White (71%)
- Race & ethnicity
- White 71% Hispanic / Latino 14% Two or more races 8% Black 7% Asian 6%
- Hispanic origin (detail)
- Mexican 11% Puerto Rican 2%
- Common ancestry
- Romanian 16% Iranian 4% Lithuanian 1%
- Foreign-born
- 9% · Canada, South Korea, China
- Languages at home
- 86% English-only · Spanish 6% Russian/Polish/Slavic 3% Other Indo-European 2%
Political lean MEDSL · Lake
- 2024 margin
- Lean D (+5.6) · D 52.1% · R 46.5% · Other 1.5%
- 2008→2024 swing
- -28.6pp toward R · 2008: 34.3pp · 2024: 5.6pp
- All cycles
- 2024: D+5.6 2020: D+15.1 2016: D+20.6 2012: D+31.0 2008: D+34.3
Not yet ingested
- Civics
- —
Market trends
- HPI YoY
- ▼ -213.34%
- Current HPI
- 232.4818
- Rent YoY
- —
- Metro
- Chicago-Naperville-Elgin, IL-IN-WI
- State GDP YoY
- ▲ 2.90%
- F500 in state
- 18
Industry mix (Fortune 500 HQ in IN)
| Industry | F500 HQs | Revenue |
|---|---|---|
| Industrial Machinery | 2 | $37B |
|
||
| Healthcare | 1 | $177B |
|
||
| Pharmaceuticals | 1 | $45B |
|
||
| Metals / Steel | 1 | $18B |
|
||
| Agriculture | 1 | $17B |
|
||
| Packaging | 1 | $12B |
|
||
Price history
2 events — show timeline
- 2026-04-13 Pending — NIRA MLS as Distributed by MLS Grid
- 2026-02-11 Listed $420,000 NIRA MLS as Distributed by MLS Grid
Property tax history
+0.3%/yrLatest (2024): $4,791 · +8.8% YoY. Source: county tax records.
Cash-flow waterfall
monthlySold comps — $/sqft
last 12 mo · ≤1 miLoading sold comps…