16712 SE 99th Ave · The Villages, FL
Flood risk 9/10 · Severe
- FEMA flood zone
- X (unshaded)
- Chance of flooding over 30 yrs
- 0.99%
- Est. flood insurance / yr
- $507 – $1,088
Fire risk 2/10 · Minimal
- Est. fire insurance / yr
- $947 – $1,759
Heat risk 8/10 · Major
- Hot days now (above 109°F)
- 7 days/yr
- Hot days in 30 yrs
- 20 days/yr
Wind risk 9/10 · Severe
- Chance of severe wind over 30 yrs
- 99.0%
Air-quality risk 3/10 · Minor
- Unhealthy air days now
- 2 days/yr
- Unhealthy air days in 30 yrs
- 2 days/yr
Risk factors via First Street. Map © Google.
Why this score? — see what drove the C- grade
The composite is a weighted blend of 9 inputs, each scored 0–100. Each bar is that input's sub-score; the figure is the points it added to the 100-point composite (weight × sub-score).
- Cash flow +20.5/30.0
- ARV discount +8.1/15.0
- DSCR +6.5/10.0
- 1% rule +5.0/10.0
- Schools +3.6/10.0
- Livability +3.5/5.0
- Rent growth +2.5/5.0
- Condition / age +2.5/5.0
- Appreciation +0.0/10.0
$195,000
🖨 Deal sheet (PDF) 📄 Offer letter ✓ Due diligence
Listing remarks
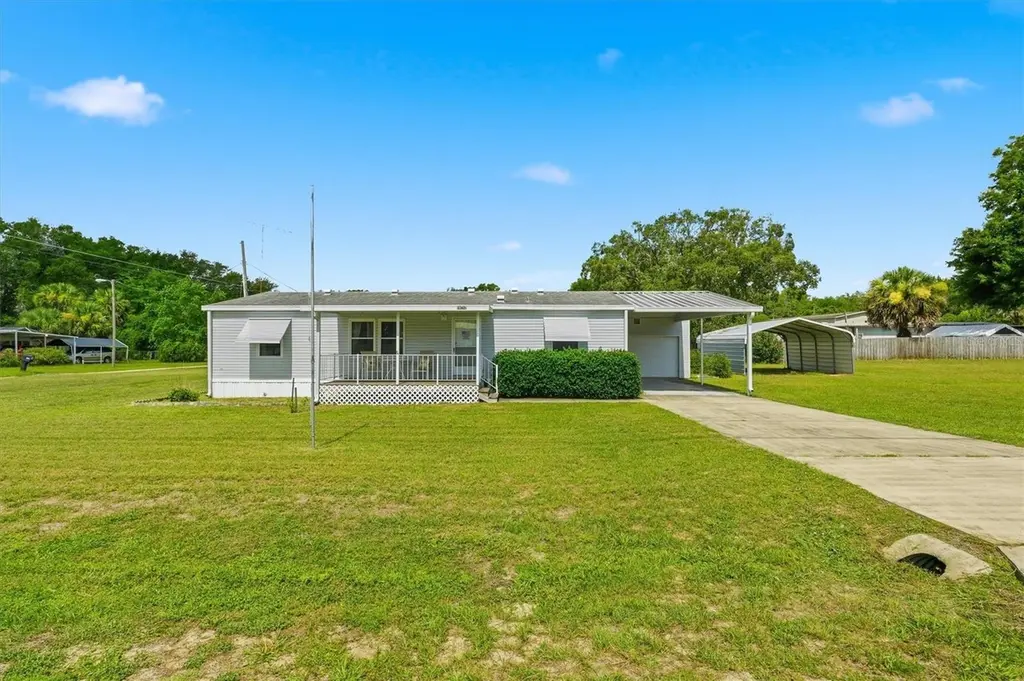
PRIVATE! NO HOA! Enjoy the freedom and privacy you've been looking for in this charming 3-bedroom, 2-bath 1,344 sq ft home featuring a detached 1-car garage, two carports, and plenty of outdoor living space. Relax on the covered front porch or entertain family and friends on the covered rear patio—perfect for quiet evenings and weekend BBQs. The detached garage offers excellent storage or workshop potential with electric already in place. Conveniently located near Mulberry Shopping Plaza, the Veterans Medical Facility, Back Porch Restaurant with live entertainment, and just minutes from The Villages, you'll enjoy easy access to shopping, dining, recreation, and nightly entertainment.
Key facts
- Covered front porch
- Covered rear patio
- Outdoor living space
Tags
Property features AI
Finance
- Other: Furnished; Homestead exempt; Lot approx. 0.32 acre (1/4 to less than 1/2 acre)
- Financial info: Lease restrictions apply
- HOA & community: No association
Exterior
- Parking: 1-car garage (22x10) with workshop area; 1-car carport; Driveway and off-street parking
- Utilities: Well water; Septic tank; Cable available; Electricity connected; Sewer connected; Water connected; Private utilities
- Home design: Manufactured double-wide home; Residential property; Single-story; North-facing; Entry on main level
- Construction: Vinyl siding with frame construction; Shingle roof; Crawlspace foundation with pillar/post/pier
- Exterior features: Covered patio/deck/porch with rear porch; Awning(s); Private mailbox; Storage; Cleared, level and oversized lot on a dead-end street; Asphalt road access
Interior
- Kitchen: Dishwasher; Range; Microwave
- Bedrooms: 3 bedrooms
- Flooring: Carpet; Vinyl
- Bathrooms: 2 full bathrooms
- Heating & cooling: Electric heat pump; Central air
- Interior features: Ceiling fans; Living room / dining room combo; Thermostat; Vaulted ceilings; Walk-in closets; Inside utility room
- Laundry & utility: Inside laundry room; Washer; Dryer
Neighborhood map
What this means for you Summary
Snapshot
- This is a 3-bed/2.0-bath manufactured listed at $195k.
Deal economics
- At list price, monthly cash flow is $192 ($2k/yr) — positive.
- The deal already cash-flows at list — no discount required.
- Meets the 1% rule at list price ($2k rent vs $195k).
- Cap rate 7.9% vs local median 5.0% in The Villages — top-decile yield for the area; either an underpriced asset or a hidden risk that comps aren't pricing in. Stress-test before assuming the spread holds.
Location & tenants
- Location reads 70/100 on livability (#431 in FL) — a middle-class / working-renter tenant base. Strengths: crime A+, housing A, employment B+; Watch: amenities F, commute F, health & safety F.
- Marion (rural): math 42% / reading 43% proficiency, ranked #61 of 73 in FL (top 84%) — families likely to look elsewhere, expect single-tenant / working-renter base with shorter leases; 61% free/reduced lunch — lower-income household profile, screen leases tightly.
- Zoned schools: Stanton-Weirsdale Elementary School (math 42% / reading 36%, grade F, #1,560 of 2,144 statewide, top 73%, 544 students, 70% FRL); Lake Weir Middle School (math 37% / reading 33%, grade F, #416 of 571 statewide, top 74%, 1,207 students, 76% FRL); Belleview High School (math 31% / reading 46%, grade F, #321 of 667 statewide, top 49%, 1,783 students, 56% FRL).
- Market conditions: 712 active listings in the ZIP; 14 comparable units currently listed for rent nearby; rentals at typical pace (median 23d on market — plan ~3-4 weeks tenant-placement turnaround); 7,071 units permitted in Marion County in 2024 (534 in 5+ unit buildings).
- This rent runs 35% of the median local income ($67k/yr) — at the standard rent-burdened threshold; future hikes will face affordability resistance.
Forward outlook
- Local home prices are declining (-3.0%/yr); year-one equity from $1k of loan paydown is wiped out by about $6k of value loss. Plan a longer hold.
- Marion County population projected at +13% by 2050 — modest demand growth; plan on rents tracking national, not racing it.
Negotiation context
- Only 9 days on market — expect competitive offers; lowballing is unlikely to land.
- Current owner paid $65k; list at $195k implies a 200% gain — meaningful room to come down on a strong offer.
Risks & watch-outs
- Watch-outs: flood insurance adds $66/mo.
- Climate carrying-cost: severe flood risk; severe wind risk, 99% chance of damaging wind over 30y; extreme-heat days projected 7→20/yr by 2055 (HVAC capex compounding) — expect insurance premiums to compound above CPI over the hold.
Questions for the listing agent
- What's the actual annual flood-insurance premium (NFIP or private), and is the property in a SFHA with mandatory coverage?
- Is there a deadline driving the sale (1031 exchange, divorce, estate, relocation)? That informs how much negotiation room exists.
- Schools are A-rated — typically a magnet for longer-tenancy family renters. What's the average tenant stay here, and is there a school-zone premium baked into asking?
- What's the average days-on-market for RENTAL listings here right now (not sales)? A rising rental-DOM trend means longer vacancies and softer asking-rent achievability than the comps imply.
- What's the recent tenant-quality profile in this submarket — average credit score on applications, eviction rate, late-payment / NSF rate, and stable-employment percentage? A property-management company in the area should have these aggregated.
- How much new for-sale + rental construction is in the pipeline within 1–3 miles? Heavy new supply typically softens prices + rents 12–24 months out; constrained supply supports both.
Investment metrics
- 1% rule
- 1.00% ✓
- Cap rate
- 7.88%
- Cash-on-cash
- 5.69%
- DSCR
- 1.25
- GRM
- 8.3
CMA / ARV
- ARV (on-the-fly)
- $197,568
- Comps found
- 4
Show comp detail 4 sales within ~0.75 mi
| Address | Dist | Beds/Ba | Sqft | Sold | Price | $/sf | Match |
|---|---|---|---|---|---|---|---|
| 16582 SE 96th Ct | 0.22mi | 2/2.0 (-1) | 1,329 (-1%) | 10mo | $195,000 | $147 | 74 |
| 16653 SE 96th Ct | 0.21mi | 2/2.0 (-1) | 1,226 (-9%) | 12mo | $215,000 | $175 | 60 |
| 16780 SE 101st Court Rd | 0.25mi | 2/2.0 (-1) | 1,456 (+8%) | 12mo | $135,000 | $93 | 60 |
| 16025 SE 99th Ter | 0.70mi | 3/2.0 | 1,404 (+4%) | 13mo | $163,000 | $116 | 49 |
Match score weights: distance 35% · size 25% · config 20% · recency 20%. Top-matched comps best support the ARV.
Projected returns pro-forma
-3.0% appreciation · 3.0% rent growth · sell at horizon
- IRR
- -9.7%
- Equity multiple
- 0.65×
- Total profit
- $-19,322
- Equity at exit
- $29,075
- IRR
- -0.2%
- Equity multiple
- 0.98×
- Total profit
- $-931
- Equity at exit
- $16,860
Cash invested: $54,600 (down + closing). Projections, not guarantees.
Landlord ↔ Tenant lean methodology
- Overall (STATE)
- 87 Strongly Landlord-Friendly
- State Florida
- 87 Strongly Landlord-Friendly · R+3
- County
- — inherits STATE
- City
- — inherits STATE
ZIP-level market 34491
- Home prices YoY
- -35.0%
- Active inventory
- 712
- Price-to-rent
- 8.3×
Monthly cashflow live
- Estimated rent
- $1,953 high interval (Pro) →
- Mortgage (P&I)
- −$1,023
- Tax from tax record
- −$180 /mo · $2,166/yr
- Insurance
- −$81
- Flood insurance flood zone
- −$66 /mo · $798/yr
- HOA
- −$0
- Vacancy / Maint / Mgmt
- −$410
- Net cashflow
- $192
Break-even live
Sensitivity live
| Price | -10% $303 | -5% $247 | +0% $192 | +5% $137 | +10% $82 |
|---|---|---|---|---|---|
| Rent | -10% $38 | -5% $115 | +0% $192 | +5% $269 | +10% $347 |
| Rate | -1.0pp $290 | -0.5pp $242 | base $192 | +0.5pp $142 | +1.0pp $90 |
UW: 25.0% down · 7.5% · 30yr · 1.5% tax · 5.0% vac · 8.0% maint · 8.0% mgmt
Financing live
Cash to close
- Down payment
- $48,750
- Closing costs
- $5,850
- Reserves months
- —
- Total cash needed
- —
Loan-product check · same deal, 3 products live
Conventional
25% down · 7.5% · 30yr
- Down + closing
- —
- Monthly P&I
- —
- Monthly cashflow
- —
- DSCR
- —
- Eligible?
- —
Personal DTI + credit; lowest rate.
DSCR
20% down · 8.5% · 30yr
- Down + closing
- —
- Monthly P&I
- —
- Monthly cashflow
- —
- DSCR
- —
- Eligible?
- —
No personal income docs; deal must DSCR.
Hard money
10% down · 12.0% · 12mo
- Down + closing
- —
- Monthly P&I
- —
- Monthly cashflow
- —
- DSCR
- —
- Eligible?
- —
Short-term bridge; refi at stabilization.
Rent comps 14 comps
| Address | Beds | Baths | Sqft | Rent | $/sqft | DOM | Units | Dist |
|---|---|---|---|---|---|---|---|---|
| 9990 SE 166th St Summerfield, FL | 3.0 | 2.0 | 962 | $1,395 | $1.45 | 15d | 1 | 0.17mi |
| 9523 SE 168th Maplesong Ln The Villages, FL | 3.0 | 2.0 | 1265 | $1,975 | $1.56 | 22d | 1 | 0.37mi |
| 17199 SE 97th Ter Summerfield, FL | 3.0 | 2.0 | 1404 | $1,990 | $1.42 | 22d | 1 | 0.50mi |
| 16962 SE 94th Sunnybrook Cir The Villages, FL | 2.0 | 2.0 | 1160 | $2,000 | $1.72 | 22d | 1 | 0.51mi |
| 10326 SE 162nd Place Rd Summerfield, FL | 3.0 | 2.0 | 1419 | $2,300 | $1.62 | 15d | 1 | 0.67mi |
| 9871 SE 161st Lane Rd Unit 0 Summerfield, FL | 4.0 | 2.0 | 1827 | $2,200 | $1.20 | 22d | 1 | 0.75mi |
| 9195 SE 163rd St Summerfield, FL | 3.0 | 2.0 | 1410 | $1,800 | $1.28 | 22d | 1 | 0.77mi |
| 17532 SE 100th Ct Summerfield, FL | 2.0 | 2.0 | 1217 | $1,800 | $1.48 | 22d | 1 | 0.88mi |
| 17582 SE 96th Ct Summerfield, FL | 2.0 | 2.0 | 1652 | $1,750 | $1.06 | 22d | 1 | 1.01mi |
| 10397 SE 176th St Summerfield, FL | 2.0 | 2.0 | 1296 | $2,150 | $1.66 | 22d | 1 | 1.10mi |
| 17713 SE 95th Cir Summerfield, FL | 3.0 | 2.0 | 1450 | $2,000 | $1.38 | 22d | 1 | 1.15mi |
| 11001 SE Sunset Harbor Rd Unit H52 Summerfield, FL | 2.0 | 2.5 | 1224 | $1,440 | $1.18 | 22d | 1 | 1.26mi |
| 11001 SE Sunset Harbor Rd Summerfield, FL | 2.0 | 1.5–2.0 | 1244 | $1,770 | $1.42 | 22d | 2 | 1.30mi |
| 11001 SE Sunset Harbor Rd Unit A08 Summerfield, FL | 2.0 | 1.5 | 1200 | $2,000 | $1.67 | 22d | 1 | 1.30mi |
Listing history 7 events
-
2026-06-21days on market $195,000 Active 9 DOM
-
2026-06-18days on market $195,000 Active 6 DOM
-
2026-06-17days on market $195,000 Active 5 DOM
-
2026-06-16days on market $195,000 Active 4 DOM
-
2026-06-15days on market $195,000 Active 3 DOM
-
2026-06-13remarks 693-char remark
-
2026-06-13$195,000 Active 1 DOM
ⓘ Source: listings_history table (triggers on properties + properties_extension) + one-shot
backfill from property_details.listing_events for pre-trigger history.
Tax reassessment forecast FL · Resets to sale price
- Current annual tax
- $2,166 · $180/mo
- Projected year-2 tax
- $2,166 · $180/mo
- Expected delta
- $0/yr ($0/mo · 0.0%)
ⓘ Screening estimate from a state-policy table — verify with the county assessor before closing.
Climate risk First Street
- Flood 9/10 Extreme FEMA zone X (unshaded) · 99% chance over 30 yrs
- Wildfire 2/10 Low
- Heat 8/10 Severe 7 d/yr ≥109°F today · 20 d/yr by 30 yrs out
- Wind 9/10 Extreme 99% chance of damaging wind over 30 yrs
- Air quality 3/10 Moderate 2 unhealthy d/yr today · 2 by 30 yrs out
Nearby sold comps map
Loading sold comps map…
Walkable amenities ~0.75 mi
Loading nearby amenities…
Taxation est. · year 1
- Rental income
- $23,438
- − Mortgage interest
- −$10,923
- − Property taxes
- −$2,166
- − Insurance
- −$1,772
- − Repairs & maintenance
- −$1,875
- − Management
- −$1,875
- − Depreciation
- −$5,673
- Taxable loss
- −$846
- Est. tax savings @ 24.0%
- +$203
- After-tax cash flow
- $2,510/yr
For passive investors: Depreciation is non-cash, so a rental often shows a tax loss while cash-flowing — sheltering income. Rental losses are passive: they offset passive income freely, and up to $25,000/yr can offset ordinary (W-2) income if you actively participate and your MAGI is under $100k (phasing out to $0 by $150k); unused losses carry forward. On sale, claimed depreciation is recaptured at up to 25%, and gains may owe capital-gains tax (a 1031 exchange can defer both). Figures are a year-1 estimate at your 24.0% rate — not tax advice; consult a CPA.
Schools (NCES district)
- District
- Marion
- NCES district ID
- 1201260
- Math proficiency
- 42% ▼ -7.00%
- Reading proficiency
- 43% ▼ -4.00%
- Median HH income
- $40,015
- Composite
- 35.61/100
- National rank
- #4890
- State rank
- #61 of 73 in FL
Livability — The Villages
- Score
- 70/100
- State rank
- #431
- US rank
- #7363
Category grades
Schools grade is shown separately in the Schools card above.
Census & demographics
- County
- Marion County · 315,796 people
- City population
- 83,973
- Metro
- Ocala, FL
- Population (ZIP)
- 33,318
- Household income
- $66,679
- Rent vs Own
- Severe rent burden
- 256.0
Population outlook (Marion County) Hauer SSP2
- Today (2025)
- 365,905 people
- By 2030
- 376,768 · +3.0%
- By 2040
- 396,555 · +8.4%
- By 2050
- 412,723 · +12.8%
- By 2075
- 446,090 · +21.9%
- By 2100
- 436,193 · +19.2%
Race, ethnicity, and origin ACS 2023
- Neighborhood character
- Predominantly White (77%)
- Race & ethnicity
- White 77% Hispanic / Latino 14% Two or more races 9% Black 4% Asian 2%
- Hispanic origin (detail)
- Mexican 3% Puerto Rican 6% Cuban 1%
- Common ancestry
- Lithuanian 3% Slovak 2% Romanian 2%
- Foreign-born
- 8% · Canada, Vietnam, Jamaica
- Languages at home
- 85% English-only · Spanish 11% Vietnamese 1% French/Haitian/Cajun 1%
Political lean MEDSL · Marion
- 2024 margin
- Solid R (+31.6) · D 33.8% · R 65.5%
- 2008→2024 swing
- -20.0pp toward R · 2008: -11.6pp · 2024: -31.6pp
- All cycles
- 2024: R+31.6 2020: R+25.9 2016: R+26.2 2012: R+16.2 2008: R+11.6
Not yet ingested
- Civics
- —
Market trends
- HPI YoY
- ▼ -107.67%
- Current HPI
- 200.0792
- Rent YoY
- —
- Metro
- Ocala, FL
- State GDP YoY
- ▲ 3.28%
- F500 in state
- 36
Industry mix (Fortune 500 HQ in FL)
| Industry | F500 HQs | Revenue |
|---|---|---|
| Industrial Technology | 2 | $29B |
|
||
| Insurance | 2 | $17B |
|
||
| Retail | 1 | $60B |
|
||
| Technology Distribution | 1 | $58B |
|
||
| Homebuilding | 1 | $35B |
|
||
| Technology Manufacturing | 1 | $35B |
|
||
Price history
+2066.7% since first listed4 events — show timeline
- 2026-06-12 Listed $195,000 Stellar MLS as Distributed by MLS Grid
- 2002-03-07 Sold (Public Records) $65,000 Public Records
- 1999-08-31 Sold (Public Records) $50,000 Public Records
- 1995-09-01 Sold (Public Records) $9,000 Public Records
Property tax history
+7.3%/yrLatest (2025): $2,166 · +11.3% YoY. Source: county tax records.
Cash-flow waterfall
monthlySold comps — $/sqft
last 12 mo · ≤1 miLoading sold comps…