 🏗️ New Construction
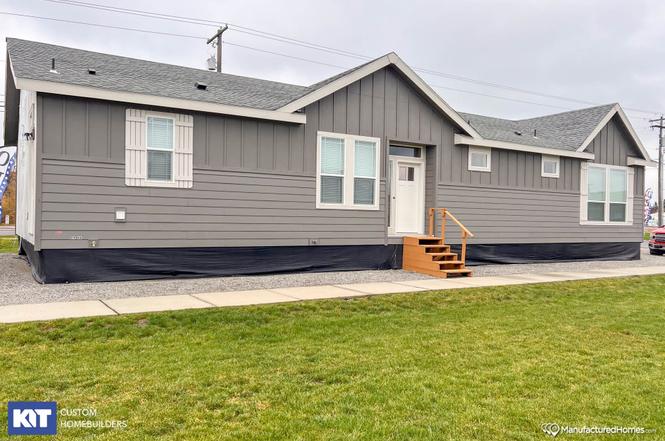
Grand Manor 6009 - BOYL Plan · Missoula, MT
Flood risk No data
- FEMA flood zone
- —
- Chance of flooding over 30 yrs
- —
- Est. flood insurance / yr
- —
Fire risk No data
- Est. fire insurance / yr
- —
Heat risk 3/10 · Minor
- Hot days now (above threshold)
- 7 days/yr
- Hot days in 30 yrs
- 16 days/yr
Wind risk No data
- Chance of severe wind over 30 yrs
- —
Air-quality risk 10/10 · Severe
- Unhealthy air days now
- 26 days/yr
- Unhealthy air days in 30 yrs
- 30 days/yr
Risk factors via First Street. Map © Google.
Why this score? — see what drove the D grade
The composite is a weighted blend of 9 inputs, each scored 0–100. Each bar is that input's sub-score; the figure is the points it added to the 100-point composite (weight × sub-score).
- Cash flow +14.1/30.0
- ARV discount +7.5/15.0
- DSCR +4.3/10.0
- Livability +4.0/5.0
- Condition / age +4.0/5.0
- 1% rule +3.9/10.0
- Schools +3.5/10.0
- Rent growth +3.1/5.0
- Appreciation +0.0/10.0
$261,900
🖨 Deal sheet (PDF) 📄 Offer letter ✓ Due diligence
Key facts
- Beverage center
- Ample windows
- Open-beam ceiling
Tags
Property features AI
Finance
- Other: Address: Grand Manor 6009 - BOYL Plan, Missoula, MT 59808; Status: Active
- Financial info: List price $261,900
Exterior
- Utilities: Electric heating (forced air)
- Home design: New construction plan (Grand Manor 6009 - BOYL)
- Construction: Living area approximately 1998 (plan)
- Exterior features: Asphalt roof
Interior
- Bedrooms: 3 bedrooms
- Bathrooms: 2 bathrooms (full)
- Heating & cooling: Electric forced air heating
- Interior features: Plan: Grand Manor 6009 - BOYL
Neighborhood map
What this means for you Summary
Snapshot
- This is a 3-bed/2.0-bath manufactured listed at $262k. Condition is rated good.
Deal economics
- At list price, monthly cash flow is $40 ($476/yr) — positive.
- The deal already cash-flows at list — no discount required.
- To meet the 1% rule (rent ≥ 1% of price), the offer needs to be $234k (10.6% below list).
- Recommended offer: $230k (12.0% below list) — sets the bar for market timing.
- Cap rate 6.5% vs local median 1.7% in Missoula — top-decile yield for the area; either an underpriced asset or a hidden risk that comps aren't pricing in. Stress-test before assuming the spread holds.
Location & tenants
- Location reads 79/100 on livability (#17 in MT, #2,351 nationally) — a middle-class / working-renter tenant base. Strengths: amenities A+, commute A+, health & safety A+; Watch: employment C-, crime F.
- Missoula H S (urban): math 31% / reading 52% proficiency, ranked #53 of 116 in MT (top 46%) — families likely to look elsewhere, expect single-tenant / working-renter base with shorter leases.
- Zoned schools: Hellgate Elem Lower Grades (math 47% / reading 57%, grade C-, #69 of 293 statewide, top 27%, 338 students, 0% FRL); Hellgate Middle School (math 46% / reading 64%, grade B-, #14 of 146 statewide, top 9%, 329 students, 0% FRL); Big Sky High School (math 21% / reading 37%, grade F, #74 of 132 statewide, top 56%, 1,186 students, 0% FRL).
- Market conditions: Rents rising (+2.4%/yr); 246 active listings in the ZIP; 1 comparable units currently listed for rent nearby; solid renter incomes; 773 units permitted in Missoula County in 2024 (354 in 5+ unit buildings).
- This rent runs 35% of the median local income ($80k/yr) — at the standard rent-burdened threshold; future hikes will face affordability resistance.
Forward outlook
- Local home prices are declining (-3.0%/yr); year-one equity from $2k of loan paydown is wiped out by about $8k of value loss. Plan a longer hold.
- Missoula County population projected at +23% by 2050 — long-run rental-demand tailwind backs the buy-and-hold thesis.
Negotiation context
- It's been on market 123 days — a 12% lower offer ($230k) is reasonable based on typical stale-listing flexibility.
Questions for the listing agent
- It's been on market 123 days. Have you received any prior offers? Is the seller open to a 12% concession, seller financing, or rate buy-down credit?
- Why hasn't it sold? Are there any deal-killer items the seller is aware of (foundation, flood, title, zoning, code violations)?
- Is there a deadline driving the sale (1031 exchange, divorce, estate, relocation)? That informs how much negotiation room exists.
- Schools are B-rated — typically a magnet for longer-tenancy family renters. What's the average tenant stay here, and is there a school-zone premium baked into asking?
- Crime grade is F in this area — have there been break-ins, vandalism, or insurance claims at this property in the last 3 years? What carrier currently insures it and at what premium?
- The area grade is low — what's the realistic commute time and amenity access for the typical tenant pool here? Any planned neighborhood developments (good or bad) we should know about?
- What's the average days-on-market for RENTAL listings here right now (not sales)? A rising rental-DOM trend means longer vacancies and softer asking-rent achievability than the comps imply.
- What's the recent tenant-quality profile in this submarket — average credit score on applications, eviction rate, late-payment / NSF rate, and stable-employment percentage? A property-management company in the area should have these aggregated.
- How much new for-sale + rental construction is in the pipeline within 1–3 miles? Heavy new supply typically softens prices + rents 12–24 months out; constrained supply supports both.
Investment metrics
- 1% rule
- 0.89% ✗
- Cap rate
- 6.47%
- Cash-on-cash
- 0.65%
- DSCR
- 1.03
- GRM
- 9.3
CMA / ARV
No comps found within radius.
Projected returns pro-forma
-3.0% appreciation · 2.35% rent growth · sell at horizon
- IRR
- -16.0%
- Equity multiple
- 0.44×
- Total profit
- $-41,397
- Equity at exit
- $39,050
- IRR
- -8.8%
- Equity multiple
- 0.47×
- Total profit
- $-38,812
- Equity at exit
- $22,644
Cash invested: $73,332 (down + closing). Projections, not guarantees.
Landlord ↔ Tenant lean methodology
- Overall (STATE)
- 82 Strongly Landlord-Friendly
- State Montana
- 82 Strongly Landlord-Friendly · R+11
- County
- — inherits STATE
- City
- — inherits STATE
ZIP-level market 59808
- Rents YoY
- 2.4%
- Active inventory
- 246
- Price-to-rent
- 9.3×
Monthly cashflow live
- Estimated rent
- $2,341 medium interval (Pro) →
- Mortgage (P&I)
- −$1,373
- Tax est. 1.5%
- −$327 /mo · $3,928/yr
- Insurance
- −$109
- HOA
- −$0
- Vacancy / Maint / Mgmt
- −$492
- Net cashflow
- $40
Break-even live
Sensitivity live
| Price | -10% $221 | -5% $130 | +0% $40 | +5% $-51 | +10% $-141 |
|---|---|---|---|---|---|
| Rent | -10% $-145 | -5% $-53 | +0% $40 | +5% $132 | +10% $225 |
| Rate | -1.0pp $172 | -0.5pp $106 | base $40 | +0.5pp $-28 | +1.0pp $-97 |
UW: 25.0% down · 7.5% · 30yr · 1.5% tax · 5.0% vac · 8.0% maint · 8.0% mgmt
Financing live
Cash to close
- Down payment
- $65,475
- Closing costs
- $7,857
- Reserves months
- —
- Total cash needed
- —
Loan-product check · same deal, 3 products live
Conventional
25% down · 7.5% · 30yr
- Down + closing
- —
- Monthly P&I
- —
- Monthly cashflow
- —
- DSCR
- —
- Eligible?
- —
Personal DTI + credit; lowest rate.
DSCR
20% down · 8.5% · 30yr
- Down + closing
- —
- Monthly P&I
- —
- Monthly cashflow
- —
- DSCR
- —
- Eligible?
- —
No personal income docs; deal must DSCR.
Hard money
10% down · 12.0% · 12mo
- Down + closing
- —
- Monthly P&I
- —
- Monthly cashflow
- —
- DSCR
- —
- Eligible?
- —
Short-term bridge; refi at stabilization.
Rent comps 1 comps
| Address | Beds | Baths | Sqft | Rent | $/sqft | DOM | Units | Dist |
|---|---|---|---|---|---|---|---|---|
| 3735 W Broadway St Missoula, MT | 1.0–3.0 | 1.0–2.0 | 1050 | $2,600 | $2.48 | 45d | 6 | 1.03mi |
Listing history 18 events
-
2026-06-22days on market $261,900 Active 123 DOM
-
2026-06-19days on market $261,900 Active 121 DOM
-
2026-06-18days on market $261,900 Active 120 DOM
-
2026-06-17days on market $261,900 Active 119 DOM
-
2026-06-16days on market $261,900 Active 118 DOM
-
2026-06-15days on market $261,900 Active 117 DOM
-
2026-06-14days on market $261,900 Active 115 DOM
-
2026-06-13days on market $261,900 Active 114 DOM
-
2026-06-10days on market $261,900 Active 112 DOM
-
2026-06-09days on market $261,900 Active 111 DOM
-
2026-06-08days on market $261,900 Active 110 DOM
-
2026-06-07days on market $261,900 Active 109 DOM
-
2026-06-05days on market $261,900 Active 106 DOM
-
2026-06-03days on market $261,900 Active 105 DOM
-
2026-06-02days on market $261,900 Active 104 DOM
-
2026-06-01days on market $261,900 Active 103 DOM
-
2026-05-31days on market $261,900 Active 102 DOM
-
2026-05-30days on market $261,900 Active 101 DOM
ⓘ Source: listings_history table (triggers on properties + properties_extension) + one-shot
backfill from property_details.listing_events for pre-trigger history.
Climate risk First Street
- Heat 3/10 Moderate
- Air quality 10/10 Extreme 26 unhealthy d/yr today · 30 by 30 yrs out
Nearby sold comps map
Loading sold comps map…
Walkable amenities ~0.75 mi
Loading nearby amenities…
Taxation est. · year 1
- Rental income
- $28,095
- − Mortgage interest
- −$14,670
- − Property taxes
- −$3,928
- − Insurance
- −$1,310
- − Repairs & maintenance
- −$2,248
- − Management
- −$2,248
- − Depreciation
- −$7,619
- Taxable loss
- −$3,927
- Est. tax savings @ 24.0%
- +$943
- After-tax cash flow
- $1,419/yr
For passive investors: Depreciation is non-cash, so a rental often shows a tax loss while cash-flowing — sheltering income. Rental losses are passive: they offset passive income freely, and up to $25,000/yr can offset ordinary (W-2) income if you actively participate and your MAGI is under $100k (phasing out to $0 by $150k); unused losses carry forward. On sale, claimed depreciation is recaptured at up to 25%, and gains may owe capital-gains tax (a 1031 exchange can defer both). Figures are a year-1 estimate at your 24.0% rate — not tax advice; consult a CPA.
Condition & rehab AI · 14 photos
This home is in good condition with a well-maintained exterior and interior. It has a good roof and flooring, and the bathrooms and kitchen are clean and well-maintained. The HVAC and other systems appear to be in good condition. The home has a good curb appeal and is ready for a new owner.
Value-add opportunities
- Both Paint the exterior — A fresh coat of paint can enhance the curb appeal and increase the home's value.
- Both Clean the gutters — Clean gutters improve the home's appearance and prevent water damage.
- Both Inspect and replace HVAC filters — A clean and functioning HVAC system improves the home's comfort and energy efficiency, which can increase its value.
Renovation cost estimate screening
Value-add ROI direction
- Both Paint the exterior — A fresh coat of paint can enhance the curb appeal and increase the home's value. ↑
- Both Clean the gutters — Clean gutters improve the home's appearance and prevent water damage. ↑
- Both Inspect and replace HVAC filters — A clean and functioning HVAC system improves the home's comfort and energy efficiency, which can increase its value. ↑
ⓘ Cost ranges are severity-bucket heuristics (US national rule-of-thumb). Get contractor quotes + a written scope before underwriting a rehab budget.
Schools (NCES district)
- District
- Missoula H S
- NCES district ID
- 3018540
- Math proficiency
- 31% ▼ -8.00%
- Reading proficiency
- 52% ▼ -1.00%
- Median HH income
- $41,814
- Composite
- 34.87/100
- National rank
- #5087
- State rank
- #53 of 116 in MT
Livability — Missoula
- Score
- 79/100
- State rank
- #17
- US rank
- #2351
Category grades
Schools grade is shown separately in the Schools card above.
Census & demographics
- County
- Missoula County · 100,878 people
- City population
- 100,878
- Metro
- Missoula, MT
- Population (ZIP)
- 23,574
- Household income
- $80,239
- Rent vs Own
- Severe rent burden
- 1022.0
Population outlook (Missoula County) Hauer SSP2
- Today (2025)
- 127,248 people
- By 2030
- 133,571 · +5.0%
- By 2040
- 144,833 · +13.8%
- By 2050
- 156,753 · +23.2%
- By 2075
- 189,373 · +48.8%
- By 2100
- 217,637 · +71.0%
Race, ethnicity, and origin ACS 2023
- Neighborhood character
- Predominantly White (87%)
- Race & ethnicity
- White 87% Two or more races 5% Hispanic / Latino 3% Asian 3% Native American 2%
- Common ancestry
- Portuguese 6% Lithuanian 3% Italian 3%
- Foreign-born
- 3% · Canada
- Languages at home
- 94% English-only · Other Asian/Pacific 2% Spanish 2% Russian/Polish/Slavic 1%
Political lean MEDSL · Missoula
- 2024 margin
- Strong D (+21.4) · D 59.0% · R 37.5% · Other 3.5%
- 2008→2024 swing
- -5.3pp toward R · 2008: 26.7pp · 2024: 21.4pp
- All cycles
- 2024: D+21.4 2020: D+23.6 2016: D+15.8 2012: D+18.7 2008: D+26.7
Not yet ingested
- Civics
- —
Market trends
- HPI YoY
- ▼ -165.87%
- Current HPI
- 269.9288
- Rent YoY
- ▲ 2.35%
- Metro
- Missoula, MT
- State GDP YoY
- ▲ 3.41%
- F500 in state
- 2
Industry mix (Fortune 500 HQ in MT)
| Industry | F500 HQs | Revenue |
|---|---|---|
| Technology / Analytics | 1 | $2B |
|
||
Cash-flow waterfall
monthlySold comps — $/sqft
last 12 mo · ≤1 miLoading sold comps…