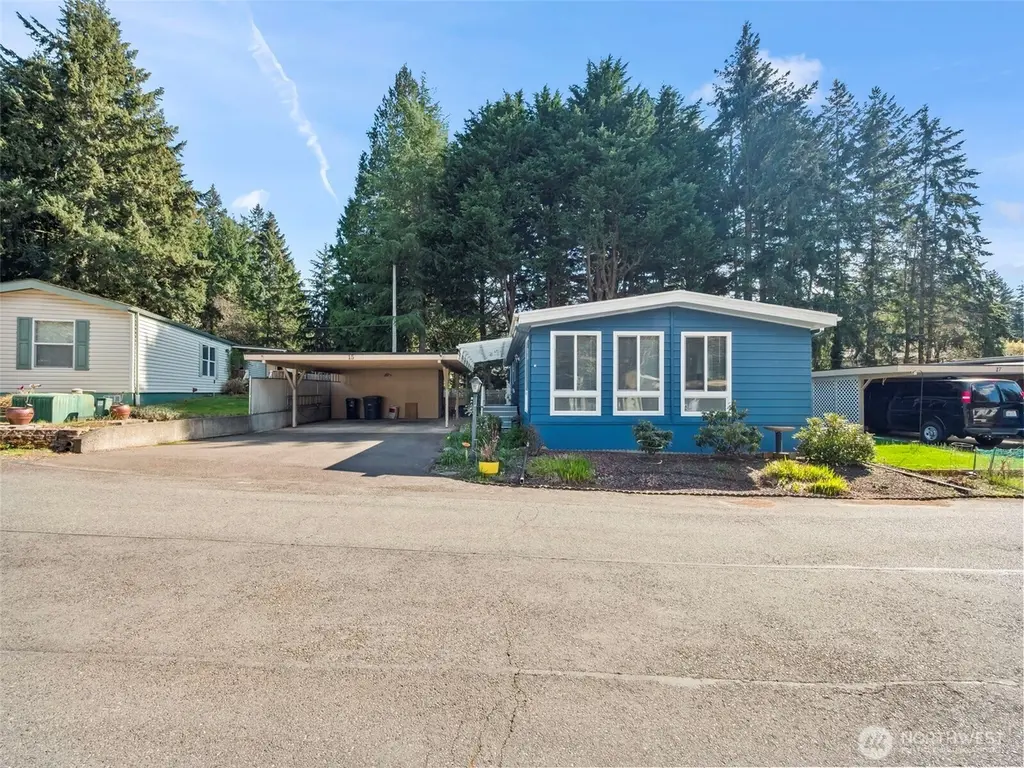
10414 Peacock Hill Ave #15 · Gig Harbor, WA
Flood risk 1/10 · Minimal
- FEMA flood zone
- X (unshaded)
- Chance of flooding over 30 yrs
- 0.0%
- Est. flood insurance / yr
- $507 – $1,088
Fire risk 1/10 · Minimal
- Est. fire insurance / yr
- $604 – $1,122
Heat risk 3/10 · Minor
- Hot days now (above 87°F)
- 7 days/yr
- Hot days in 30 yrs
- 14 days/yr
Wind risk 1/10 · Minimal
- Chance of severe wind over 30 yrs
- —
Air-quality risk 6/10 · Moderate
- Unhealthy air days now
- 8 days/yr
- Unhealthy air days in 30 yrs
- 8 days/yr
Risk factors via First Street. Map © Google.
Why this score? — see what drove the B+ grade
The composite is a weighted blend of 9 inputs, each scored 0–100. Each bar is that input's sub-score; the figure is the points it added to the 100-point composite (weight × sub-score).
- Cash flow +30.0/30.0
- ARV discount +15.0/15.0
- 1% rule +10.0/10.0
- DSCR +10.0/10.0
- Schools +6.0/10.0
- Livability +3.7/5.0
- Rent growth +2.5/5.0
- Condition / age +2.5/5.0
- Appreciation +0.0/10.0
$174,000
🖨 Deal sheet 📄 Offer letter ✓ Due diligence
Listing remarks
Just minutes from downtown Gig Harbor, this home is located in Hillcrest Manufactured Home Park, a welcoming 55+ community. This two-bedroom residence offers a comfortable and functional layout, beginning with an inviting living room that flows seamlessly into the dining area and an open, light-filled kitchen featuring new appliances. The spacious primary bedroom includes a beautifully remodeled ensuite bathroom and a large walk-in closet. A second bedroom, paired with a full bath, provides a comfortable retreat for guests, and both bedrooms feature brand-new flooring. Outside, enjoy one of the park's most desirable yards-private and spacious, complete with two additional storage sheds
Key facts
- Heat pump
- New appliances
- Large walk-in closet
Tags
Neighborhood map
What this means for you Summary
Snapshot
- This is a 2-bed/2.0-bath manufactured listed at $174k.
Deal economics
- At list price, monthly cash flow is $1k ($13k/yr) — positive.
- The deal already cash-flows at list — no discount required.
- Meets the 1% rule at list price ($3k rent vs $174k).
- Recommended offer: $169k (3.0% below list) — sets the bar for market timing.
- Cap rate 14.0% vs local median 1.9% in Gig Harbor — top-decile yield for the area; either an underpriced asset or a hidden risk that comps aren't pricing in. Stress-test before assuming the spread holds.
Location & tenants
- Location reads 74/100 on livability (#177 in WA, #4,581 nationally) — a middle-class / working-renter tenant base. Strengths: schools A+, commute A+, employment A+; Watch: health & safety C-, amenities F, cost of living F.
- Peninsula School District (suburban): math 61% / reading 72% proficiency, ranked #21 of 291 in WA (top 7%) — acceptable for families but not a draw, mixed tenant base, ~2y average lease; only 19% free/reduced lunch — higher-income household profile.
- Market conditions: 212 active listings in the ZIP; 2 comparable units currently listed for rent nearby; high-income renter base; 3,209 units permitted in Pierce County in 2024 (1,269 in 5+ unit buildings).
Forward outlook
- Local home prices are declining (-3.0%/yr); year-one equity from $1k of loan paydown is wiped out by about $5k of value loss. Plan a longer hold.
- Pierce County population projected at +26% by 2050 — long-run rental-demand tailwind backs the buy-and-hold thesis.
- At projected returns (-3.0% appreciation + 3.0% rent growth), your $49k cash investment doubles in ~5 years — after that, you're playing with house money.
Negotiation context
- It's been on market 50 days — a 3% lower offer ($169k) is reasonable based on typical stale-listing flexibility.
- 3 sale attempts since 17y ago with the ask held roughly flat each time — persistent listings suggest the price (not the market) is what's stuck; bring a comps-based counter.
- Current owner paid $18k; list at $174k implies a 841% gain — meaningful room to come down on a strong offer.
Questions for the listing agent
- It's been on market 50 days. Have you received any prior offers? Is the seller open to a 3% concession, seller financing, or rate buy-down credit?
- Built in 1972 — when were the roof, HVAC, electrical panel, plumbing, and water heater last replaced?
- Is there a deadline driving the sale (1031 exchange, divorce, estate, relocation)? That informs how much negotiation room exists.
- Schools are A-rated — typically a magnet for longer-tenancy family renters. What's the average tenant stay here, and is there a school-zone premium baked into asking?
- What's the average days-on-market for RENTAL listings here right now (not sales)? A rising rental-DOM trend means longer vacancies and softer asking-rent achievability than the comps imply.
- What's the recent tenant-quality profile in this submarket — average credit score on applications, eviction rate, late-payment / NSF rate, and stable-employment percentage? A property-management company in the area should have these aggregated.
- How much new for-sale + rental construction is in the pipeline within 1–3 miles? Heavy new supply typically softens prices + rents 12–24 months out; constrained supply supports both.
Investment metrics
- 1% rule
- 1.56% ✓
- Cap rate
- 14.01%
- Cash-on-cash
- 27.58%
- DSCR
- 2.23
- GRM
- 5.3
CMA / ARV
- ARV (median comp)
- $250,968
- List price
- $174,000
- Delta
- -30.67%
- Verdict
- UNDERPRICED
- Comps
- 1 within 2.0 mi
Show comp detail 1 sale within ~0.75 mi
| Address | Dist | Beds/Ba | Sqft | Sold | Price | $/sf | Match |
|---|---|---|---|---|---|---|---|
| 10414 Peacock Hill Ave #54 | 0.00mi | 2/2.0 | 1,430 (+7%) | 9mo | $249,950 | $175 | 82 |
Match score weights: distance 35% · size 25% · config 20% · recency 20%. Top-matched comps best support the ARV.
Projected returns pro-forma
-3.0% appreciation · 3.0% rent growth · sell at horizon
- IRR
- 21.6%
- Equity multiple
- 1.88×
- Total profit
- $43,048
- Equity at exit
- $25,944
- IRR
- 29.7%
- Equity multiple
- 3.65×
- Total profit
- $129,041
- Equity at exit
- $15,044
Cash invested: $48,720 (down + closing). Projections, not guarantees.
Landlord ↔ Tenant lean methodology
- Overall (STATE)
- 28 Tenant-Leaning
- State Washington
- 28 Tenant-Leaning · D+8
- County
- — inherits STATE
- City
- — inherits STATE
ZIP-level market 98332
- Active inventory
- 212
- Price-to-rent
- 5.3×
Monthly cashflow live
- Estimated rent
- $2,719 medium interval (Pro) →
- Mortgage (P&I)
- −$912
- Tax from tax record
- −$44 /mo · $525/yr
- Insurance
- −$72
- HOA
- −$0
- Vacancy / Maint / Mgmt
- −$571
- Net cashflow
- $1,120
Break-even live
UW: 25.0% down · 7.5% · 30yr · 1.5% tax · 5.0% vac · 8.0% maint · 8.0% mgmt
Financing live
Cash to close
- Down payment
- $43,500
- Closing costs
- $5,220
- Reserves months
- —
- Total cash needed
- —
Loan-product check · same deal, 3 products live
Conventional
25% down · 7.5% · 30yr
- Down + closing
- —
- Monthly P&I
- —
- Monthly cashflow
- —
- DSCR
- —
- Eligible?
- —
Personal DTI + credit; lowest rate.
DSCR
20% down · 8.5% · 30yr
- Down + closing
- —
- Monthly P&I
- —
- Monthly cashflow
- —
- DSCR
- —
- Eligible?
- —
No personal income docs; deal must DSCR.
Hard money
10% down · 12.0% · 12mo
- Down + closing
- —
- Monthly P&I
- —
- Monthly cashflow
- —
- DSCR
- —
- Eligible?
- —
Short-term bridge; refi at stabilization.
Rent comps 2 comps
| Address | Beds | Baths | Sqft | Rent | $/sqft | DOM | Units | Dist |
|---|---|---|---|---|---|---|---|---|
| 4113 105th Street Ct Gig Harbor, WA | 3.0 | 2.0 | 1594 | $3,000 | $1.88 | 14d | 1 | 0.19mi |
| 11315 17th Avenue Ct NW Gig Harbor, WA | 3.0 | 2.0 | 1338 | $2,700 | $2.02 | 43d | 1 | 1.48mi |
Listing history 15 events
-
2026-06-10status $174,000 Pending 50 DOM
-
2026-06-09days on market $174,000 Active 50 DOM
-
2026-06-08days on market $174,000 Active 49 DOM
-
2026-06-07days on market $174,000 Active 48 DOM
-
2026-06-04days on market $174,000 Active 45 DOM
-
2026-06-03days on market $174,000 Active 44 DOM
-
2026-06-02days on market $174,000 Active 43 DOM
-
2026-06-01days on market $174,000 Active 42 DOM
-
2026-05-31days on market $174,000 Active 41 DOM
-
2026-05-05status Active
-
2026-04-28status Pending
-
2026-04-13$174,000 Active
-
2009-06-16soldstatus $18,500 Sold
-
2009-06-09historical
-
2009-05-26$23,950
ⓘ Source: listings_history table (triggers on properties + properties_extension) + one-shot
backfill from property_details.listing_events for pre-trigger history.
Tax reassessment forecast WA · Resets to sale price
- Current annual tax
- $525 · $44/mo
- Projected year-2 tax
- $1,705 · $142/mo
- Expected delta
- +$1,180/yr (+$98/mo · 224.7%)
ⓘ Screening estimate from a state-policy table — verify with the county assessor before closing.
Climate risk First Street
- Flood 1/10 Low FEMA zone X (unshaded) · 0% chance over 30 yrs
- Wildfire 1/10 Low
- Heat 3/10 Moderate 7 d/yr ≥87°F today · 14 d/yr by 30 yrs out
- Wind 1/10 Low
- Air quality 6/10 Major 8 unhealthy d/yr today · 8 by 30 yrs out
Nearby sold comps map
Loading sold comps map…
Walkable amenities ~0.75 mi
Loading nearby amenities…
Taxation est. · year 1
- Rental income
- $32,633
- − Mortgage interest
- −$9,747
- − Property taxes
- −$525
- − Insurance
- −$870
- − Repairs & maintenance
- −$2,611
- − Management
- −$2,611
- − Depreciation
- −$5,062
- Taxable income
- $11,208
- Est. tax owed @ 24.0%
- −$2,690
- After-tax cash flow
- $10,745/yr
For passive investors: Depreciation is non-cash, so a rental often shows a tax loss while cash-flowing — sheltering income. Rental losses are passive: they offset passive income freely, and up to $25,000/yr can offset ordinary (W-2) income if you actively participate and your MAGI is under $100k (phasing out to $0 by $150k); unused losses carry forward. On sale, claimed depreciation is recaptured at up to 25%, and gains may owe capital-gains tax (a 1031 exchange can defer both). Figures are a year-1 estimate at your 24.0% rate — not tax advice; consult a CPA.
Schools (NCES district)
- District
- Peninsula School District
- NCES district ID
- 5306690
- Math proficiency
- 61% ▲ 1.00%
- Reading proficiency
- 72% ▼ -1.00%
- Median HH income
- $76,796
- Composite
- 60.35/100
- National rank
- #1718
- State rank
- #21 of 291 in WA
Livability — Gig Harbor
- Score
- 74/100
- State rank
- #177
- US rank
- #4581
Category grades
Schools grade is shown separately in the Schools card above.
Census & demographics
- Census place
- Gig Harbor, WA
- County
- Pierce County · 788,257 people
- City population
- 47,845
- Metro
- Seattle-Tacoma-Bellevue, WA
- Population (ZIP)
- 20,072
- Household income
- $135,330
- Rent vs Own
- Severe rent burden
- 218.0
Population outlook (Pierce County) Hauer SSP2
- Today (2025)
- 956,648 people
- By 2030
- 1,010,862 · +5.7%
- By 2040
- 1,113,170 · +16.4%
- By 2050
- 1,206,524 · +26.1%
- By 2075
- 1,436,425 · +50.2%
- By 2100
- 1,563,654 · +63.5%
Race, ethnicity, and origin ACS 2023
- Neighborhood character
- Predominantly White (82%)
- Race & ethnicity
- White 82% Two or more races 10% Hispanic / Latino 4% Asian 4% Black 1%
- Common ancestry
- Italian 6% Lithuanian 5% Portuguese 4%
- Foreign-born
- 6% · Canada, South Korea
- Languages at home
- 94% English-only · Spanish 2% Russian/Polish/Slavic 1% Other Asian/Pacific 1%
Political lean MEDSL · Pierce
- 2024 margin
- D (+10.8) · D 53.9% · R 43.1% · Other 3.0%
- 2008→2024 swing
- -1.4pp toward R · 2008: 12.2pp · 2024: 10.8pp
- All cycles
- 2024: D+10.8 2020: D+11.2 2016: D+7.5 2012: D+11.0 2008: D+12.2
Not yet ingested
- Civics
- —
Market trends
- HPI YoY
- ▼ -638.13%
- Current HPI
- 335.5178
- Rent YoY
- —
- Metro
- Seattle-Tacoma-Bellevue, WA
- State GDP YoY
- ▲ 4.65%
- F500 in state
- 22
Industry mix (Fortune 500 HQ in WA)
| Industry | F500 HQs | Revenue |
|---|---|---|
| Retail | 2 | $269B |
|
||
| Technology / Retail | 1 | $638B |
|
||
| Technology | 1 | $245B |
|
||
| Telecommunications | 1 | $38B |
|
||
| Food / Beverage | 1 | $36B |
|
||
| Automotive / Trucks | 1 | $34B |
|
||
Price history
+626.5% since first listed6 events — show timeline
- 2026-05-05 Relisted — NWMLS as Distributed by MLS Grid
- 2026-04-28 Pending — NWMLS as Distributed by MLS Grid
- 2026-04-13 Listed $174,000 NWMLS as Distributed by MLS Grid
- 2009-06-16 Sold (MLS) $18,500 NWMLS as Distributed by MLS Grid
- 2009-06-09 Delisted — NWMLS as Distributed by MLS Grid
- 2009-05-26 Listed $23,950 NWMLS as Distributed by MLS Grid
Property tax history
+8.6%/yrLatest (2026): $525 · +0.6% YoY. Source: county tax records.
Cash-flow waterfall
monthlySold comps — $/sqft
last 12 mo · ≤1 miLoading sold comps…