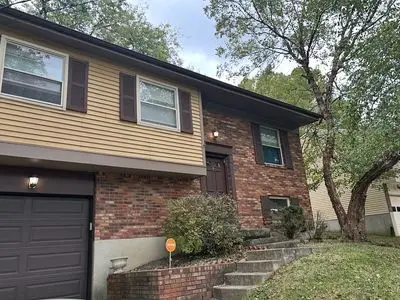
2236 Fayhill Dr · Covedale, OH
Flood risk 1/10 · Minimal
- FEMA flood zone
- X (unshaded)
- Chance of flooding over 30 yrs
- 0.0%
- Est. flood insurance / yr
- $507 – $1,088
Fire risk 1/10 · Minimal
- Est. fire insurance / yr
- $713 – $1,323
Heat risk 4/10 · Minor
- Hot days now (above 103°F)
- 7 days/yr
- Hot days in 30 yrs
- 19 days/yr
Wind risk 2/10 · Minimal
- Chance of severe wind over 30 yrs
- 1.0%
Air-quality risk 3/10 · Minor
- Unhealthy air days now
- 3 days/yr
- Unhealthy air days in 30 yrs
- 5 days/yr
Risk factors via First Street. Map © Google.
Why this score? — see what drove the D+ grade
The composite is a weighted blend of 9 inputs, each scored 0–100. Each bar is that input's sub-score; the figure is the points it added to the 100-point composite (weight × sub-score).
- ARV discount +15.0/15.0
- Cash flow +13.0/30.0
- 1% rule +4.1/10.0
- DSCR +3.9/10.0
- Livability +3.8/5.0
- Rent growth +3.7/5.0
- Schools +2.5/10.0
- Condition / age +2.5/5.0
- Appreciation +0.0/10.0
$174,000
🖨 Deal sheet 📄 Offer letter ✓ Due diligence
Listing remarks
Split level, 3 bedroom, backyard deck, 2 full bathrooms, single garage. Rental income as it is currently being rented. Feel free to contact us at 609-412-0912 or 513-910-5338 Start showing property after June 15th
Key facts
- Backyard deck
- Built 1982
Tags
Neighborhood map
What this means for you Summary
Snapshot
- This is a 3-bed/1.0-bath single-family listed at $174k.
Deal economics
- At list price, monthly cash flow is $-10 ($-120/yr) — negative.
- To cash-flow at today's rent, offer at most $172k (1.0% below list).
- To meet the 1% rule (rent ≥ 1% of price), the offer needs to be $159k (8.8% below list).
- Recommended offer: $159k (8.8% below list) — sets the bar for 1% rule.
- Cap rate 6.2% vs local median 4.2% in Covedale — top-decile yield for the area; either an underpriced asset or a hidden risk that comps aren't pricing in. Stress-test before assuming the spread holds.
Location & tenants
- Location reads 76/100 on livability (#235 in OH, #3,713 nationally) — a middle-class / working-renter tenant base. Strengths: cost of living A+, housing A+, crime A; Watch: schools C-, amenities F, health & safety F.
- Cincinnati Public Schools (urban): math 25% / reading 36% proficiency, ranked #581 of 656 in OH (top 89%) — families likely to look elsewhere, expect single-tenant / working-renter base with shorter leases; 70% free/reduced lunch — lower-income household profile, screen leases tightly.
- Market conditions: Rents rising fast (+4.9%/yr); 78 active listings in the ZIP; 14 comparable units currently listed for rent nearby; rentals at typical pace (median 15d on market — plan ~3-4 weeks tenant-placement turnaround); 801 units permitted in Hamilton County in 2024 (190 in 5+ unit buildings).
Forward outlook
- Local home prices are declining (-3.0%/yr); year-one equity from $1k of loan paydown is wiped out by about $5k of value loss. Plan a longer hold.
Negotiation context
- Only 1 days on market — expect competitive offers; lowballing is unlikely to land.
- 4 sale attempts since 20y ago with the ask held roughly flat each time — persistent listings suggest the price (not the market) is what's stuck; bring a comps-based counter.
- Current owner paid $94k; list at $174k implies a 85% gain — meaningful room to come down on a strong offer.
Questions for the listing agent
- What do current leases actually rent for vs. the listed asking? Can we see a recent rent roll and the last 12 months of T-12 income?
- Is there a deadline driving the sale (1031 exchange, divorce, estate, relocation)? That informs how much negotiation room exists.
- The area grade is low — what's the realistic commute time and amenity access for the typical tenant pool here? Any planned neighborhood developments (good or bad) we should know about?
- What's the average days-on-market for RENTAL listings here right now (not sales)? A rising rental-DOM trend means longer vacancies and softer asking-rent achievability than the comps imply.
- What's the recent tenant-quality profile in this submarket — average credit score on applications, eviction rate, late-payment / NSF rate, and stable-employment percentage? A property-management company in the area should have these aggregated.
- How much new for-sale + rental construction is in the pipeline within 1–3 miles? Heavy new supply typically softens prices + rents 12–24 months out; constrained supply supports both.
Investment metrics
- 1% rule
- 0.91% ✗
- Cap rate
- 6.22%
- Cash-on-cash
- -0.25%
- DSCR
- 0.99
- GRM
- 9.1
CMA / ARV
- ARV (on-the-fly)
- $216,080
- Comps found
- 12
Show comp detail 12 sales within ~0.75 mi
| Address | Dist | Beds/Ba | Sqft | Sold | Price | $/sf | Match |
|---|---|---|---|---|---|---|---|
| 5487 Belcross Ct | 0.22mi | 4/2.5 (+1) | 1,525 (+3%) | 2mo | $285,000 | $187 | 71 |
| 3249 Brater Ave | 0.44mi | 4/1.0 (+1) | 1,499 (+1%) | 2mo | $190,000 | $127 | 71 |
| 5377 Sidney Rd | 0.36mi | 4/1.5 (+1) | 1,358 (-8%) | 0mo | $221,000 | $163 | 62 |
| 5461 Bellfield Ln | 0.18mi | 3/2.0 | 1,697 (+15%) | 2mo | $248,000 | $146 | 61 |
| 2100 Faywood Dr | 0.16mi | 4/2.0 (+1) | 1,300 (-12%) | 6mo | $212,000 | $163 | 58 |
| 3604 Muddy Creek Rd | 0.36mi | 3/1.5 | 1,289 (-13%) | 4mo | $160,000 | $124 | 56 |
| 5524 Sidney Rd | 0.28mi | 3/2.5 | 1,276 (-14%) | 3mo | $289,000 | $226 | 56 |
| 2354 Neeb Rd | 0.65mi | 3/2.0 | 1,421 (-4%) | 6mo | $279,000 | $196 | 54 |
| 3659 Allview Cir | 0.42mi | 4/1.5 (+1) | 1,308 (-12%) | 6mo | $131,000 | $100 | 49 |
| 3041 Crestmoor Ln | 0.62mi | 4/2.0 (+1) | 1,605 (+8%) | 1mo | $225,000 | $140 | 47 |
| 3442 Corrine Ave | 0.52mi | 3/2.0 | 1,684 (+14%) | 4mo | $180,000 | $107 | 45 |
| 3088 Belden Cir | 0.68mi | 3/2.0 | 1,643 (+11%) | 2mo | $231,500 | $141 | 44 |
Match score weights: distance 35% · size 25% · config 20% · recency 20%. Top-matched comps best support the ARV.
Projected returns pro-forma
-3.0% appreciation · 4.87% rent growth · sell at horizon
- IRR
- -14.5%
- Equity multiple
- 0.47×
- Total profit
- $-25,726
- Equity at exit
- $25,944
- IRR
- -2.8%
- Equity multiple
- 0.79×
- Total profit
- $-10,000
- Equity at exit
- $15,044
Cash invested: $48,720 (down + closing). Projections, not guarantees.
Landlord ↔ Tenant lean methodology
- Overall (STATE)
- 73 Landlord-Friendly
- State Ohio
- 73 Landlord-Friendly · R+6
- County
- — inherits STATE
- City
- — inherits STATE
ZIP-level market 45238
- Rents YoY
- 4.9%
- Active inventory
- 78
- Price-to-rent
- 9.1×
Monthly cashflow live
- Estimated rent
- $1,587 high interval (Pro) →
- Mortgage (P&I)
- −$912
- Tax from tax record
- −$279 /mo · $3,347/yr
- Insurance
- −$72
- HOA
- −$0
- Vacancy / Maint / Mgmt
- −$333
- Net cashflow
- $-10
Break-even live
UW: 25.0% down · 7.5% · 30yr · 1.5% tax · 5.0% vac · 8.0% maint · 8.0% mgmt
Financing live
Cash to close
- Down payment
- $43,500
- Closing costs
- $5,220
- Reserves months
- —
- Total cash needed
- —
Loan-product check · same deal, 3 products live
Conventional
25% down · 7.5% · 30yr
- Down + closing
- —
- Monthly P&I
- —
- Monthly cashflow
- —
- DSCR
- —
- Eligible?
- —
Personal DTI + credit; lowest rate.
DSCR
20% down · 8.5% · 30yr
- Down + closing
- —
- Monthly P&I
- —
- Monthly cashflow
- —
- DSCR
- —
- Eligible?
- —
No personal income docs; deal must DSCR.
Hard money
10% down · 12.0% · 12mo
- Down + closing
- —
- Monthly P&I
- —
- Monthly cashflow
- —
- DSCR
- —
- Eligible?
- —
Short-term bridge; refi at stabilization.
Rent comps 14 comps
| Address | Beds | Baths | Sqft | Rent | $/sqft | DOM | Units | Dist |
|---|---|---|---|---|---|---|---|---|
| 3414 Corrine Ave Cincinnati, OH | 3.0 | 2.0 | 1542 | $1,861 | $1.21 | 1d | 1 | 0.60mi |
| 5256 Ponce Ln Cincinnati, OH | 3.0 | 2.0 | 1270 | $1,866 | $1.47 | 1d | 1 | 0.66mi |
| 3114 Roosevelt Ave Cincinnati, OH | 3.0 | 1.0 | 1450 | $1,400 | $0.97 | 23d | 1 | 0.76mi |
| 3053 N Hegry Cir #1 Cincinnati, OH | 2.0 | 1.0 | 954 | $1,250 | $1.31 | 4d | 1 | 0.91mi |
| 2511 Ferguson Rd Unit 2537 Cincinnati, OH | 3.0 | 1.5 | 1100 | $1,650 | $1.50 | 23d | 1 | 1.05mi |
| 2598 Ferguson Rd Cincinnati, OH | 2.0 | 1.0 | 950 | $1,145 | $1.21 | 4d | 1 | 1.11mi |
| 2969 Four Towers Dr Unit 2 Cincinnati, OH | 2.0 | 1.0 | 960 | $1,150 | $1.20 | 23d | 1 | 1.13mi |
| 2905 Queen City Ave Unit 1 Cincinnati, OH | 2.0 | 1.0 | 900 | $1,350 | $1.50 | 23d | 1 | 1.21mi |
| 2905 Queen City Ave Cincinnati, OH | 2.0 | 1.0 | 1000 | $1,350 | $1.35 | 4d | 1 | 1.21mi |
| 5408 Style Ln Cincinnati, OH | 4.0 | 1.5 | 1824 | $2,625 | $1.44 | 1d | 1 | 1.22mi |
| 3393 Robb Ave Cincinnati, OH | 3.0 | 1.5 | 1235 | $1,750 | $1.42 | 23d | 1 | 1.25mi |
| 4213 Applegate Ave Unit 2 Cincinnati, OH | 2.0 | 1.0 | 1054 | $1,300 | $1.23 | 14d | 1 | 1.25mi |
| 2706 E Tower Dr Cincinnati, OH | 1.0–3.0 | 1.0–2.0 | 951 | $1,520 | $1.60 | 1d | 61 | 1.34mi |
| 1723 Tuxworth Ave Cincinnati, OH | 3.0 | 2.0 | 1587 | $1,800 | $1.13 | 23d | 1 | 1.47mi |
Listing history 10 events
-
2026-05-26$174,000 Active
-
2012-01-04$114,900
-
2011-08-13historical
-
2011-05-13$119,900
-
2006-05-27historical
-
2006-02-26$119,900
-
1999-06-08soldstatus $94,000
-
1995-08-22soldstatus $77,632
-
1992-04-02soldstatus $73,500
-
1987-05-13soldstatus $55,900
ⓘ Source: listings_history table (triggers on properties + properties_extension) + one-shot
backfill from property_details.listing_events for pre-trigger history.
Tax reassessment forecast OH · Partial reset (capped growth)
- Current annual tax
- $3,347 · $279/mo
- Projected year-2 tax
- $3,347 · $279/mo
- Expected delta
- $0/yr ($0/mo · 0.0%)
ⓘ Screening estimate from a state-policy table — verify with the county assessor before closing.
Climate risk First Street
- Flood 1/10 Low FEMA zone X (unshaded) · 0% chance over 30 yrs
- Wildfire 1/10 Low
- Heat 4/10 Moderate 7 d/yr ≥103°F today · 19 d/yr by 30 yrs out
- Wind 2/10 Low 100% chance of damaging wind over 30 yrs
- Air quality 3/10 Moderate 3 unhealthy d/yr today · 5 by 30 yrs out
Nearby sold comps map
Loading sold comps map…
Walkable amenities ~0.75 mi
Loading nearby amenities…
Taxation est. · year 1
- Rental income
- $19,047
- − Mortgage interest
- −$9,747
- − Property taxes
- −$3,347
- − Insurance
- −$870
- − Repairs & maintenance
- −$1,524
- − Management
- −$1,524
- − Depreciation
- −$5,062
- Taxable loss
- −$3,026
- Est. tax savings @ 24.0%
- +$726
- After-tax cash flow
- $607/yr
For passive investors: Depreciation is non-cash, so a rental often shows a tax loss while cash-flowing — sheltering income. Rental losses are passive: they offset passive income freely, and up to $25,000/yr can offset ordinary (W-2) income if you actively participate and your MAGI is under $100k (phasing out to $0 by $150k); unused losses carry forward. On sale, claimed depreciation is recaptured at up to 25%, and gains may owe capital-gains tax (a 1031 exchange can defer both). Figures are a year-1 estimate at your 24.0% rate — not tax advice; consult a CPA.
Schools (NCES district)
- District
- Cincinnati Public Schools
- NCES district ID
- 3904375
- Math proficiency
- 25% ▼ -19.00%
- Reading proficiency
- 36% ▼ -14.00%
- Median HH income
- $35,743
- Composite
- 25.21/100
- National rank
- #7508
- State rank
- #581 of 656 in OH
Livability — Covedale
- Score
- 76/100
- State rank
- #235
- US rank
- #3713
Category grades
Schools grade is shown separately in the Schools card above.
Census & demographics
- Census place
- Covedale, OH
- County
- Hamilton County · 701,295 people
- Metro
- Cincinnati, OH-KY-IN
- Population (ZIP)
- 48,351
- Household income
- $66,277
- Rent vs Own
- Severe rent burden
- 2012.0
Population outlook (Hamilton County) Hauer SSP2
- Today (2025)
- 826,054 people
- By 2030
- 830,947 · +0.6%
- By 2040
- 832,319 · +0.8%
- By 2050
- 822,428 · -0.4%
- By 2075
- 788,688 · -4.5%
- By 2100
- 710,674 · -14.0%
Race, ethnicity, and origin ACS 2023
- Neighborhood character
- Majority White (64%)
- Race & ethnicity
- White 64% Black 28% Two or more races 6% Hispanic / Latino 3%
- Common ancestry
- Italian 2% Lithuanian 2% Slovak 1%
- Foreign-born
- 10% · Canada
- Languages at home
- 88% English-only · French/Haitian/Cajun 4% Spanish 2% German/W. Germanic 1%
Political lean MEDSL · Hamilton
- 2024 margin
- D (+14.9) · D 57.0% · R 42.1%
- 2008→2024 swing
- +7.9pp toward D · 2008: 7.0pp · 2024: 14.9pp
- All cycles
- 2024: D+14.9 2020: D+15.9 2016: D+9.5 2012: D+4.9 2008: D+7.0
Not yet ingested
- Civics
- —
Market trends
- HPI YoY
- ▼ -197.57%
- Current HPI
- 213.5097
- Rent YoY
- ▲ 4.87%
- Metro
- Cincinnati, OH-KY-IN
- State GDP YoY
- ▲ 1.98%
- F500 in state
- 48
Industry mix (Fortune 500 HQ in OH)
| Industry | F500 HQs | Revenue |
|---|---|---|
| Insurance | 3 | $145B |
|
||
| Industrial Machinery | 3 | $49B |
|
||
| Financial Services | 3 | $24B |
|
||
| Consumer Goods | 2 | $93B |
|
||
| Aerospace / Defense | 2 | $47B |
|
||
| Utilities | 2 | $33B |
|
||
Price history
+211.3% since first listed10 events — show timeline
- 2026-05-26 Listed $174,000 FSBO.com
- 2012-01-04 Listed $114,900 Cincy MLS
- 2011-08-13 Listing Removed — Cincy MLS
- 2011-05-13 Listed $119,900 Cincy MLS
- 2006-05-27 Listing Removed — Cincy MLS
- 2006-02-26 Listed $119,900 Cincy MLS
- 1999-06-08 Sold (Public Records) $94,000 Public Records
- 1995-08-22 Sold (Public Records) $77,632 Public Records
- 1992-04-02 Sold (Public Records) $73,500 Public Records
- 1987-05-13 Sold (Public Records) $55,900 Public Records
Property tax history
+4.1%/yrLatest (2025): $3,347 · +2.8% YoY. Source: county tax records.
Cash-flow waterfall
monthlySold comps — $/sqft
last 12 mo · ≤1 miLoading sold comps…