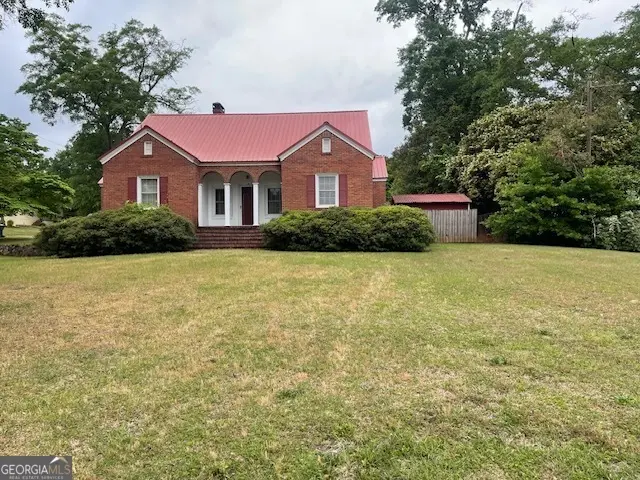
320 Parkway Dr · Thomaston, GA
Flood risk 1/10 · Minimal
- FEMA flood zone
- X (unshaded)
- Chance of flooding over 30 yrs
- 0.0%
- Est. flood insurance / yr
- $473 – $860
Fire risk 3/10 · Minor
- Est. fire insurance / yr
- $963 – $1,789
Heat risk 7/10 · Major
- Hot days now (above 108°F)
- 7 days/yr
- Hot days in 30 yrs
- 18 days/yr
Wind risk 6/10 · Moderate
- Chance of severe wind over 30 yrs
- 65.0%
Air-quality risk 3/10 · Minor
- Unhealthy air days now
- 2 days/yr
- Unhealthy air days in 30 yrs
- 3 days/yr
Risk factors via First Street. Map © Google.
Why this score? — see what drove the D- grade
The composite is a weighted blend of 9 inputs, each scored 0–100. Each bar is that input's sub-score; the figure is the points it added to the 100-point composite (weight × sub-score).
- ARV discount +15.0/15.0
- Cash flow +7.7/30.0
- Livability +2.9/5.0
- Rent growth +2.5/5.0
- Condition / age +2.5/5.0
- Schools +2.1/10.0
- 1% rule +1.8/10.0
- DSCR +1.8/10.0
- Appreciation +0.0/10.0
$159,900
🖨 Deal sheet (PDF) 📄 Offer letter ✓ Due diligence
Listing remarks
New to the Market!!! 4 bedroom 2 bath brick 1 1/2 story home situated on a nice corner lot overlooking the park that needs some TLC. House has a large living room with fireplace (gas logs), dining room, kitchen with plenty of cabinets, stove, refrigerator, breakfast area, oversized laundry room, hardwood floors, central heat and air, small unfinished basement area. Outside of home features a large double carport, 2 small out buildings. This home has the character but needs your special touch. Call today for a showing.
Key facts
- Large living room
- Dining room
- Corner lot
Tags
Property features AI
Finance
- Other: Property listed as resale
- HOA & community: No homeowners association; Community amenities include park, playground, sidewalks, street lights, walk-to-schools, and nearby shopping
Exterior
- Parking: Carport; Off-street parking
- Utilities: Public water; Public sewer; Electricity available; Natural gas available; Sewer connected; Water available
- Home design: Single-family residential house; One and one-half story
- Construction: Built in 1936; Brick construction; Metal roof; Unfinished partial basement
- Exterior features: Corner lot; Outbuilding on the property
Interior
- Kitchen: Refrigerator included
- Bedrooms: 4 bedrooms total, 2 located on the main level
- Flooring: Hardwood flooring; Vinyl flooring
- Bathrooms: 2 full bathrooms
- Heating & cooling: Central heating; Central air conditioning; Ceiling fans
- Interior features: Tile baths; Family room; Basement with interior entry — partial and unfinished; Gas log fireplace in the family room
- Laundry & utility: Laundry room; Laundry features listed as 'Other'
Neighborhood map
What this means for you Summary
Snapshot
- This is a 3-bed/2.0-bath single-family listed at $160k.
Deal economics
- At list price, monthly cash flow is $-185 ($-2k/yr) — negative.
- To cash-flow at today's rent, offer at most $127k (20.4% below list).
- To meet the 1% rule (rent ≥ 1% of price), the offer needs to be $110k (31.5% below list).
- Recommended offer: $110k (31.5% below list) — sets the bar for 1% rule.
- Cap rate 4.9% vs local median 4.0% in Thomaston — meaningfully above typical; check what's discounted (condition, days-on-market, listing class) to confirm the premium yield is real.
Location & tenants
- Location reads 57/100 on livability (#455 in GA) — a working-class tenant base; expect higher turnover. Strengths: cost of living A+, housing A-; Watch: crime C-, amenities F, commute F.
- Thomaston-Upson County (rural): math 26% / reading 26% proficiency, ranked #123 of 174 in GA (top 71%) — low school quality limits family demand, transient renter base, plan for 1-2y turnover; 60% free/reduced lunch — lower-income household profile, screen leases tightly.
- Zoned schools: Upson-Lee Primary School (1,049 students, 95% FRL); Upson-Lee Middle School (math 22% / reading 32%, grade F, #271 of 470 statewide, top 60%, 927 students, 83% FRL); Upson-Lee High School (math 18% / reading 17%, grade F, #264 of 424 statewide, top 63%, 1,178 students, 70% FRL) — zoned schools average 83% FRL vs 60% district-wide (23 pts higher); higher-poverty schools than district average — tighter screening recommended.
- Market conditions: 202 active listings in the ZIP; 1 comparable units currently listed for rent nearby; 111 units permitted in Upson County in 2024 (0 in 5+ unit buildings).
Forward outlook
- Local home prices are declining (-3.0%/yr); year-one equity from $1k of loan paydown is wiped out by about $5k of value loss. Plan a longer hold.
- Upson County population projected at -27% by 2050 — secular population decline; favor cash flow + early exit over multi-decade hold.
Negotiation context
- Only 2 days on market — expect competitive offers; lowballing is unlikely to land.
Risks & watch-outs
- Watch-outs: built in 1936 — expect roof / HVAC / electrical / plumbing capex.
- Climate carrying-cost: major wind risk, 65% chance of damaging wind over 30y; extreme-heat days projected 7→18/yr by 2055 (HVAC capex compounding) — expect insurance premiums to compound above CPI over the hold.
Questions for the listing agent
- What do current leases actually rent for vs. the listed asking? Can we see a recent rent roll and the last 12 months of T-12 income?
- Built in 1936 — when were the roof, HVAC, electrical panel, plumbing, and water heater last replaced?
- Is there a deadline driving the sale (1031 exchange, divorce, estate, relocation)? That informs how much negotiation room exists.
- Schools are F-rated, which usually means shorter tenancies and higher turnover. Who's the typical renter profile here, and what's been the actual vacancy rate?
- The area grade is low — what's the realistic commute time and amenity access for the typical tenant pool here? Any planned neighborhood developments (good or bad) we should know about?
- What's the average days-on-market for RENTAL listings here right now (not sales)? A rising rental-DOM trend means longer vacancies and softer asking-rent achievability than the comps imply.
- What's the recent tenant-quality profile in this submarket — average credit score on applications, eviction rate, late-payment / NSF rate, and stable-employment percentage? A property-management company in the area should have these aggregated.
- How much new for-sale + rental construction is in the pipeline within 1–3 miles? Heavy new supply typically softens prices + rents 12–24 months out; constrained supply supports both.
Investment metrics
- 1% rule
- 0.68% ✗
- Cap rate
- 4.91%
- Cash-on-cash
- -4.95%
- DSCR
- 0.78
- GRM
- 12.2
CMA / ARV
- ARV (on-the-fly)
- $200,592
- Comps found
- 12
Show comp detail 12 sales within ~0.75 mi
| Address | Dist | Beds/Ba | Sqft | Sold | Price | $/sf | Match |
|---|---|---|---|---|---|---|---|
| 620 E Lee St | 0.50mi | 3/2.0 | 1,400 (+0%) | 3mo | $205,000 | $146 | 73 |
| 309 W Thompson St W | 0.47mi | 3/2.0 | 1,377 (-1%) | 7mo | $196,000 | $142 | 70 |
| 127 3rd St | 0.41mi | 3/2.0 | 1,380 (-1%) | 19mo | $180,000 | $130 | 64 |
| 417 Howell St | 0.54mi | 3/1.0 | 1,475 (+6%) | 4mo | $212,000 | $144 | 58 |
| 410 Barnesville St | 0.37mi | 3/2.0 | 1,272 (-9%) | 20mo | $146,000 | $115 | 52 |
| 105 Avenue L Ave | 0.48mi | 2/2.0 (-1) | 1,413 (+1%) | 22mo | $58,000 | $41 | 52 |
| 310 Triune Mill Rd | 0.39mi | 3/1.0 | 1,258 (-10%) | 13mo | $200,850 | $160 | 51 |
| 97 Third St | 0.67mi | 3/1.0 | 1,368 (-2%) | 14mo | $99,000 | $72 | 50 |
| 603 E Main St | 0.21mi | 2/2.0 (-1) | 1,590 (+14%) | 21mo | $185,000 | $116 | 44 |
| 306A Jackson Ave | 0.63mi | 4/2.0 (+1) | 1,486 (+7%) | 17mo | $230,000 | $155 | 40 |
| 175 Saw Mill Ct | 0.59mi | 3/2.0 | 1,197 (-14%) | 15mo | $215,000 | $180 | 36 |
| 135 Glenview Way Lot 8 | 0.56mi | 4/2.0 (+1) | 1,601 (+15%) | 19mo | $267,900 | $167 | 28 |
Match score weights: distance 35% · size 25% · config 20% · recency 20%. Top-matched comps best support the ARV.
Projected returns pro-forma
-3.0% appreciation · 3.0% rent growth · sell at horizon
- IRR
- -24.7%
- Equity multiple
- 0.16×
- Total profit
- $-37,691
- Equity at exit
- $23,842
- IRR
- -20.5%
- Equity multiple
- -0.07×
- Total profit
- $-48,038
- Equity at exit
- $13,825
Cash invested: $44,772 (down + closing). Projections, not guarantees.
Landlord ↔ Tenant lean methodology
- Overall (STATE)
- 90 Strongly Landlord-Friendly
- State Georgia
- 90 Strongly Landlord-Friendly · R+3
- County
- — inherits STATE
- City
- — inherits STATE
ZIP-level market 30286
- Home prices YoY
- -14.7%
- Active inventory
- 202
- Price-to-rent
- 12.2×
Monthly cashflow live
- Estimated rent
- $1,095 medium interval (Pro) →
- Mortgage (P&I)
- −$839
- Tax from tax record
- −$145 /mo · $1,735/yr
- Insurance
- −$67
- HOA
- −$0
- Vacancy / Maint / Mgmt
- −$230
- Net cashflow
- $-185
Break-even live
Sensitivity live
| Price | -10% $-94 | -5% $-139 | +0% $-185 | +5% $-230 | +10% $-275 |
|---|---|---|---|---|---|
| Rent | -10% $-271 | -5% $-228 | +0% $-185 | +5% $-141 | +10% $-98 |
| Rate | -1.0pp $-104 | -0.5pp $-144 | base $-185 | +0.5pp $-226 | +1.0pp $-268 |
UW: 25.0% down · 7.5% · 30yr · 1.5% tax · 5.0% vac · 8.0% maint · 8.0% mgmt
Financing live
Cash to close
- Down payment
- $39,975
- Closing costs
- $4,797
- Reserves months
- —
- Total cash needed
- —
Loan-product check · same deal, 3 products live
Conventional
25% down · 7.5% · 30yr
- Down + closing
- —
- Monthly P&I
- —
- Monthly cashflow
- —
- DSCR
- —
- Eligible?
- —
Personal DTI + credit; lowest rate.
DSCR
20% down · 8.5% · 30yr
- Down + closing
- —
- Monthly P&I
- —
- Monthly cashflow
- —
- DSCR
- —
- Eligible?
- —
No personal income docs; deal must DSCR.
Hard money
10% down · 12.0% · 12mo
- Down + closing
- —
- Monthly P&I
- —
- Monthly cashflow
- —
- DSCR
- —
- Eligible?
- —
Short-term bridge; refi at stabilization.
Rent comps 1 comps
| Address | Beds | Baths | Sqft | Rent | $/sqft | DOM | Units | Dist |
|---|---|---|---|---|---|---|---|---|
| 705 Barnesville St Thomaston, GA | 3.0 | 1.0 | 936 | $1,095 | $1.17 | 3d | 1 | 0.52mi |
Listing history 2 events
-
2026-05-04status Under Contract
-
2026-04-30$159,900 New
ⓘ Source: listings_history table (triggers on properties + properties_extension) + one-shot
backfill from property_details.listing_events for pre-trigger history.
Tax reassessment forecast GA · Resets to sale price
- Current annual tax
- $1,735 · $145/mo
- Projected year-2 tax
- $1,735 · $145/mo
- Expected delta
- $0/yr ($0/mo · 0.0%)
ⓘ Screening estimate from a state-policy table — verify with the county assessor before closing.
Climate risk First Street
- Flood 1/10 Low FEMA zone X (unshaded) · 0% chance over 30 yrs
- Wildfire 3/10 Moderate
- Heat 7/10 Severe 7 d/yr ≥108°F today · 18 d/yr by 30 yrs out
- Wind 6/10 Major 65% chance of damaging wind over 30 yrs
- Air quality 3/10 Moderate 2 unhealthy d/yr today · 3 by 30 yrs out
Nearby sold comps map
Loading sold comps map…
Walkable amenities ~0.75 mi
Loading nearby amenities…
Taxation est. · year 1
- Rental income
- $13,140
- − Mortgage interest
- −$8,957
- − Property taxes
- −$1,735
- − Insurance
- −$800
- − Repairs & maintenance
- −$1,051
- − Management
- −$1,051
- − Depreciation
- −$4,652
- Taxable loss
- −$5,105
- Est. tax savings @ 24.0%
- +$1,225
- After-tax cash flow
- $-991/yr
For passive investors: Depreciation is non-cash, so a rental often shows a tax loss while cash-flowing — sheltering income. Rental losses are passive: they offset passive income freely, and up to $25,000/yr can offset ordinary (W-2) income if you actively participate and your MAGI is under $100k (phasing out to $0 by $150k); unused losses carry forward. On sale, claimed depreciation is recaptured at up to 25%, and gains may owe capital-gains tax (a 1031 exchange can defer both). Figures are a year-1 estimate at your 24.0% rate — not tax advice; consult a CPA.
Schools (NCES district)
- District
- Thomaston-Upson County
- NCES district ID
- 1305280
- Math proficiency
- 26% ▼ -14.00%
- Reading proficiency
- 26% ▼ -6.00%
- Median HH income
- $34,757
- Composite
- 21.44/100
- National rank
- #8338
- State rank
- #123 of 174 in GA
Livability — Thomaston
- Score
- 57/100
- State rank
- #455
- US rank
- #21482
Category grades
Schools grade is shown separately in the Schools card above.
Census & demographics
- Census place
- Thomaston, GA
- City population
- 24,616
- Population (ZIP)
- 24,616
Population outlook (Upson County) Hauer SSP2
- Today (2025)
- 24,396 people
- By 2030
- 23,158 · -5.1%
- By 2040
- 20,522 · -15.9%
- By 2050
- 17,828 · -26.9%
- By 2075
- 12,216 · -49.9%
- By 2100
- 7,779 · -68.1%
Race, ethnicity, and origin ACS 2023
- Neighborhood character
- Predominantly White (65%)
- Race & ethnicity
- White 65% Black 27% Two or more races 4% Hispanic / Latino 3%
- Common ancestry
- Italian 1% Slovak 1% Serbian 1%
- Foreign-born
- 2% · Canada
- Languages at home
- 98% English-only · Spanish 1%
Political lean MEDSL · Upson
- 2024 margin
- Solid R (+39.7) · D 30.0% · R 69.7%
- 2008→2024 swing
- -11.5pp toward R · 2008: -28.3pp · 2024: -39.7pp
- All cycles
- 2024: R+39.7 2020: R+34.1 2016: R+35.0 2012: R+29.1 2008: R+28.3
Not yet ingested
- Civics
- —
Market trends
- HPI YoY
- ▼ -54.56%
- Current HPI
- 316.6771
- Rent YoY
- —
- Metro
- —
- State GDP YoY
- ▲ 2.66%
- F500 in state
- 28
Industry mix (Fortune 500 HQ in GA)
| Industry | F500 HQs | Revenue |
|---|---|---|
| Paper / Packaging | 2 | $29B |
|
||
| Retail | 1 | $160B |
|
||
| Transportation / Logistics | 1 | $91B |
|
||
| Airlines | 1 | $62B |
|
||
| Consumer Goods | 1 | $47B |
|
||
| Utilities | 1 | $25B |
|
||
Price history
2 events — show timeline
- 2026-05-04 Pending — GAMLS
- 2026-04-30 Listed $159,900 GAMLS
Property tax history
+3.7%/yrLatest (2025): $1,735 · -1.9% YoY. Source: county tax records.
Cash-flow waterfall
monthlySold comps — $/sqft
last 12 mo · ≤1 miLoading sold comps…