1124 N Point Rd · Dundalk, MD
Flood risk 1/10 · Minimal
- FEMA flood zone
- X (unshaded)
- Chance of flooding over 30 yrs
- 0.0%
- Est. flood insurance / yr
- $473 – $860
Fire risk 1/10 · Minimal
- Est. fire insurance / yr
- $755 – $1,403
Heat risk 8/10 · Major
- Hot days now (above 103°F)
- 7 days/yr
- Hot days in 30 yrs
- 15 days/yr
Wind risk 6/10 · Moderate
- Chance of severe wind over 30 yrs
- 27.0%
Air-quality risk 5/10 · Moderate
- Unhealthy air days now
- 6 days/yr
- Unhealthy air days in 30 yrs
- 8 days/yr
Risk factors via First Street. Map © Google.
Why this score? — see what drove the B- grade
The composite is a weighted blend of 9 inputs, each scored 0–100. Each bar is that input's sub-score; the figure is the points it added to the 100-point composite (weight × sub-score).
- Cash flow +30.0/30.0
- 1% rule +10.0/10.0
- DSCR +10.0/10.0
- ARV discount +7.5/15.0
- Livability +4.2/5.0
- Rent growth +2.5/5.0
- Condition / age +2.5/5.0
- Schools +2.3/10.0
- Appreciation +0.0/10.0
$100,000
🖨 Deal sheet 📄 Offer letter ✓ Due diligence
Listing remarks
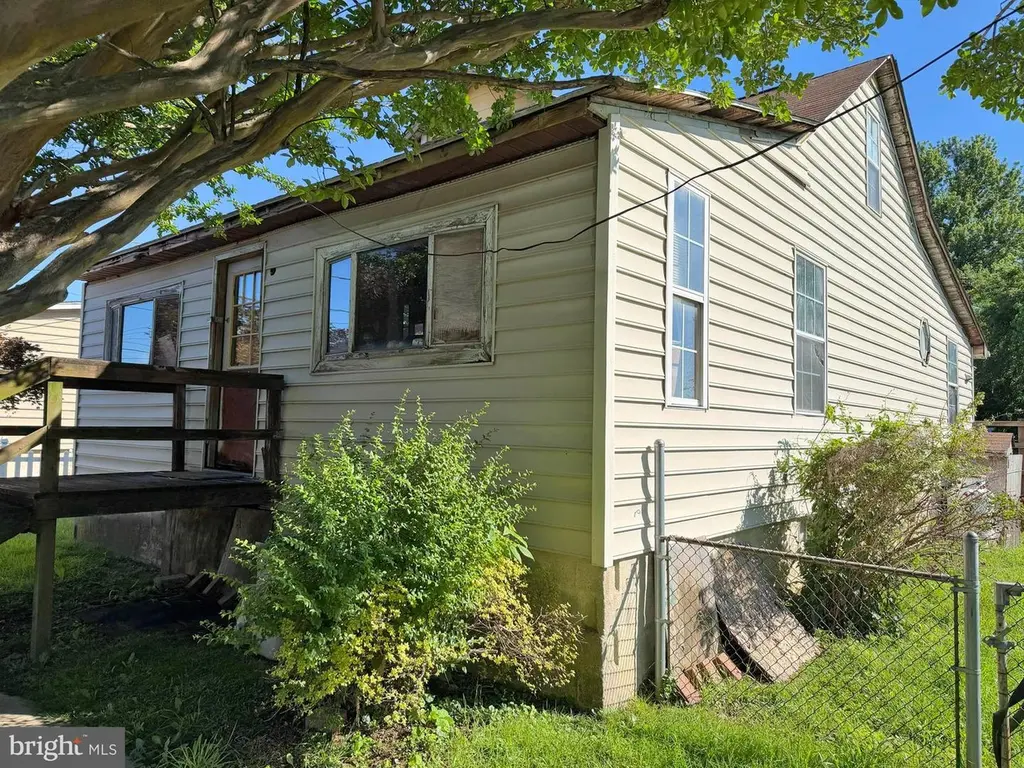
ABSOLUTE REAL ESTATE AUCTION TO THE HIGHEST BIDDER OVER $100,000 featuring ON SITE and SIMULCAST ONLINE BIDDING! Online Bidding Opens - Tuesday, July 7, 2026. Live On Site Auction - Wednesday, July 8, 2026 at 11:00 AM. List price is opening bid only. Vinyl sided bungalow, constructed in 1924, containing 1,235 square feet of living area and 650 square feet of basement space, according to public tax records. The home has an asphalt shingle roof, vinyl double-hung windows, concrete block foundation and rear wheelchair ramp. 1124 North Point Road is located in southeastern Baltimore County, south of I-695 and east of Merritt Boulevard. Housing in the surrounding area is a mixture of older detac
Key facts
- 7,500 sq ft lot
- Parking
- Built 1924
Property features AI
Finance
- Other: Below-grade area: 650; Above-grade finished area: 1,235; Ground rent paid annually
- Financial info: Ownership: Fee simple; Property condition: Major rehab needed
Exterior
- Parking: Off-street parking (1 space); Total of 1 garage/parking space
- Utilities: Public water; Public sewer
- Home design: Detached structure; Frame construction with vinyl siding
- Construction: Asphalt shingle roof; Block foundation; Double-hung, vinyl-clad windows; Unfinished basement
- Exterior features: Rear fencing; Porch(es), enclosed
Interior
- Kitchen: Gas oven/range; Refrigerator
- Bedrooms: Two bedrooms on the main level
- Bathrooms: One full bathroom (main level)
- Heating & cooling: Forced air heating; Cooling: other
- Interior features: Entry level bedroom; Eat-in kitchen with table space; Sliding glass door
Neighborhood map
What this means for you Summary
Snapshot
- This is a 2-bed/1.0-bath single-family listed at $100k.
Deal economics
- At list price, monthly cash flow is $747 ($9k/yr) — positive.
- The deal already cash-flows at list — no discount required.
- Meets the 1% rule at list price ($2k rent vs $100k).
- Recommended offer: $98k (1.5% below list) — sets the bar for market timing.
- Cap rate 15.3% vs local median 6.2% in Dundalk — top-decile yield for the area; either an underpriced asset or a hidden risk that comps aren't pricing in. Stress-test before assuming the spread holds.
Location & tenants
- Location reads 85/100 on livability (#16 in MD, #510 nationally) — a professional / high-income tenant draw. Strengths: amenities A+, commute A+, housing A+; Watch: crime F.
- Baltimore County Public Schools (suburban): math 15% / reading 34% proficiency, ranked #11 of 24 in MD (top 46%) — low school quality limits family demand, transient renter base, plan for 1-2y turnover.
- Zoned schools: Berkshire Elementary (math 8% / reading 14%, grade F, #589 of 860 statewide, top 68%, 471 students, 66% FRL); Holabird Middle (math 4% / reading 19%, grade F, #205 of 225 statewide, top 92%, 912 students, 65% FRL); Patapsco High And Center For Arts (math 7% / reading 37%, grade F, #171 of 222 statewide, top 78%, 1,312 students, 62% FRL) — zoned schools average 65% FRL vs 39% district-wide (26 pts higher); higher-poverty schools than district average — tighter screening recommended.
- Market conditions: Rents soft (-0.1%/yr); 236 active listings in the ZIP; 39 comparable units currently listed for rent nearby; rentals at typical pace (median 20d on market — plan ~3-4 weeks tenant-placement turnaround); 1,511 units permitted in Baltimore County in 2024 (643 in 5+ unit buildings).
- This rent runs 35% of the median local income ($64k/yr) — at the standard rent-burdened threshold; future hikes will face affordability resistance.
Forward outlook
- Local home prices are declining (-3.0%/yr); year-one equity from $691 of loan paydown is wiped out by about $3k of value loss. Plan a longer hold.
- Baltimore County population projected at +12% by 2050 — modest demand growth; plan on rents tracking national, not racing it.
- At projected returns (-3.0% appreciation + 0.0% rent growth), your $28k cash investment doubles in ~5 years — after that, you're playing with house money.
Negotiation context
- It's been on market 16 days — a 2% lower offer ($98k) is reasonable based on typical stale-listing flexibility.
Risks & watch-outs
- Watch-outs: built in 1924 — expect roof / HVAC / electrical / plumbing capex.
- Climate carrying-cost: major wind risk, 27% chance of damaging wind over 30y; extreme-heat days projected 7→15/yr by 2055 (HVAC capex compounding) — expect insurance premiums to compound above CPI over the hold.
Questions for the listing agent
- Built in 1924 — when were the roof, HVAC, electrical panel, plumbing, and water heater last replaced?
- Is there a deadline driving the sale (1031 exchange, divorce, estate, relocation)? That informs how much negotiation room exists.
- Schools are A-rated — typically a magnet for longer-tenancy family renters. What's the average tenant stay here, and is there a school-zone premium baked into asking?
- Crime grade is F in this area — have there been break-ins, vandalism, or insurance claims at this property in the last 3 years? What carrier currently insures it and at what premium?
- What's the average days-on-market for RENTAL listings here right now (not sales)? A rising rental-DOM trend means longer vacancies and softer asking-rent achievability than the comps imply.
- What's the recent tenant-quality profile in this submarket — average credit score on applications, eviction rate, late-payment / NSF rate, and stable-employment percentage? A property-management company in the area should have these aggregated.
- How much new for-sale + rental construction is in the pipeline within 1–3 miles? Heavy new supply typically softens prices + rents 12–24 months out; constrained supply supports both.
Investment metrics
- 1% rule
- 1.90% ✓
- Cap rate
- 15.26%
- Cash-on-cash
- 32.02%
- DSCR
- 2.42
- GRM
- 4.4
CMA / ARV
- ARV (on-the-fly)
- $313,690
- Comps found
- 8
Show comp detail 8 sales within ~0.75 mi
| Address | Dist | Beds/Ba | Sqft | Sold | Price | $/sf | Match |
|---|---|---|---|---|---|---|---|
| 1214 Willow Rd | 0.11mi | 2/2.0 | 1,270 (+3%) | 10mo | $342,000 | $269 | 78 |
| 1237 Willow Rd | 0.21mi | 3/1.0 (+1) | 1,172 (-5%) | 2mo | $299,000 | $255 | 75 |
| 900 Northpoint Rd | 0.54mi | 2/1.0 | 1,248 (+1%) | 2mo | $170,000 | $136 | 71 |
| 7623 Spruce Rd | 0.09mi | 3/2.5 (+1) | 1,352 (+10%) | 5mo | $329,900 | $244 | 65 |
| 7615 Belmont Ave | 0.61mi | 2/2.0 | 1,205 (-2%) | 11mo | $305,000 | $253 | 54 |
| 2700 Delk Ct | 0.72mi | 2/1.0 | 1,245 (+1%) | 17mo | $165,000 | $133 | 51 |
| 1311 Willow Rd | 0.29mi | 3/1.5 (+1) | 1,084 (-12%) | 10mo | $275,000 | $254 | 50 |
| 1235 Willow Rd | 0.20mi | 3/1.0 (+1) | 1,066 (-14%) | 21mo | $300,000 | $281 | 46 |
Match score weights: distance 35% · size 25% · config 20% · recency 20%. Top-matched comps best support the ARV.
Projected returns pro-forma
-3.0% appreciation · 0.0% rent growth · sell at horizon
- IRR
- 23.4%
- Equity multiple
- 1.92×
- Total profit
- $25,882
- Equity at exit
- $14,910
- IRR
- 29.3%
- Equity multiple
- 3.24×
- Total profit
- $62,590
- Equity at exit
- $8,646
Cash invested: $28,000 (down + closing). Projections, not guarantees.
Landlord ↔ Tenant lean methodology
- Overall (STATE)
- 27 Tenant-Leaning
- State Maryland
- 27 Tenant-Leaning · D+14
- County
- — inherits STATE
- City
- — inherits STATE
ZIP-level market 21222
- Rents YoY
- -0.1%
- Active inventory
- 236
- Price-to-rent
- 4.4×
Monthly cashflow live
- Estimated rent
- $1,897 high interval (Pro) →
- Mortgage (P&I)
- −$524
- Tax from tax record
- −$185 /mo · $2,222/yr
- Insurance
- −$42
- HOA
- −$0
- Vacancy / Maint / Mgmt
- −$398
- Net cashflow
- $747
Break-even live
UW: 25.0% down · 7.5% · 30yr · 1.5% tax · 5.0% vac · 8.0% maint · 8.0% mgmt
Financing live
Cash to close
- Down payment
- $25,000
- Closing costs
- $3,000
- Reserves months
- —
- Total cash needed
- —
Loan-product check · same deal, 3 products live
Conventional
25% down · 7.5% · 30yr
- Down + closing
- —
- Monthly P&I
- —
- Monthly cashflow
- —
- DSCR
- —
- Eligible?
- —
Personal DTI + credit; lowest rate.
DSCR
20% down · 8.5% · 30yr
- Down + closing
- —
- Monthly P&I
- —
- Monthly cashflow
- —
- DSCR
- —
- Eligible?
- —
No personal income docs; deal must DSCR.
Hard money
10% down · 12.0% · 12mo
- Down + closing
- —
- Monthly P&I
- —
- Monthly cashflow
- —
- DSCR
- —
- Eligible?
- —
Short-term bridge; refi at stabilization.
Rent comps 39 comps
| Address | Beds | Baths | Sqft | Rent | $/sqft | DOM | Units | Dist |
|---|---|---|---|---|---|---|---|---|
| 7444 Berkshire Rd Baltimore, MD | 3.0 | 1.5 | 1228 | $1,850 | $1.51 | 5d | 1 | 0.39mi |
| 7520 Durwood Rd Dundalk, MD | 3.0 | 1.0 | 1110 | $2,100 | $1.89 | 43d | 1 | 0.43mi |
| 849 Loalan Ave Dundalk, MD | 3.0 | 1.5 | 1024 | $1,850 | $1.81 | 14d | 1 | 0.47mi |
| 7484 Rabon Ave Dundalk, MD | 3.0 | 1.5 | 1499 | $2,000 | $1.33 | 43d | 1 | 0.47mi |
| 944 Dalton Ave Baltimore, MD | 3.0 | 2.0 | 1024 | $2,100 | $2.05 | 10d | 1 | 0.48mi |
| 932 Elton Ave Baltimore, MD | 3.0 | 2.0 | 1024 | $1,950 | $1.90 | 17d | 1 | 0.48mi |
| 7517 Belmont Ave Baltimore, MD | 2.0 | 1.0 | 720 | $1,800 | $2.50 | 17d | 1 | 0.63mi |
| 7 Robinson Ave Dundalk, MD | 3.0 | 2.0 | 1100 | $2,600 | $2.36 | 43d | 1 | 0.63mi |
| 608 Northpoint Rd Baltimore, MD | 3.0 | 1.5 | 1148 | $1,895 | $1.65 | 23d | 1 | 0.84mi |
| 7508 Ives Ln Dundalk, MD | 2.0 | 1.0 | 896 | $1,750 | $1.95 | 43d | 1 | 0.85mi |
| 7911 Bank St Baltimore, MD | 3.0 | 1.0 | 1080 | $1,749 | $1.62 | 43d | 1 | 0.89mi |
| 8036 Lansdale Rd Unit 1 Baltimore, MD | 3.0 | 1.0 | 1024 | $1,775 | $1.73 | 5d | 1 | 0.92mi |
| 414 Westfield Rd Dundalk, MD | 3.0 | 1.0 | 1024 | $2,300 | $2.25 | 43d | 1 | 0.94mi |
| 3000 Wallford Dr Dundalk, MD | 1.0–2.0 | 1.0 | 717 | $1,330 | $1.85 | 2d | 35 | 0.96mi |
| 505 Northpoint Rd Baltimore, MD | 3.0 | 2.0 | 1300 | $2,195 | $1.69 | 11d | 1 | 0.97mi |
| 309 52nd St Unit A Baltimore, MD | 2.0 | 1.0 | 722 | $1,350 | $1.87 | 23d | 1 | 1.08mi |
| 7915 Eastdale Rd Baltimore, MD | 2.0 | 1.0 | 896 | $1,500 | $1.67 | 43d | 1 | 1.08mi |
| 7948 Eastdale Rd Baltimore, MD | 3.0 | 1.0 | 1024 | $1,700 | $1.66 | 43d | 1 | 1.09mi |
| 7951 E Baltimore St Baltimore, MD | 3.0 | 1.0 | 1024 | $1,750 | $1.71 | 2d | 1 | 1.12mi |
| 3221 Wallford Dr Unit 3221 Dundalk, MD | 3.0 | 1.0 | 1008 | $1,750 | $1.74 | 5d | 1 | 1.14mi |
| 3221 Wallford Dr Dundalk, MD | 3.0 | 1.0 | 1008 | $1,750 | $1.74 | 3d | 1 | 1.14mi |
| 7716 Wynbrook Rd Baltimore, MD | 2.0 | 1.0 | 1232 | $1,800 | $1.46 | 43d | 1 | 1.16mi |
| 3314 Wallford Dr Dundalk, MD | 3.0 | 1.0 | 1258 | $1,850 | $1.47 | 14d | 1 | 1.17mi |
| 3317 Belsford Ct Dundalk, MD | 3.0 | 1.0 | 1258 | $1,950 | $1.55 | 10d | 1 | 1.21mi |
| 7261 Bridgewood Dr Baltimore, MD | 3.0 | 2.0 | 896 | $2,495 | $2.78 | 23d | 1 | 1.22mi |
| 7325 Conley St Baltimore, MD | 3.0 | 2.0 | 1290 | $1,950 | $1.51 | 17d | 1 | 1.23mi |
| 7319 Conley St Baltimore, MD | 3.0 | 2.0 | 1080 | $1,950 | $1.81 | 17d | 1 | 1.24mi |
| 3427 North Point Rd Dundalk, MD | 3.0 | 1.0 | 1008 | $2,250 | $2.23 | 20d | 1 | 1.28mi |
| 3413 Wallford Dr Dundalk, MD | 3.0 | 2.0 | 1016 | $2,000 | $1.97 | 43d | 1 | 1.28mi |
| 630 47th St Unit B Baltimore, MD | 2.0 | 1.0 | 750 | $1,200 | $1.60 | 43d | 1 | 1.31mi |
| 628 47th St Apt RW2 Baltimore, MD | 2.0 | 1.0 | 750 | $1,200 | $1.60 | 10d | 1 | 1.32mi |
| 7230 Conley St Unit 1 Baltimore, MD | 3.0 | 1.5 | 1144 | $2,100 | $1.84 | 3d | 1 | 1.33mi |
| 7230 Conley St Unit 1 Baltimore, MD | 3.0 | 1.5 | 1144 | $2,100 | $1.84 | 23d | 1 | 1.33mi |
| 1955 Walnut Ave Dundalk, MD | 3.0 | 1.0 | 950 | $2,300 | $2.42 | 43d | 1 | 1.33mi |
| 530 47th St Baltimore, MD | 3.0 | 1.0 | 1424 | $1,750 | $1.23 | 23d | 1 | 1.34mi |
| 8146 Del Haven Rd Dundalk, MD | 3.0 | 2.0 | 1424 | $2,700 | $1.90 | 16d | 1 | 1.44mi |
| 7917 Wise Ave Dundalk, MD | 2.0 | 1.5 | 1500 | $2,500 | $1.67 | 23d | 1 | 1.45mi |
| 7124 Gough St Baltimore, MD | 2.0 | 1.5 | 1096 | $1,700 | $1.55 | 21d | 1 | 1.46mi |
| 7058 Eastbrook Ave Baltimore, MD | 3.0 | 2.0 | 1228 | $1,700 | $1.38 | 11d | 1 | 1.46mi |
Listing history 11 events
-
2026-06-18days on market $100,000 Coming Soon 16 DOM
-
2026-06-17days on market $100,000 Coming Soon 15 DOM
-
2026-06-16days on market $100,000 Coming Soon 14 DOM
-
2026-06-15days on market $100,000 Coming Soon 13 DOM
-
2026-06-13days on market $100,000 Coming Soon 11 DOM
-
2026-06-09days on market $100,000 Coming Soon 7 DOM
-
2026-06-08days on market $100,000 Coming Soon 6 DOM
-
2026-06-07days on market $100,000 Coming Soon 5 DOM
-
2026-06-04days on market $100,000 Coming Soon 2 DOM
-
2026-06-02remarks 699-char remark
-
2026-06-02$100,000 Coming Soon 1 DOM
ⓘ Source: listings_history table (triggers on properties + properties_extension) + one-shot
backfill from property_details.listing_events for pre-trigger history.
Tax reassessment forecast MD · Partial reset (capped growth)
- Current annual tax
- $2,222 · $185/mo
- Projected year-2 tax
- $2,222 · $185/mo
- Expected delta
- $0/yr ($0/mo · 0.0%)
ⓘ Screening estimate from a state-policy table — verify with the county assessor before closing.
Climate risk First Street
- Flood 1/10 Low FEMA zone X (unshaded) · 0% chance over 30 yrs
- Wildfire 1/10 Low
- Heat 8/10 Severe 7 d/yr ≥103°F today · 15 d/yr by 30 yrs out
- Wind 6/10 Major 27% chance of damaging wind over 30 yrs
- Air quality 5/10 Major 6 unhealthy d/yr today · 8 by 30 yrs out
Nearby sold comps map
Loading sold comps map…
Walkable amenities ~0.75 mi
Loading nearby amenities…
Taxation est. · year 1
- Rental income
- $22,759
- − Mortgage interest
- −$5,602
- − Property taxes
- −$2,222
- − Insurance
- −$500
- − Repairs & maintenance
- −$1,821
- − Management
- −$1,821
- − Depreciation
- −$2,909
- Taxable income
- $7,885
- Est. tax owed @ 24.0%
- −$1,892
- After-tax cash flow
- $7,072/yr
For passive investors: Depreciation is non-cash, so a rental often shows a tax loss while cash-flowing — sheltering income. Rental losses are passive: they offset passive income freely, and up to $25,000/yr can offset ordinary (W-2) income if you actively participate and your MAGI is under $100k (phasing out to $0 by $150k); unused losses carry forward. On sale, claimed depreciation is recaptured at up to 25%, and gains may owe capital-gains tax (a 1031 exchange can defer both). Figures are a year-1 estimate at your 24.0% rate — not tax advice; consult a CPA.
Schools (NCES district)
- District
- Baltimore County Public Schools
- NCES district ID
- 2400120
- Math proficiency
- 15% ▼ -16.00%
- Reading proficiency
- 34% ▼ -5.00%
- Median HH income
- $66,746
- Composite
- 23.17/100
- National rank
- #7948
- State rank
- #11 of 24 in MD
Livability — Dundalk
- Score
- 85/100
- State rank
- #16
- US rank
- #510
Category grades
Schools grade is shown separately in the Schools card above.
Census & demographics
- Census place
- Dundalk, MD
- County
- Baltimore County · 769,527 people
- City population
- 59,407
- Metro
- Baltimore-Columbia-Towson, MD
- Population (ZIP)
- 59,407
- Household income
- $64,141
- Rent vs Own
- Severe rent burden
- 2566.0
Population outlook (Baltimore County) Hauer SSP2
- Today (2025)
- 885,518 people
- By 2030
- 909,272 · +2.7%
- By 2040
- 951,547 · +7.5%
- By 2050
- 990,955 · +11.9%
- By 2075
- 1,086,411 · +22.7%
- By 2100
- 1,135,078 · +28.2%
Race, ethnicity, and origin ACS 2023
- Neighborhood character
- Diverse neighborhood (Simpson 0.60)
- Race & ethnicity
- White 59% Black 18% Hispanic / Latino 15% Two or more races 7% Asian 2% Native American 1%
- Hispanic origin (detail)
- Mexican 3% Puerto Rican 2%
- Common ancestry
- Romanian 7% Lithuanian 1% Italian 1%
- Foreign-born
- 9% · Canada
- Languages at home
- 85% English-only · Spanish 11% Other Indo-European 2% Arabic 1%
Political lean MEDSL · Baltimore
- 2024 margin
- Strong D (+24.5) · D 61.0% · R 36.5% · Other 2.5%
- 2008→2024 swing
- +9.9pp toward D · 2008: 14.6pp · 2024: 24.5pp
- All cycles
- 2024: D+24.5 2020: D+27.0 2016: D+17.4 2012: D+16.4 2008: D+14.6
Not yet ingested
- Civics
- —
Market trends
- HPI YoY
- ▼ -251.44%
- Current HPI
- 228.4218
- Rent YoY
- ▼ -0.09%
- Metro
- Baltimore-Columbia-Towson, MD
- State GDP YoY
- ▲ 2.97%
- F500 in state
- 12
Industry mix (Fortune 500 HQ in MD)
| Industry | F500 HQs | Revenue |
|---|---|---|
| Aerospace / Defense | 1 | $71B |
|
||
| Utilities | 1 | $25B |
|
||
| Hotels | 1 | $24B |
|
||
| Consumer Goods | 1 | $7B |
|
||
| Real Estate | 1 | $6B |
|
||
| Chemicals | 1 | $2B |
|
||
Price history
1 event — show timeline
- 2026-06-02 Coming Soon $100,000 BRIGHT MLS
Property tax history
+10.9%/yrLatest (2025): $2,222 · +4.4% YoY. Source: county tax records.
Cash-flow waterfall
monthlySold comps — $/sqft
last 12 mo · ≤1 miLoading sold comps…